Figure 1
Figure 2
Figure 3
Figure 4
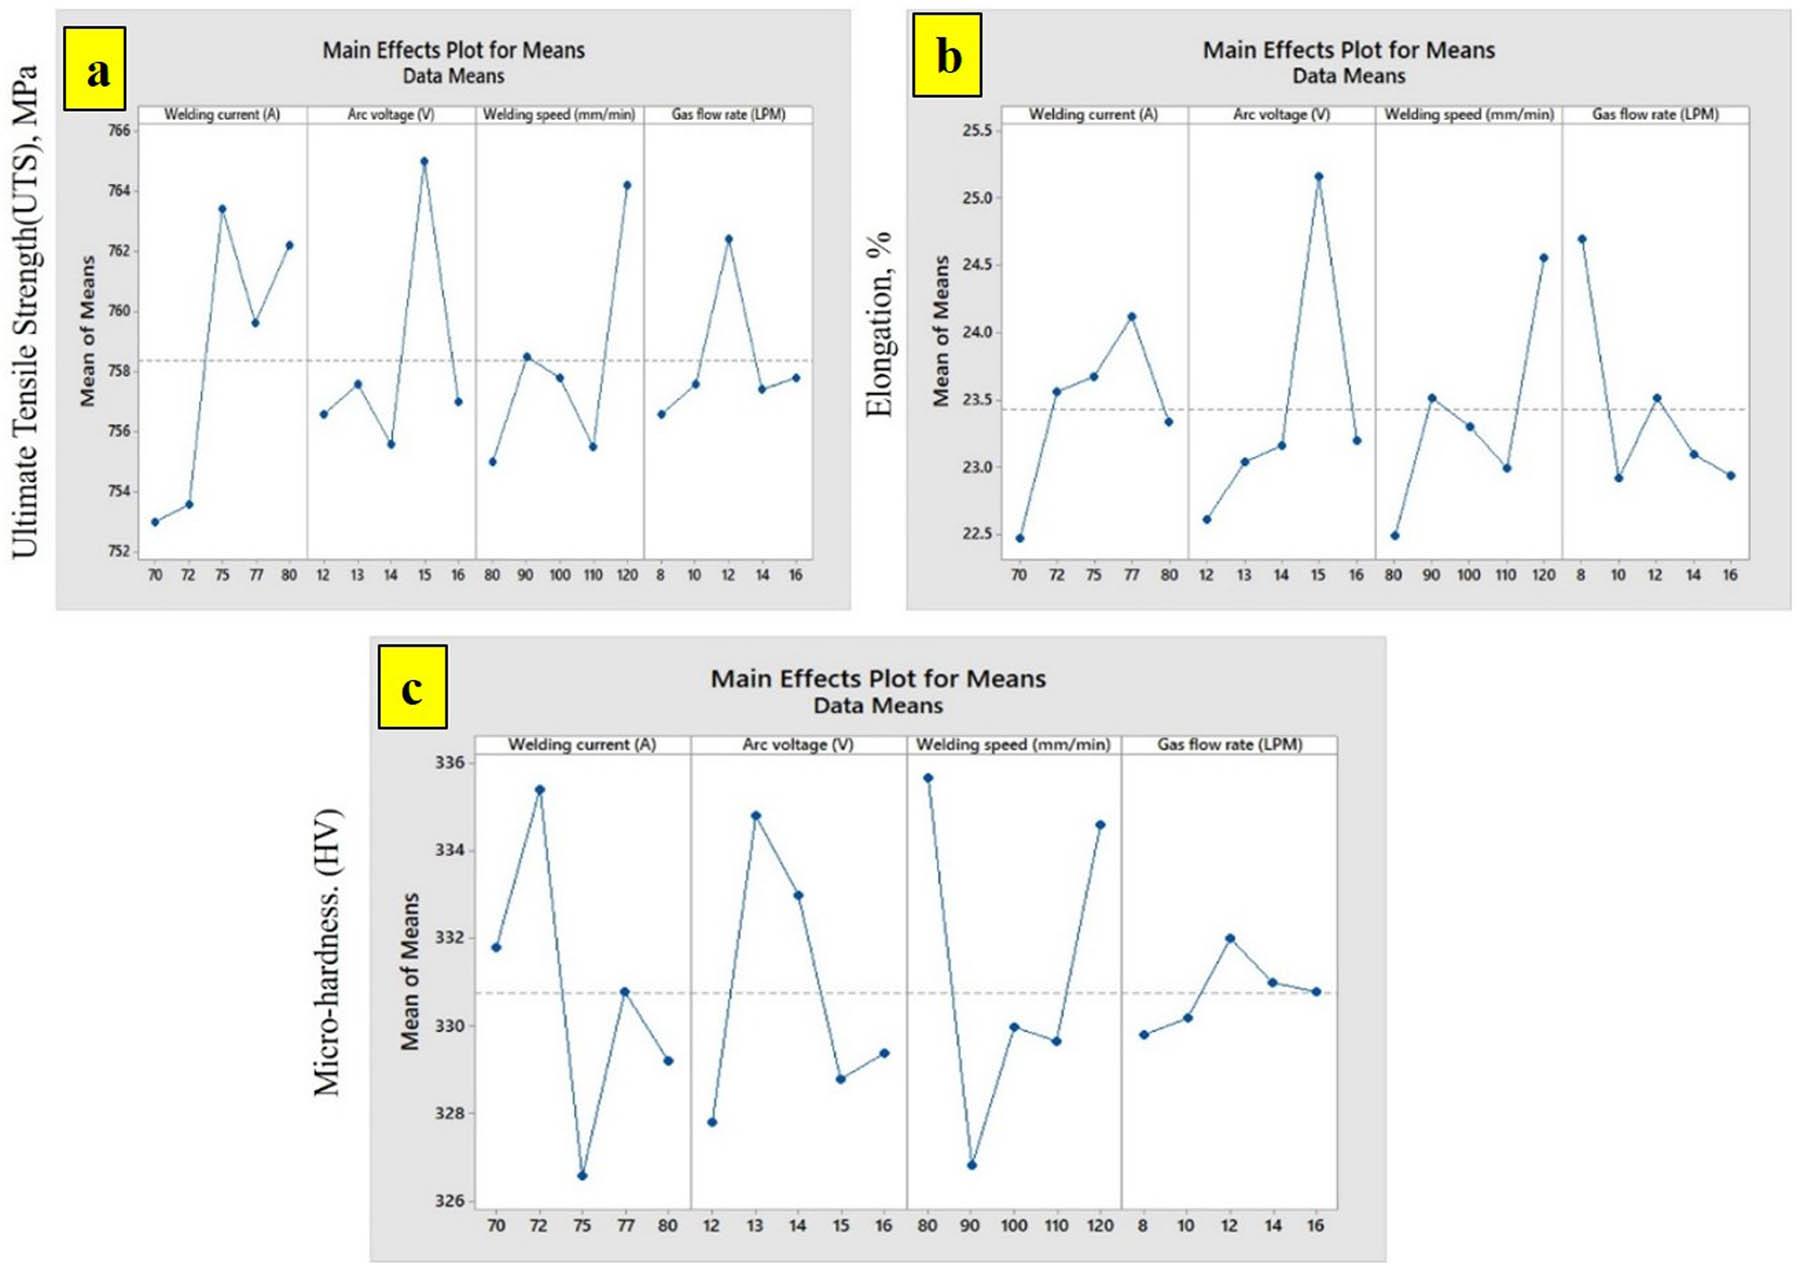
Figure 5
Figure 6
Figure 7
Figure 8
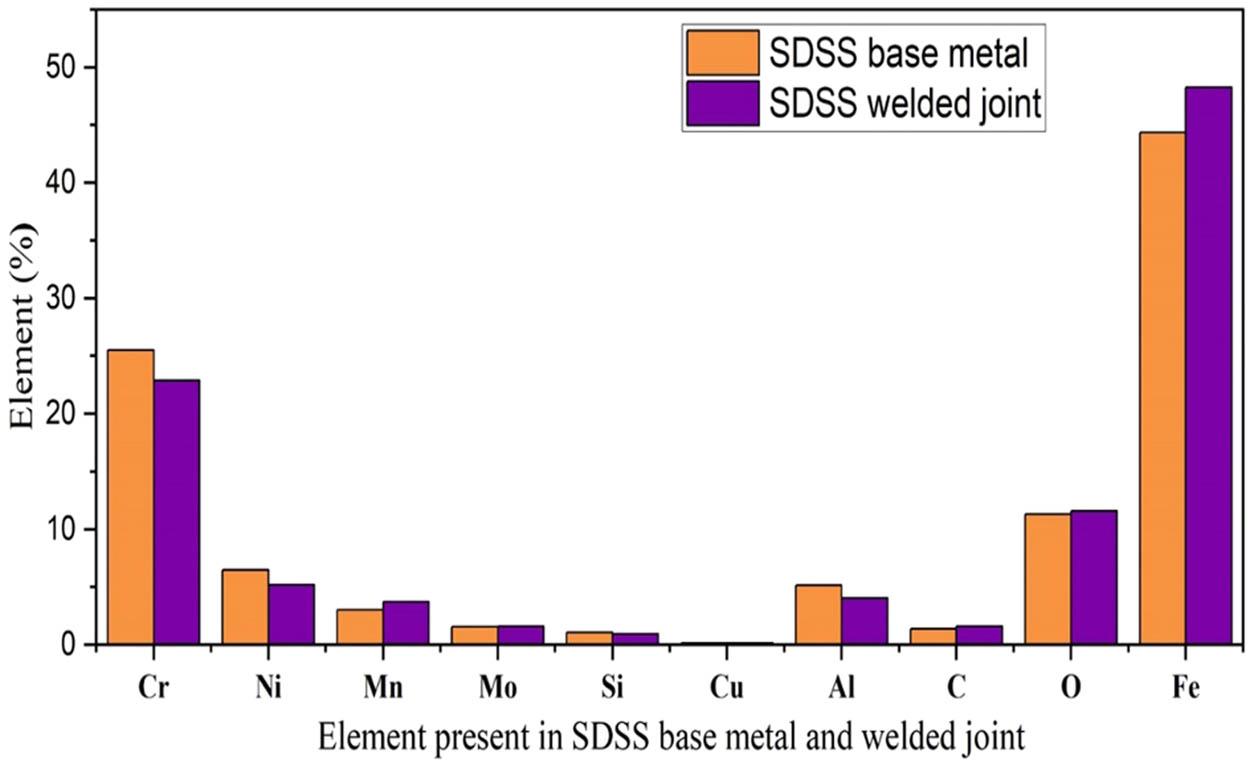
Figure 9
Figure 10
Figure 11
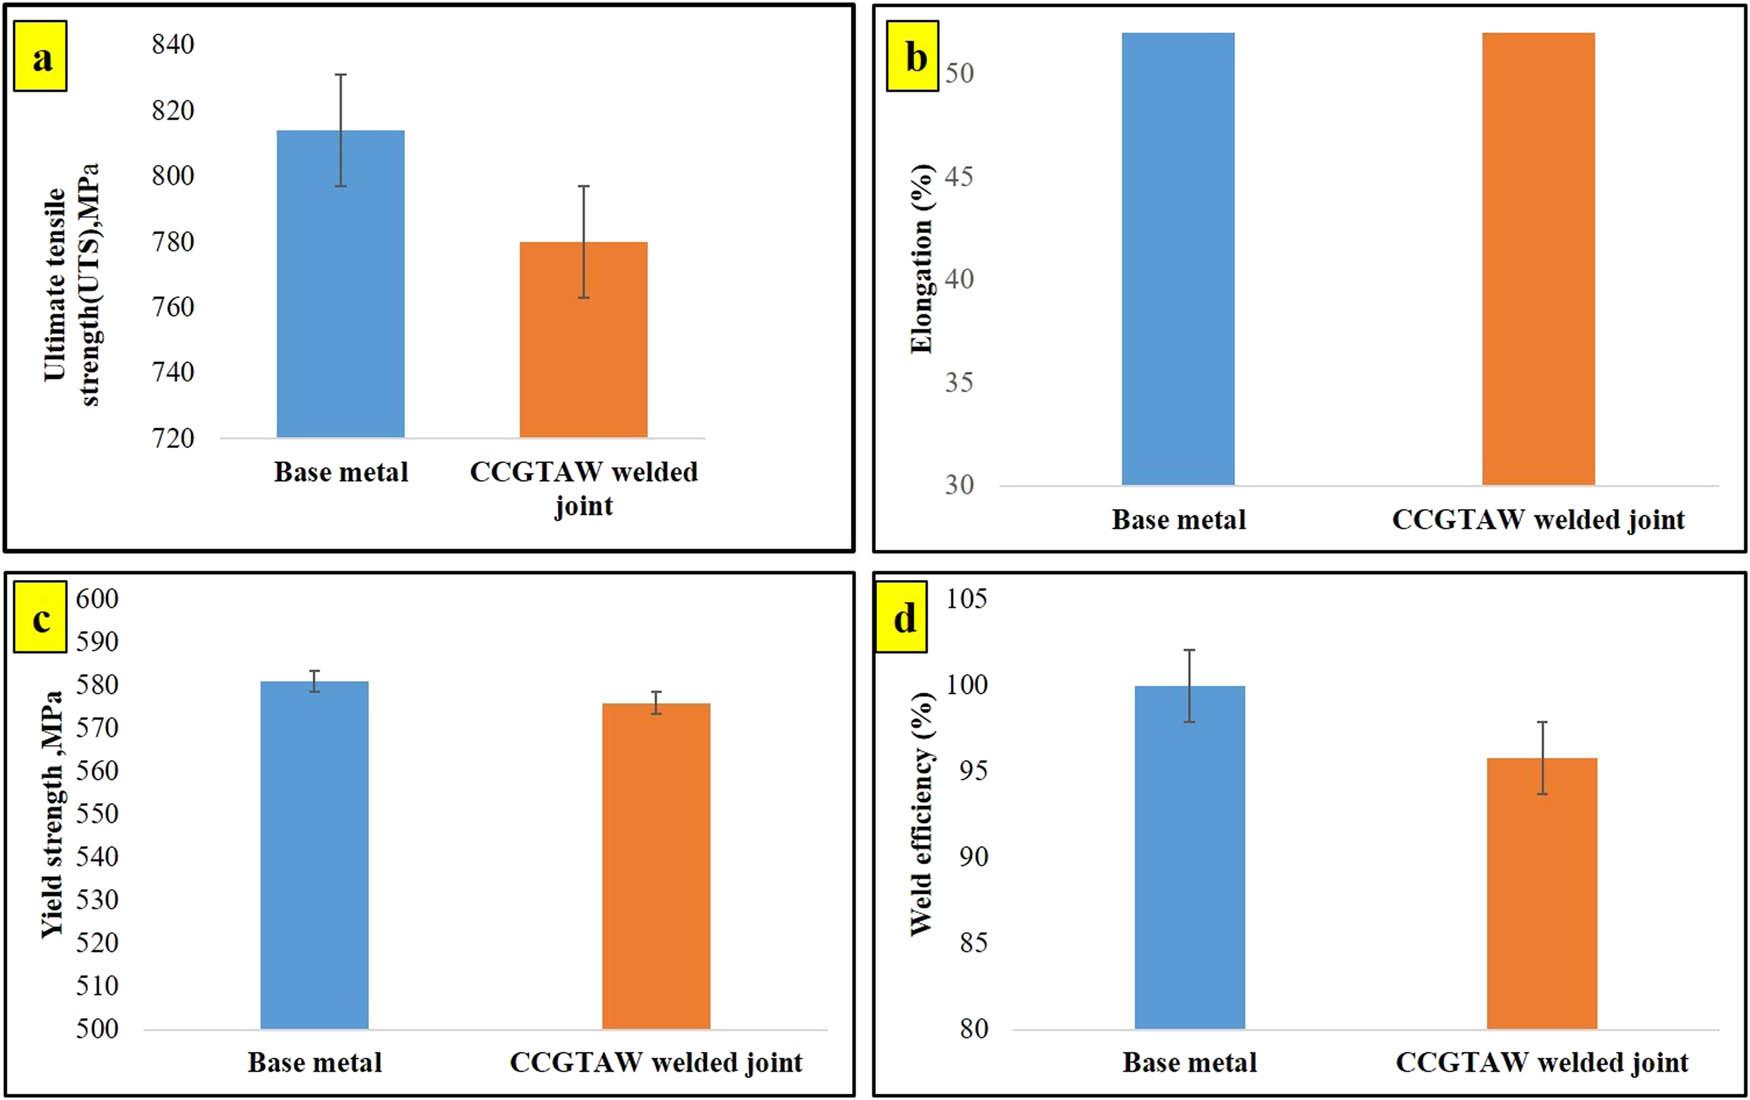
Figure 12
Figure 13
Figure 14
Response table for S/N ratios for UTS (larger is better)_
| Level | Welding current (A) | Arc potential (V) | Feed rate (mm/min) | Argon gas flow rate (L/min) |
|---|---|---|---|---|
| 1 | 57.51 | 57.57 | 57.56 | 57.57 |
| 2 | 57.54 | 57.57 | 57.59 | 57.57 |
| 3 | 57.60 | 57.56 | 57.56 | 57.59 |
| 4 | 57.60 | 57.59 | 57.56 | 57.57 |
| 5 | 57.61 | 57.58 | 57.59 | 57.57 |
| Delta | 0.10 | 0.04 | 0.03 | 0.02 |
| Rank | 1 | 2 | 3 | 4 |
Chemical structure of SDSS_
| Element | Cr | Mo | Si | N | Ni | O | C | Cu | Fe |
|---|---|---|---|---|---|---|---|---|---|
| Weight (%) | 25.7 | 3.01 | 0.32 | 0.23 | 7.3 | 0.9 | 0.1 | 0.21 | Balance |
L25 array for TIG parameters and their corresponding output_ Italic and bold text shows optimized parameters of welded joint_
| Experiment | Factors | Outputs | ||||||
|---|---|---|---|---|---|---|---|---|
| Welding current (A) | Arc potential (V) | Feed rate (mm/min) | Argon gas flow rate (LPM) | UTS (MPa) | Elongation (%) | Hardness (HV) | Heat input (kJ/mm) | |
| 1 | 70 | 12 | 80 | 8 | 754 | 22.7 | 330 | 0.567 |
| 2 | 70 | 13 | 90 | 10 | 753 | 22.6 | 331 | 0.546 |
| 3 | 70 | 14 | 100 | 12 | 752 | 23.4 | 332 | 0.529 |
| 4 | 70 | 15 | 110 | 14 | 751 | 22.2 | 332 | 0.515 |
| 5 | 70 | 16 | 120 | 16 | 755 | 21.5 | 334 | 0.504 |
| 6 | 72 | 12 | 90 | 12 | 755 | 22.5 | 335 | 0.518 |
| 7 | 72 | 13 | 100 | 14 | 756 | 21.8 | 334 | 0.505 |
| 8 | 72 | 14 | 110 | 16 | 751 | 22.6 | 335 | 0.495 |
| 9 | 72 | 15 | 120 | 8 | 754 | 29.7 | 336 | 0.486 |
| 10 | 72 | 16 | 80 | 10 | 752 | 21.2 | 337 | 0.778 |
| 11 | 75 | 12 | 90 | 16 | 755 | 21.3 | 323 | 0.540 |
| 12 | 75 | 13 | 100 | 8 | 756 | 23.9 | 331 | 0.527 |
| 13 | 75 | 14 | 110 | 10 | 754 | 22.8 | 332 | 0.515 |
| 14 | 75 | 15 | 120 | 12 | 789 | 24.7 | 325 | 0.506 |
| 15 | 75 | 16 | 90 | 14 | 763 | 25.7 | 322 | 0.720 |
| 16 | 77 | 12 | 110 | 10 | 761 | 24.4 | 324 | 0.454 |
| 17 | 77 | 13 | 120 | 12 | 758 | 23.2 | 340 | 0.450 |
| 18 | 77 | 14 | 80 | 14 | 759 | 23.6 | 340 | 0.728 |
| 19 | 77 | 15 | 90 | 16 | 763 | 25.6 | 324 | 0.693 |
| 20 | 77 | 16 | 100 | 8 | 757 | 23.8 | 326 | 0.665 |
| 21 | 80 | 12 | 110 | 14 | 758 | 22.2 | 327 | 0.471 |
| 22 | 80 | 13 | 120 | 16 | 765 | 23.7 | 338 | 0.468 |
| 23 | 80 | 14 | 90 | 8 | 762 | 23.4 | 326 | 0.672 |
| 24 | 80 | 15 | 100 | 10 | 768 | 23.6 | 327 | 0.648 |
| 25 | 80 | 16 | 110 | 12 | 758 | 23.8 | 328 | 0.628 |
Response table for S/N ratios for micro-hardness (smaller is better)_
| Level | Welding current (A) | Arc potential (V) | Feed rate (mm/min) | Argon gas flow rate (L/min) |
|---|---|---|---|---|
| 1 | −48.86 | −48.95 | −48.95 | −48.96 |
| 2 | −48.87 | −48.93 | −48.92 | −48.97 |
| 3 | −48.95 | −48.96 | −48.96 | −48.95 |
| 4 | −49.01 | −48.94 | −48.96 | −48.93 |
| 5 | −49.00 | −48.92 | −48.93 | −48.90 |
| Delta | 0.15 | 0.04 | 0.04 | 0.07 |
| Rank | 1 | 3 | 4 | 2 |
Ferrite percentage of SDSS in the FZ and HAZ with varying heat input_
| Heat input (kJ/mm) | Top weld | Root weld | Top HAZ | Root HAZ |
|---|---|---|---|---|
| 0.546 | 66 | 33 | 62 | 58 |
| 0.486 | 57 | 30 | 59 | 57 |
| 0.506 | 50 | 27 | 58 | 55 |
| 0.495 | 48 | 26 | 55 | 52 |
Mechanical properties of SDSS grade 2507 [37]_
| Grade | UTS (MPa) | 0.2% proof yield strength (MPa) | Minimum elongation (%) | Hardness | |
|---|---|---|---|---|---|
| Rockwell hardness | Brinell hardness | ||||
| 2507 | 800–850 | 550–560 | 14–15 | 31–33 | 309–312 |
Results of ANOVA_
| Source | DF | Adj SS | Adj MS | F-value | P-value | Contribution (%) |
|---|---|---|---|---|---|---|
| Welding current | 4 | 309.75 | 77.436 | 6.12 | 0.015 | 46.95 |
| Arc potential | 4 | 18.43 | 4.607 | 0.36 | 0.828 | 10.25 |
| Feed rate | 4 | 41.63 | 10.406 | 0.82 | 0.546 | 13.26 |
| Argon gas flow rate | 4 | 18.52 | 4.631 | 0.37 | 0.826 | 24.56 |
| Error | 8 | 101.15 | 12.644 | 4.98 | ||
| Total | 24 | 490.26 |
Response table for S/N ratios for elongation (%) (larger is better)_
| Level | Welding current (A) | Arc potential (V) | Feed rate (mm/min) | Argon gas flow rate (L/min) |
|---|---|---|---|---|
| 1 | 26.60 | 27.00 | 26.91 | 26.97 |
| 2 | 26.80 | 27.04 | 27.21 | 27.03 |
| 3 | 27.32 | 26.91 | 26.95 | 27.25 |
| 4 | 27.28 | 27.26 | 26.96 | 27.07 |
| 5 | 27.35 | 27.14 | 27.25 | 27.03 |
| Delta | 0.75 | 0.35 | 0.34 | 0.29 |
| Rank | 1 | 2 | 3 | 4 |
TIG process settings_
| S. No | TIG parameters | Range |
|---|---|---|
| 1 | Welding current intensity (A) | 70–80 |
| 2 | Arc potential (V) | 12–16 |
| 3 | Feed rate (mm/min) | 80–120 |
| 4 | Argon gas flow rate (L/min) | 8–16 |
Process parameters for the TIG bead on plate_
| TIG parameters | Unit | Level | ||||
|---|---|---|---|---|---|---|
| 1 | 2 | 3 | 4 | 5 | ||
| Welding current | A | 70 | 72 | 75 | 77 | 80 |
| Arc potential | V | 12 | 13 | 14 | 15 | 16 |
| Feed rate | mm/min | 80 | 90 | 100 | 110 | 120 |
| Argon gas flow rate | L/mm | 8 | 10 | 12 | 14 | 16 |