
Table 1
Chemical composition of P91 and P92 (mass fraction, %).
| Materials | C | Mn | P | S | Si | Cr | Mo | V | Nb | N | Ni |
|---|---|---|---|---|---|---|---|---|---|---|---|
| P91 | 0.10 | 0.35 | 0.015 | 0.005 | 0.28 | 8.77 | 0.92 | 0.21 | 0.08 | 0.05 | 0.20 |
| Materials | C | Mn | P | S | Si | Cr | Mo | V | W | Nb | N | B |
|---|---|---|---|---|---|---|---|---|---|---|---|---|
| P92 | 0.08 | 0.55 | 0.012 | 0.003 | 0.38 | 4.89 | 0.52 | 1.21 | 1.78 | 0.07 | 0.010 | 0.003 |
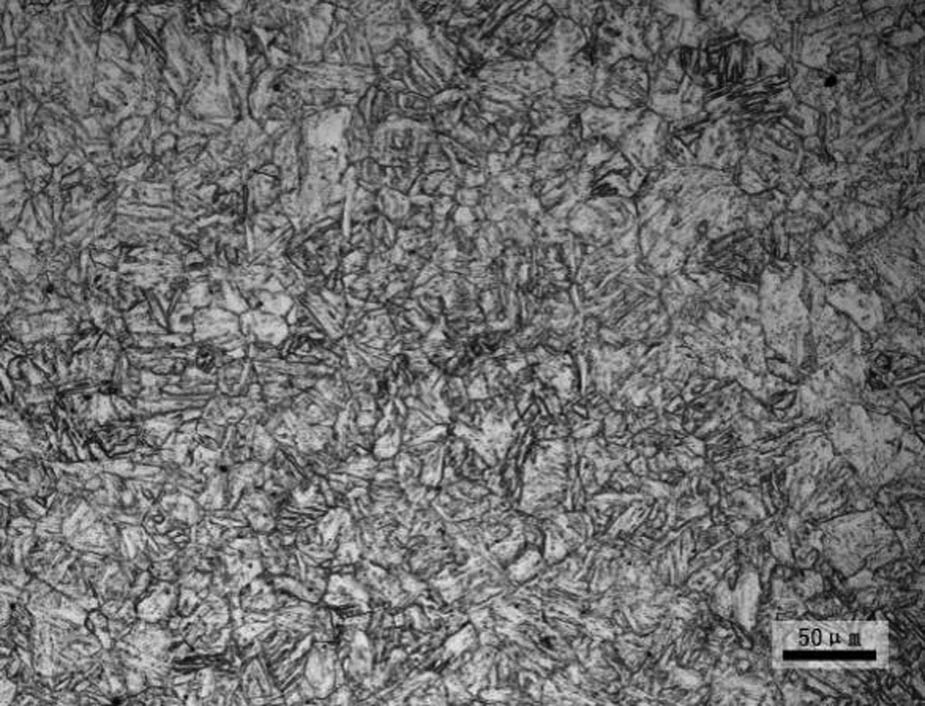
Figure 1
Metallographic morphology of P91 steel.
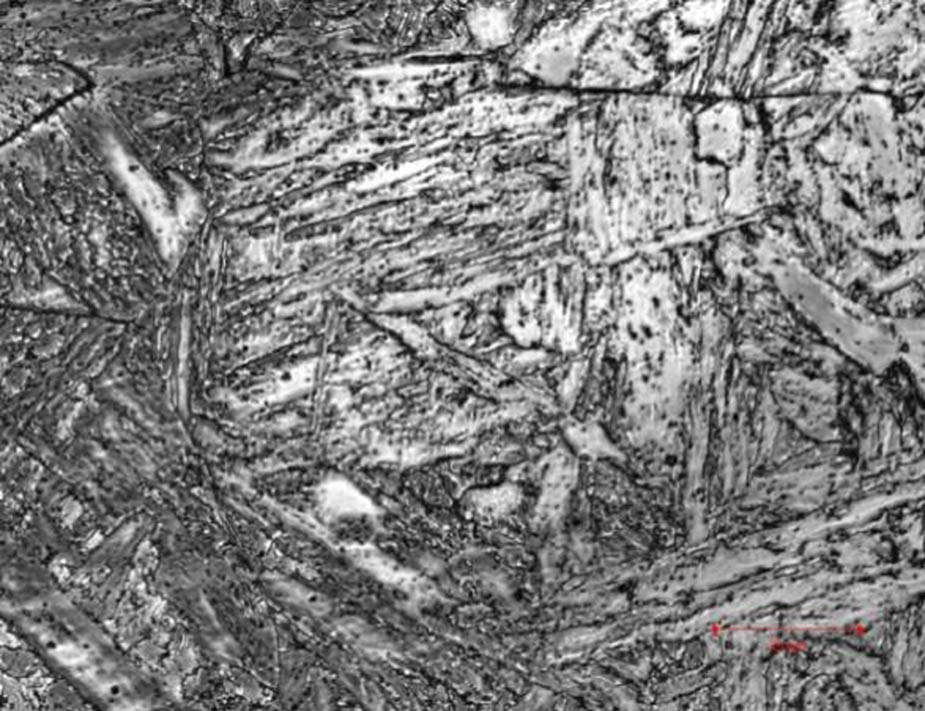
Figure 2
Metallographic morphology of P92 steel (laser confocal microscopy).
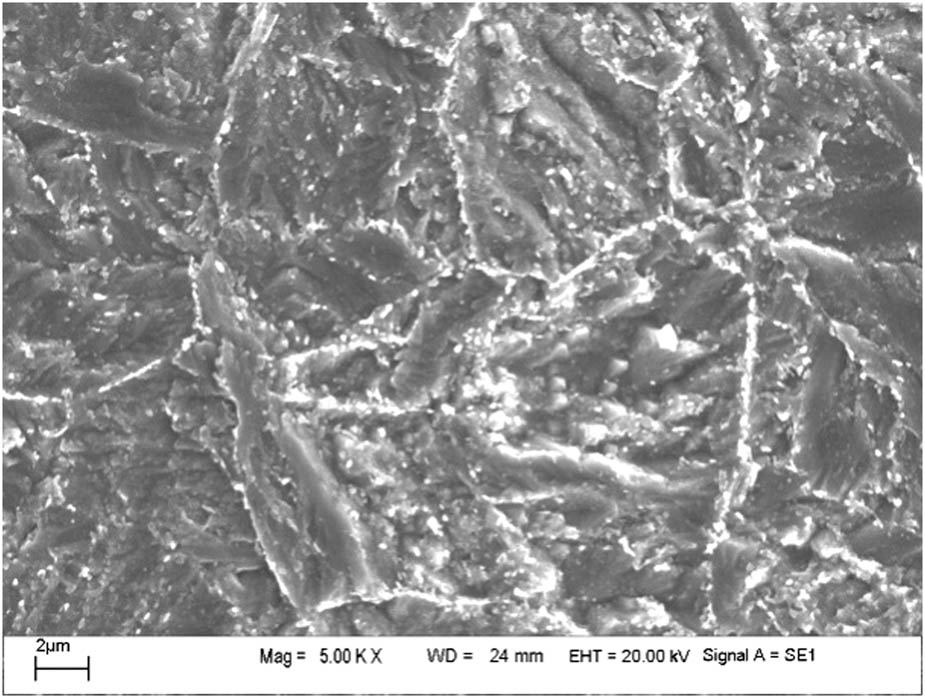
Figure 3
Microstructure morphology of P91 steel (SEM).
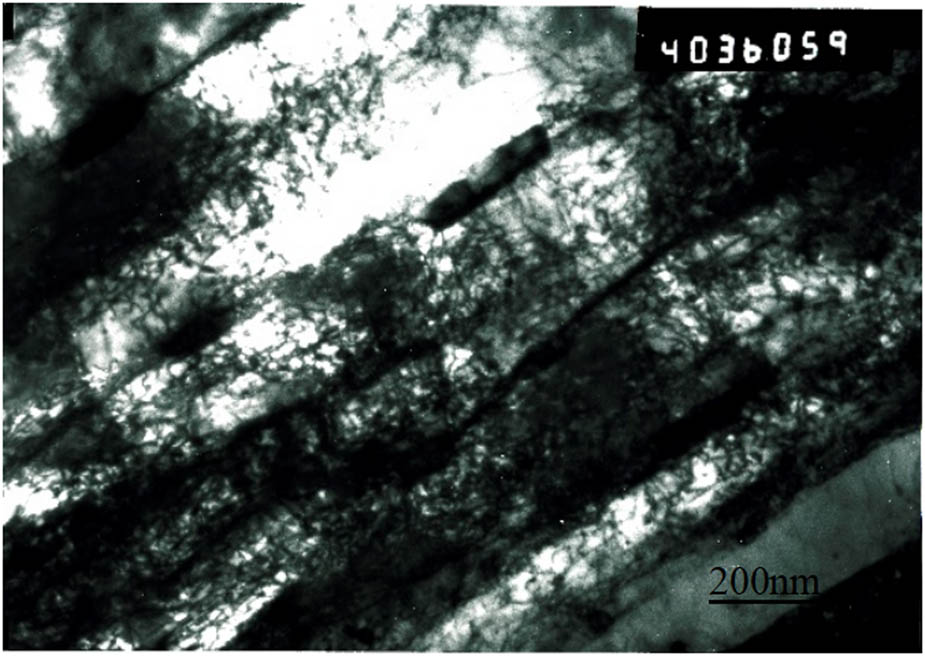
Figure 4
Microstructure morphology of P91 steel (TEM).
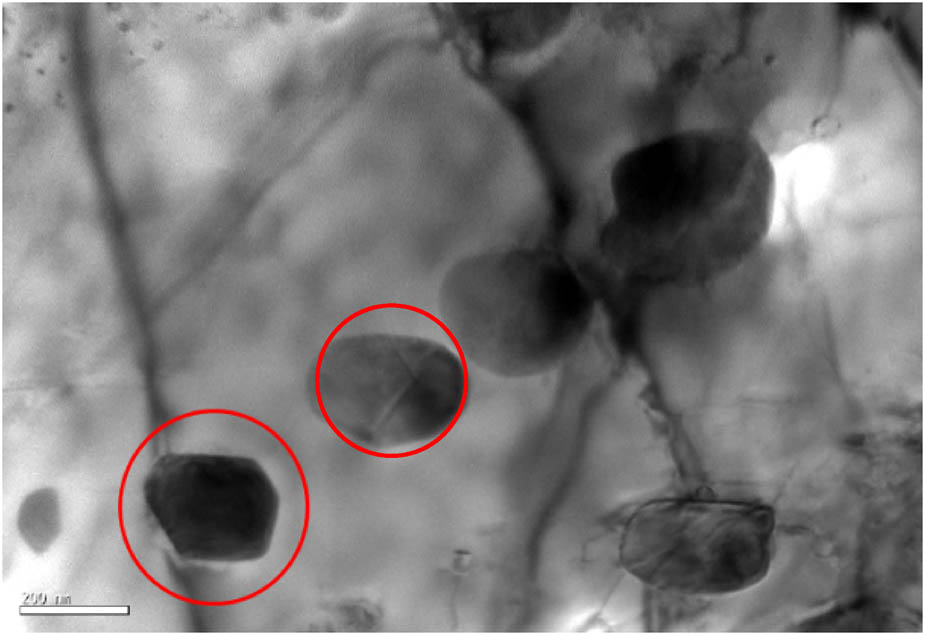
Figure 5
Polygonal and spherical M23C6.
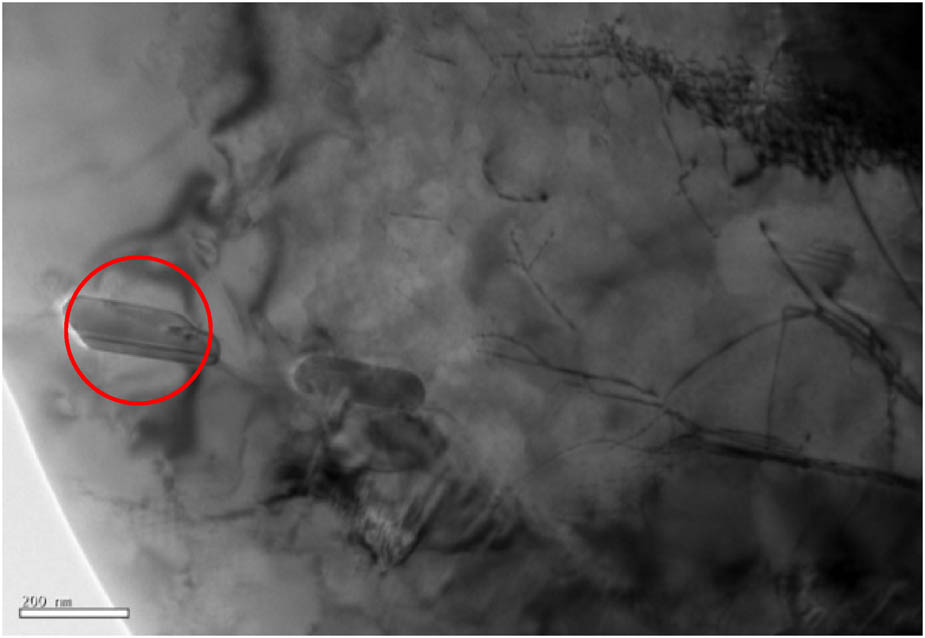
Figure 6
Strip-like M23C6.
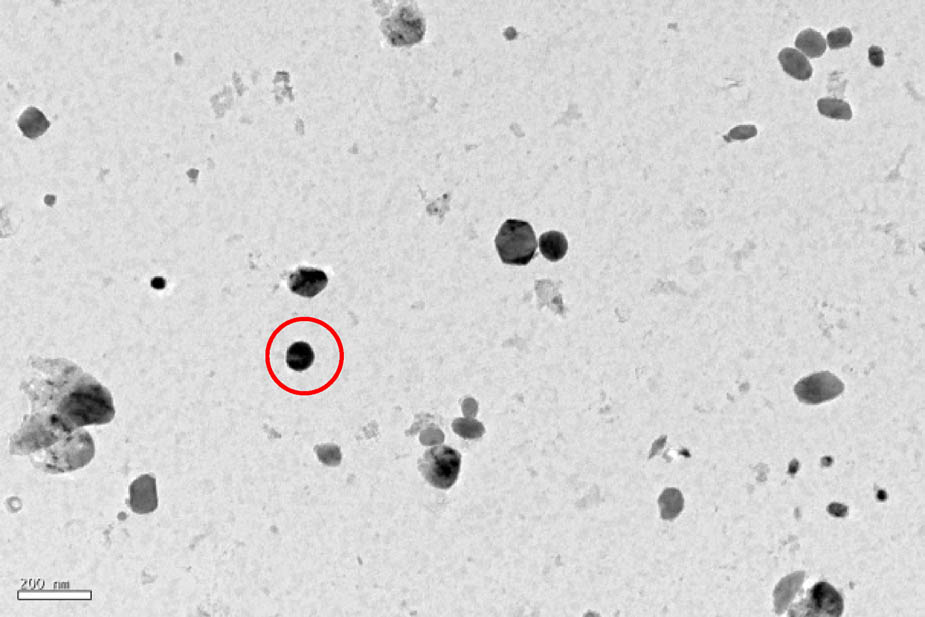
Figure 7
Spherical MX phase.
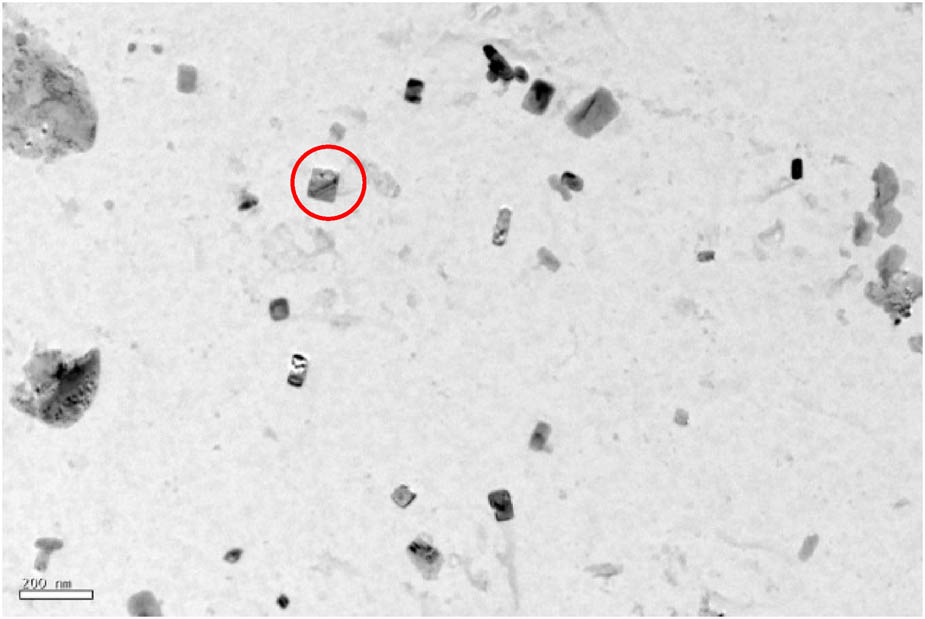
Figure 8
Cubic MX phase.
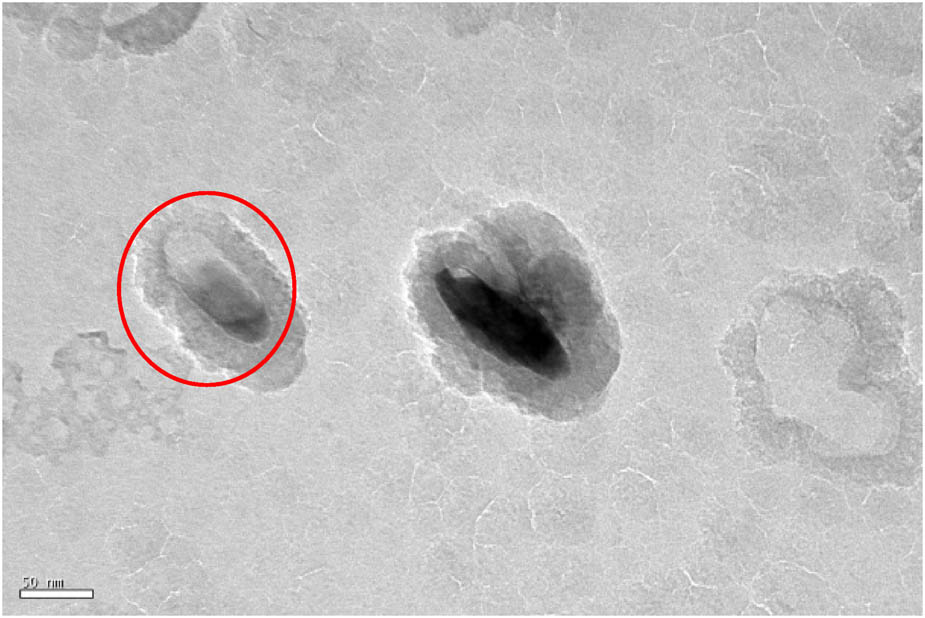
Figure 9
Short rod MX phase.
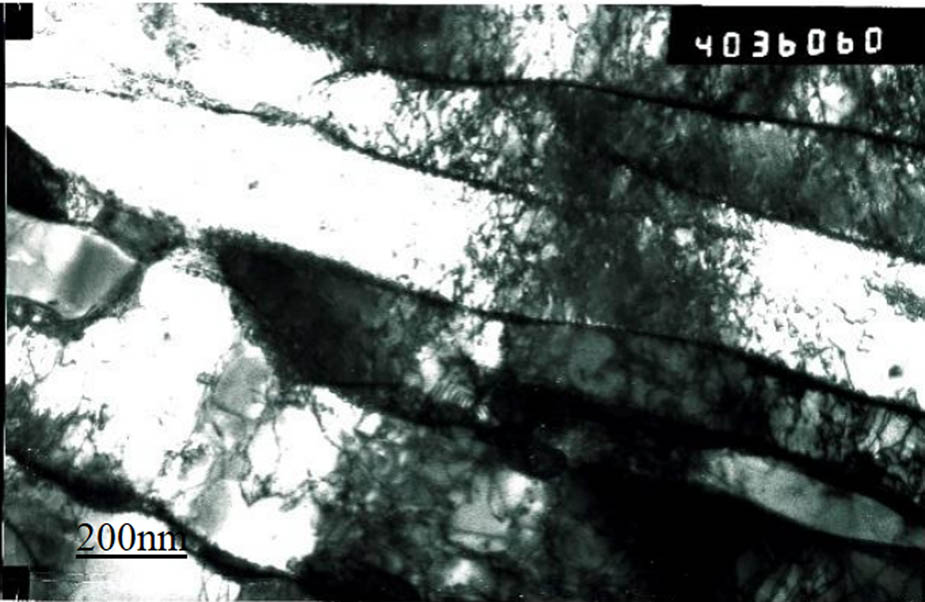
Figure 10
Martensite lath and dislocation entanglement.
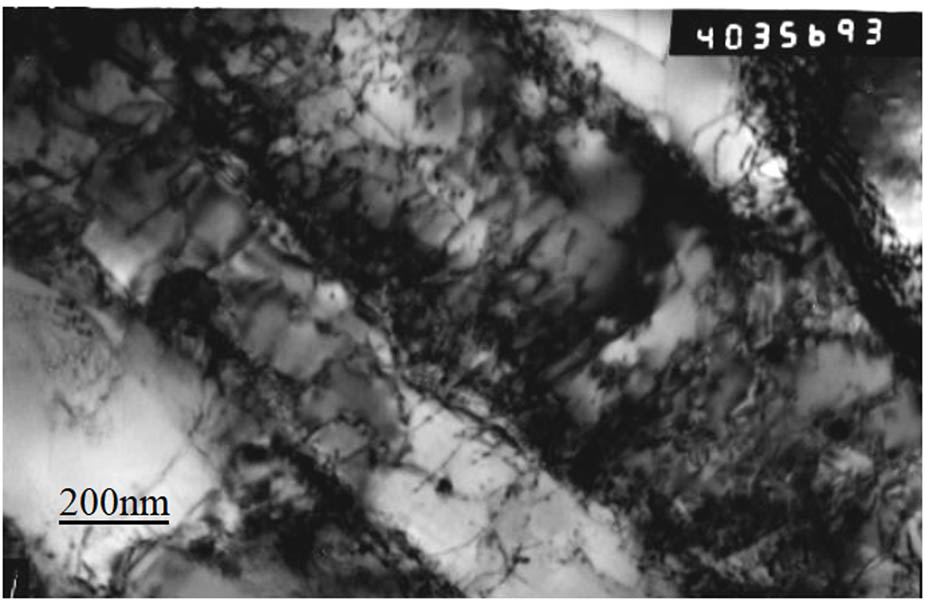
Figure 11
Microstructure of martensitic steel after 40,000 h of operation.
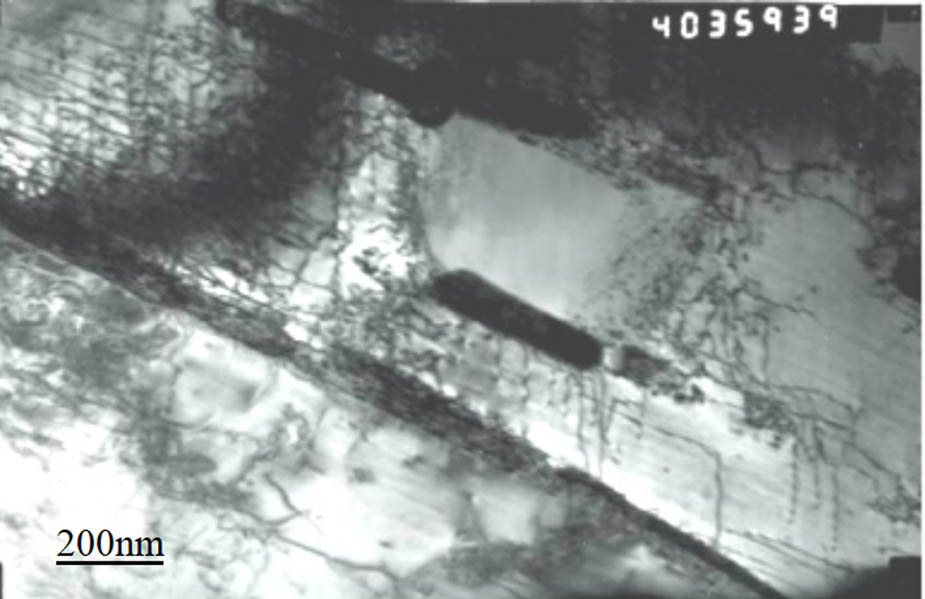
Figure 12
Microstructure of martensitic steel after 90,000 h of operation.
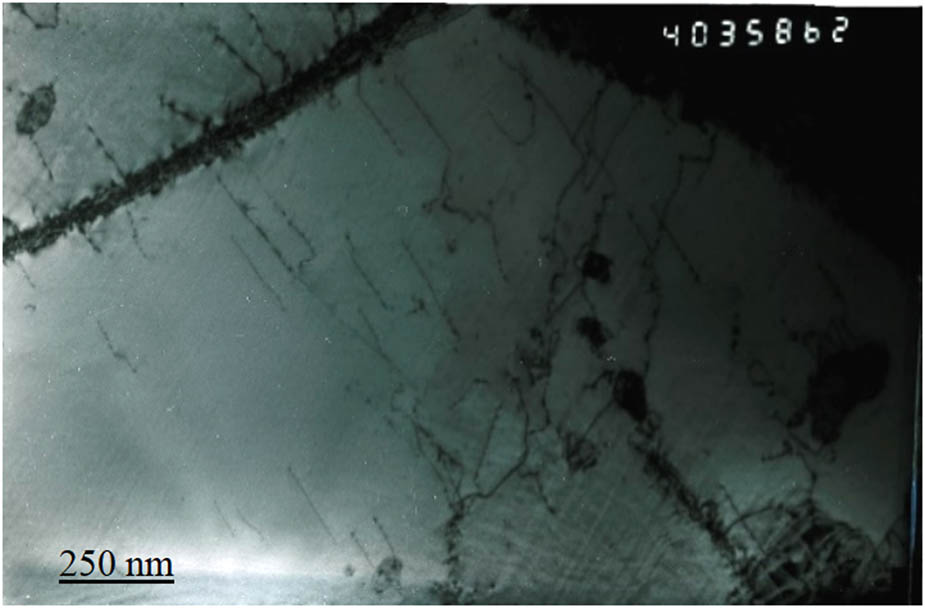
Figure 13
Microstructure of P91 steel with abnormal heat treatment.
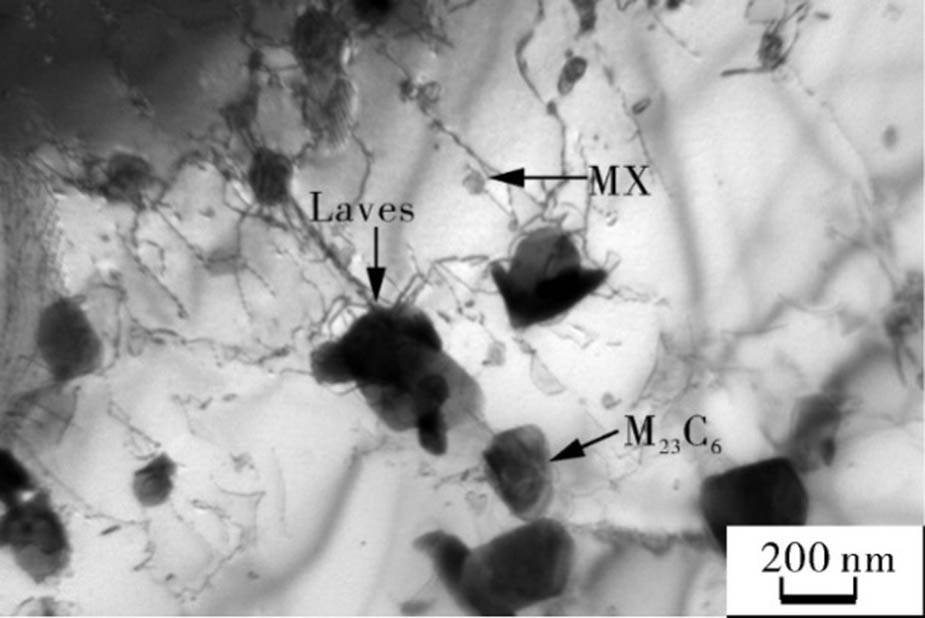
Figure 14
Laves phase in martensitic steel.
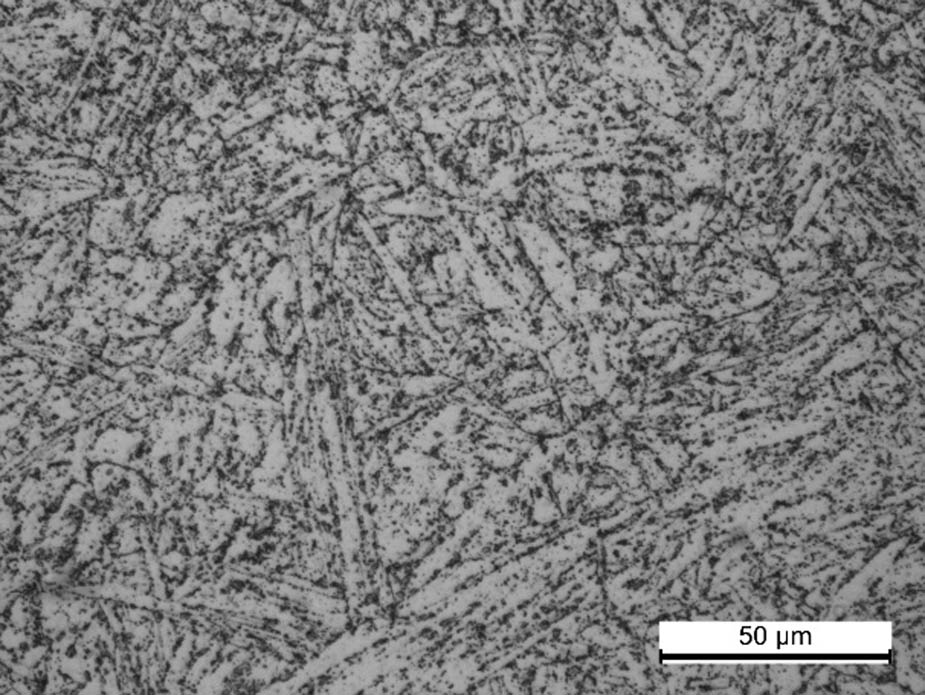
Figure 15
Microstructure of P91 sample as observed by a light microscope.
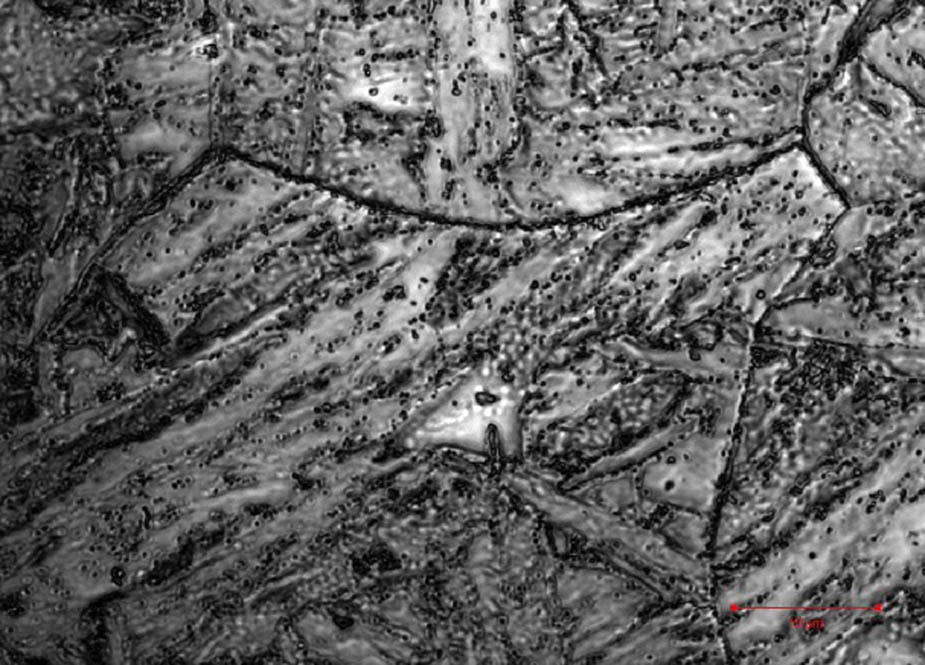
Figure 16
Microstructure of P91 sample under a laser confocal microscope.
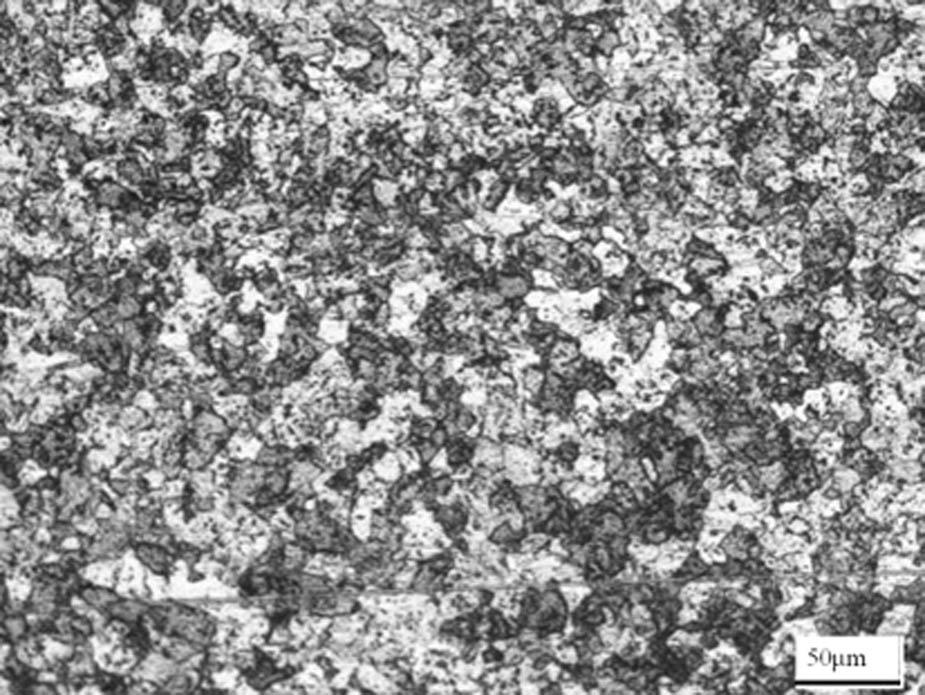
Figure 17
P92 abnormal metallographic structure of the pipeline.
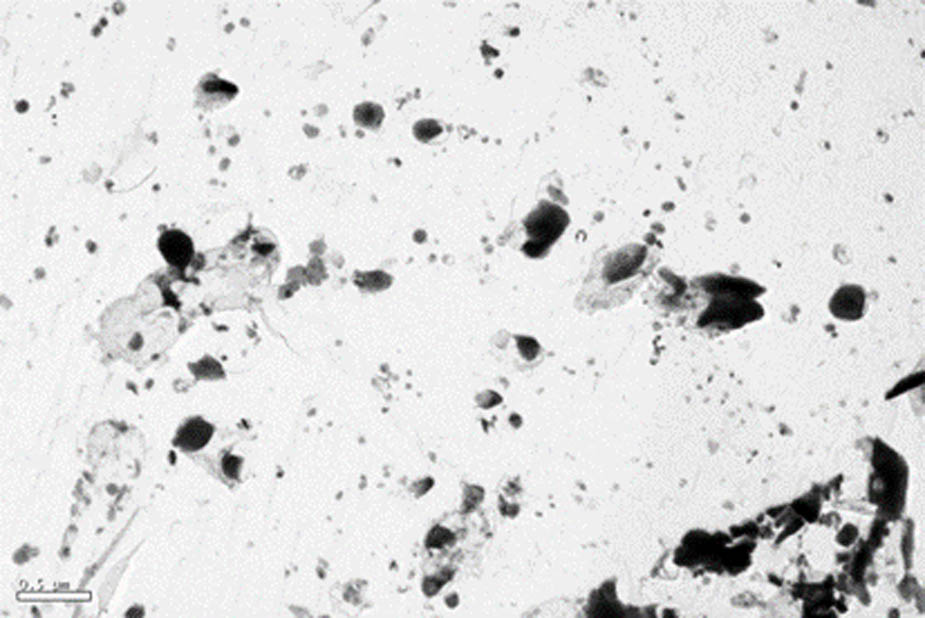
Figure 18
Abnormal growth of the precipitated phase in martensitic steel.
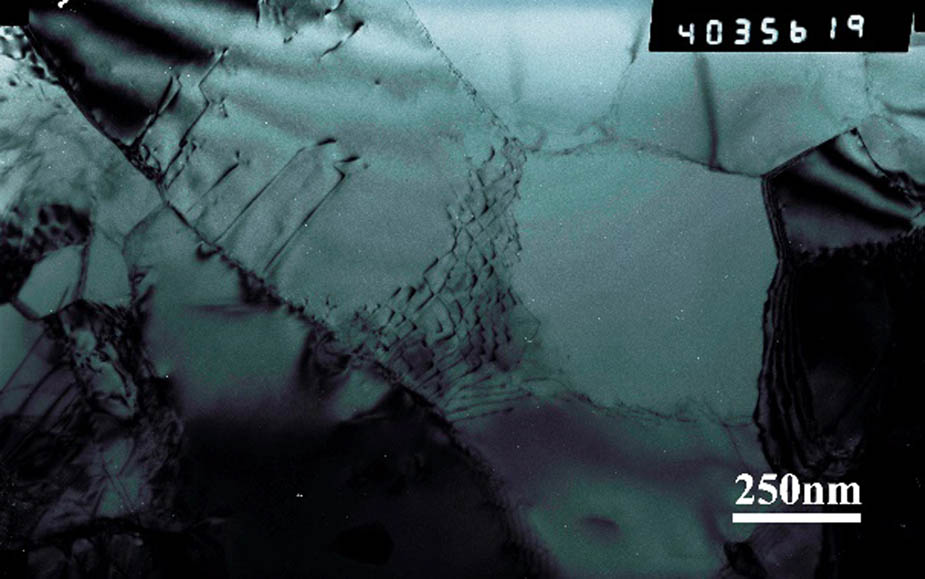
Figure 19
Ferrite appearing in martensitic steel.
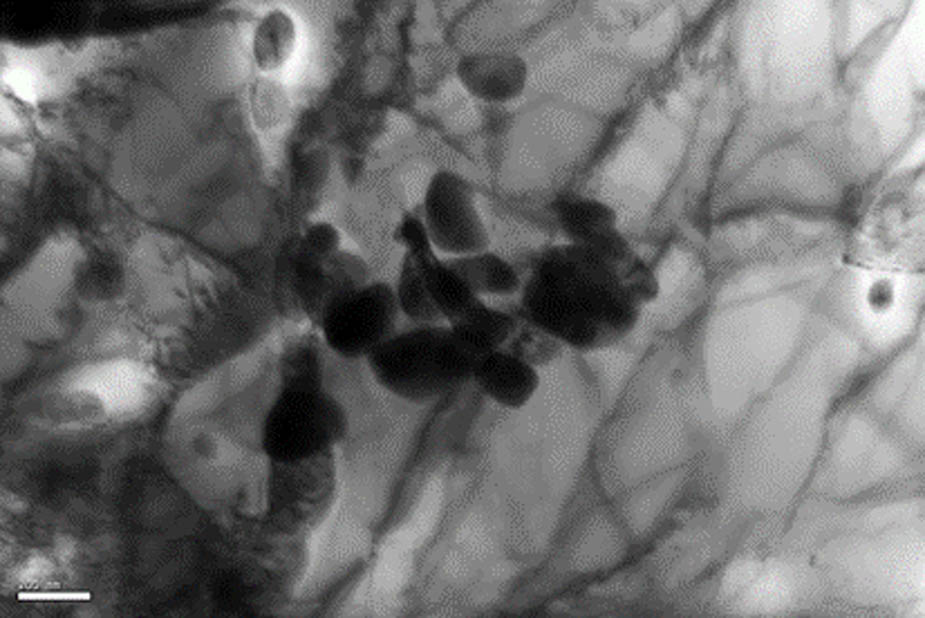
Figure 20
Disappearance of lath in martensitic steel.
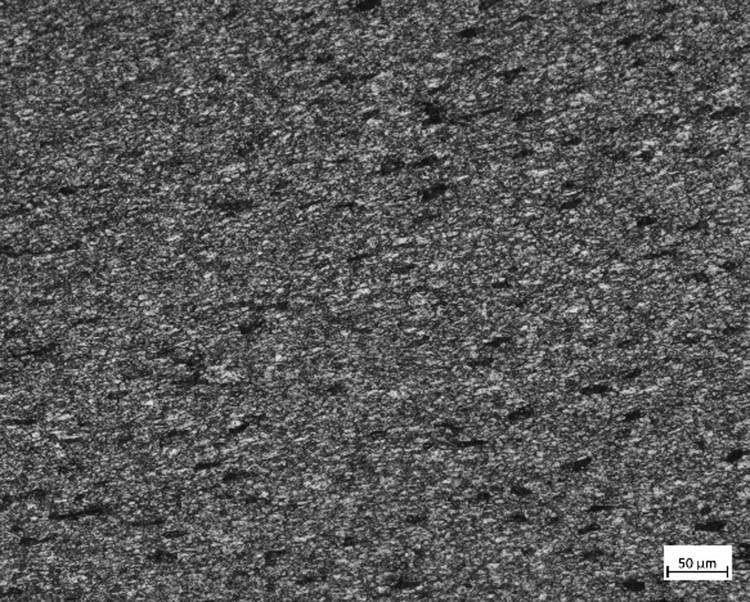
Figure 21
Burst P92 tissue creep hole.
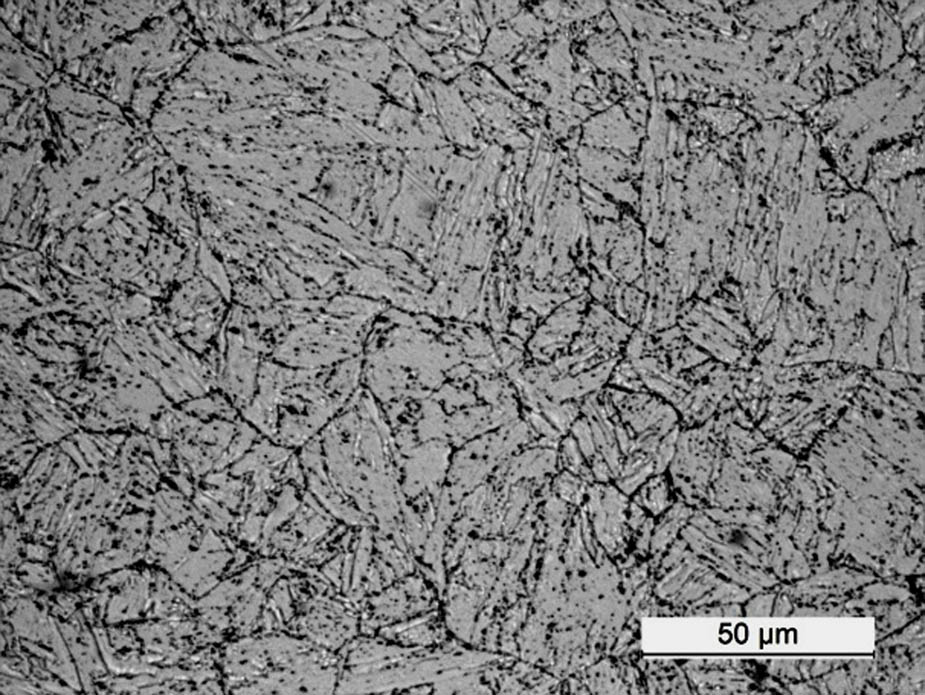
Figure 22
P91 metallographic structure after 60,000 h of operation.
Table 2
Mechanical property test results at room temperature.
| Item | R p0.2 (MPa) | R m (MPa) | A (%) | Z (%) | |
|---|---|---|---|---|---|
| Reference value (ASME SA335) | ≥415 | ≥585 | ≥20 | — | |
| Actual measured value | L3-1 | 427 | 602 | 24.0 | 65 |
| L3-2 | 430 | 595 | 25.5 | 66 |
Table 3
Mechanical property test results at high temperature (600°C).
| Item | R p0.2 (MPa) | R m (MPa) | A (%) | Z (%) | |
|---|---|---|---|---|---|
| Reference value (GB5310) | ≥198 | — | — | — | |
| Actual measured value | G3-1 | 220 | 305 | 35.0 | 89 |
| G3-2 | 220 | 310 | 37.0 | 89 |
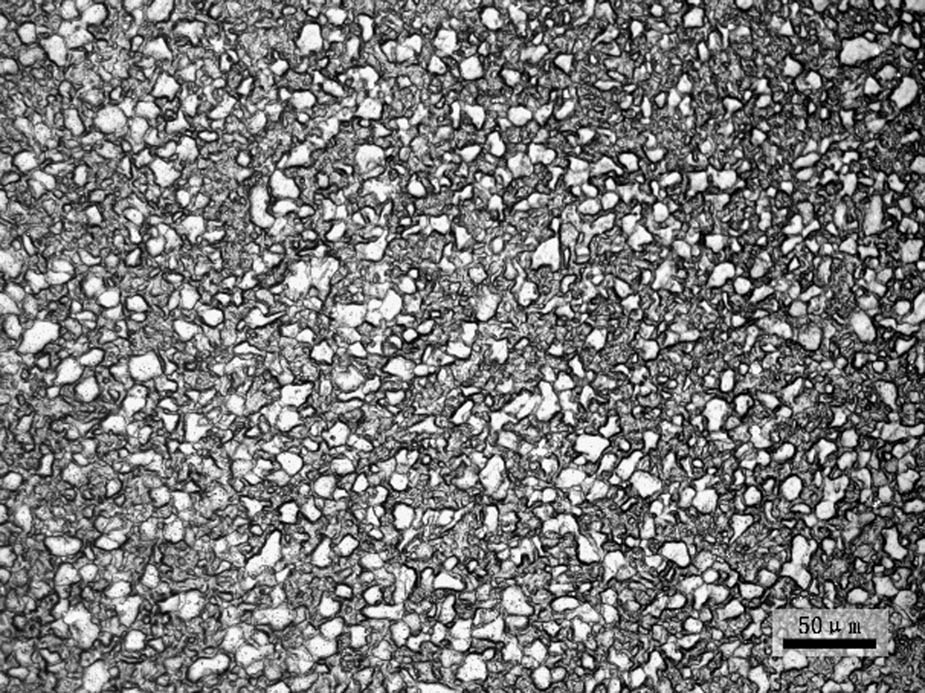
Figure 23
Metallographic structure of a P92 pipe.
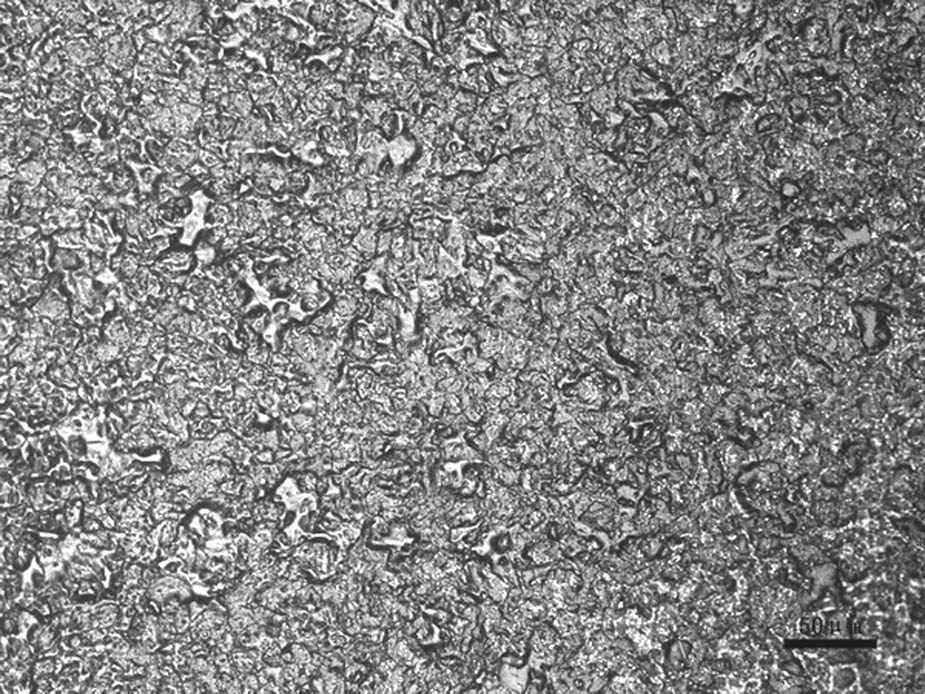
Figure 24
Metallographic structure of a P91 main steam pipe.