
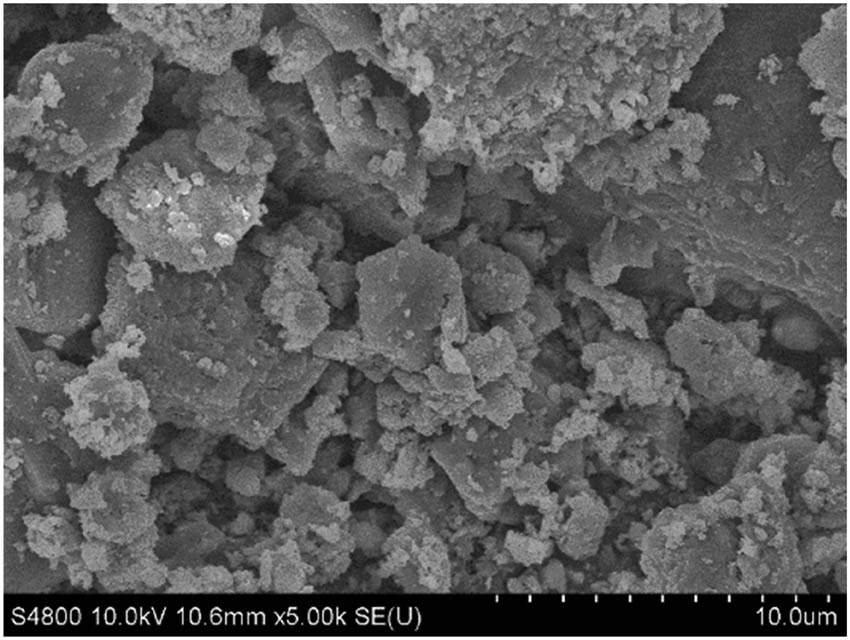
Figure 1
SEM image of RP.
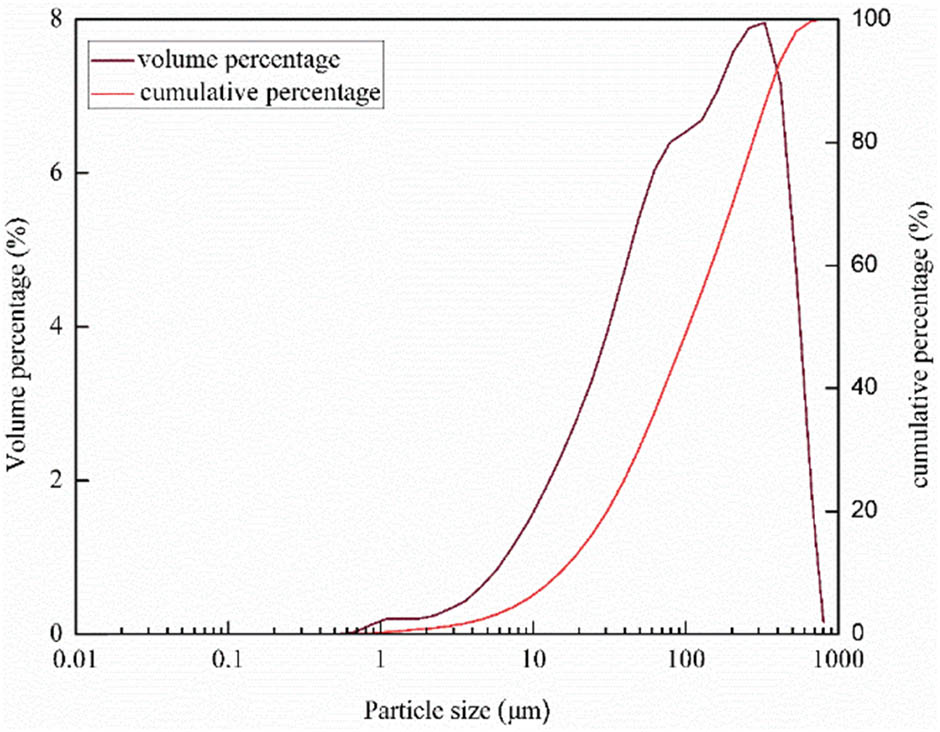
Figure 2
Particle size distribution of RP.
Table 1
Chemical composition of RP and cement (wt%).
| Composition | CaO | Al2O3 | SiO2 | MgO | Fe2O3 | Na2O | TiO2 | SO3 | Loss |
|---|---|---|---|---|---|---|---|---|---|
| RP | 40.48 | 7.6 | 42.56 | 2.4 | 4.4 | 0.38 | 0.76 | — | 1.42 |
| cement | 63.71 | 5.0 | 20.35 | 1.37 | 3.3 | 0.39 | — | 2.48 | 2.6 |
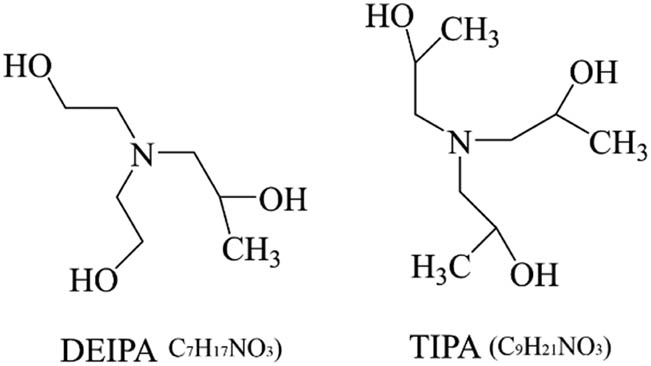
Scheme 1
Chemical structure and composition of DEIPA and TIPA.
Table 2
Mix design and group number of RP grouts.
| Sample | w/c | C/S | Cement (%) | RP (%) | P540 (%) | P80 (%) | YH-S (%) | Activator |
|---|---|---|---|---|---|---|---|---|
| S1 | 0.22 | 1 | 60 | 40 | 0.7 | 0.1 | 0.05 | — |
| S2 | 0.22 | 1 | 60 | 40 | 0.7 | 0.1 | 0.05 | 1% NaOH |
| S3 | 0.22 | 1 | 60 | 40 | 0.7 | 0.1 | 0.05 | 1% Na2CO3 |
| S4 | 0.22 | 1 | 60 | 40 | 0.7 | 0.1 | 0.05 | 1% CH |
| S5 | 0.22 | 1 | 60 | 40 | 0.7 | 0.1 | 0.05 | 0.04% DEIPA |
| S6 | 0.22 | 1 | 60 | 40 | 0.7 | 0.1 | 0.05 | 0.25% TIPA |
| S7 | 0.22 | 1 | 60 | 40 | 0.7 | 0.1 | 0.05 | 700°C |
| S8 | 0.22 | 1 | 60 | 40 | 0.7 | 0.1 | 0.05 | 700°C + 1% CH + 0.04% DEIPA |
| S9 | 0.22 | 1 | 60 | 40 | 0.7 | 0.1 | 0.05 | 700°C + 0.04% DEIPA + 0.25% TIPA |
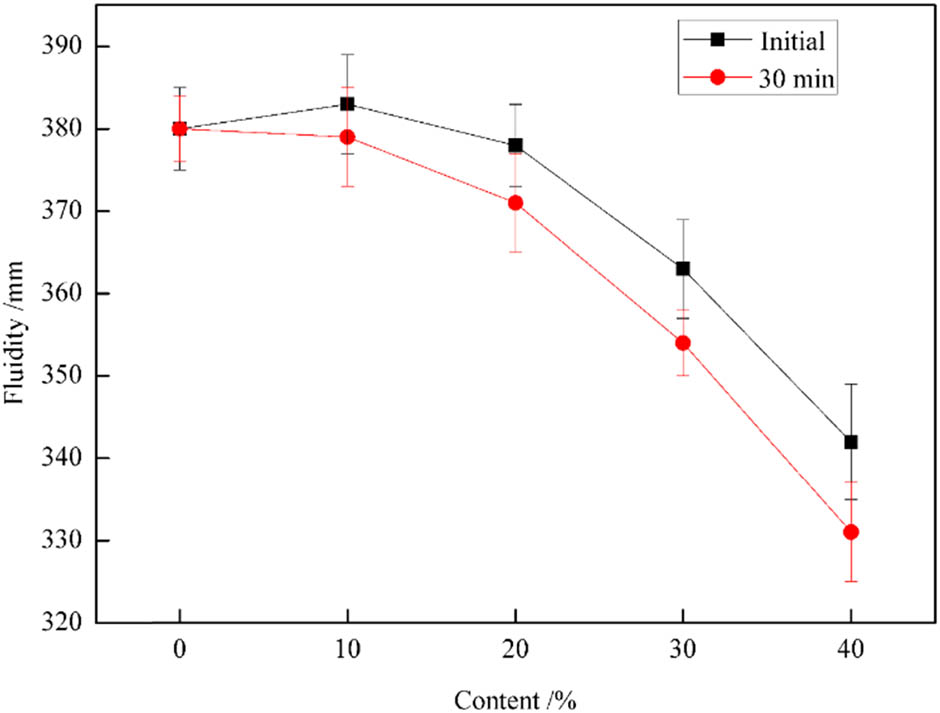
Figure 3
Influence of RP content on the fluidity of cement-based grouts.
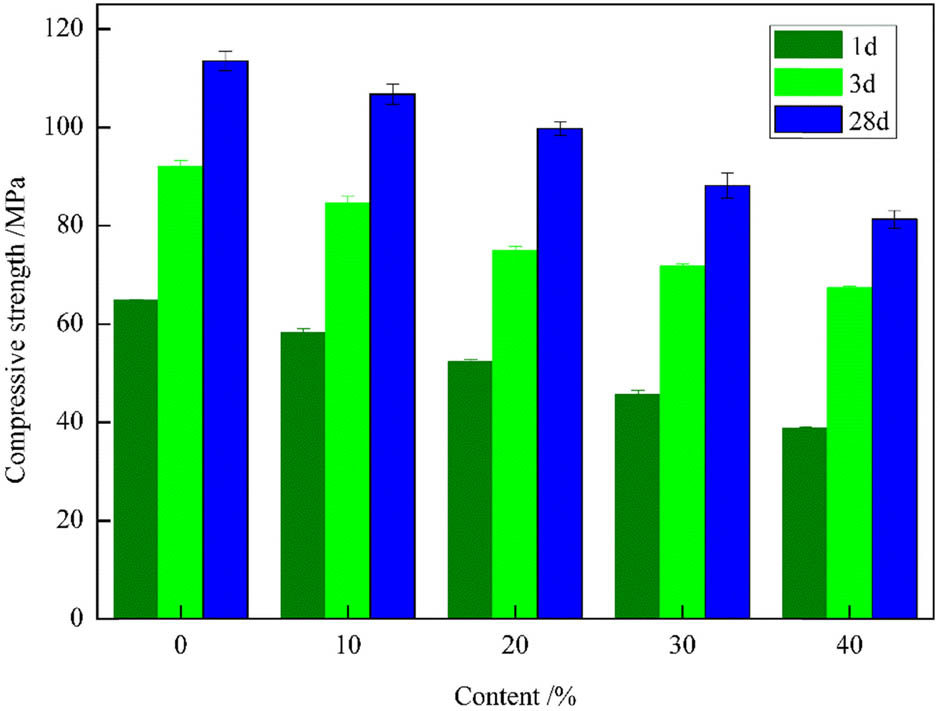
Figure 4
Compressive strength of grouts with different contents of RP.
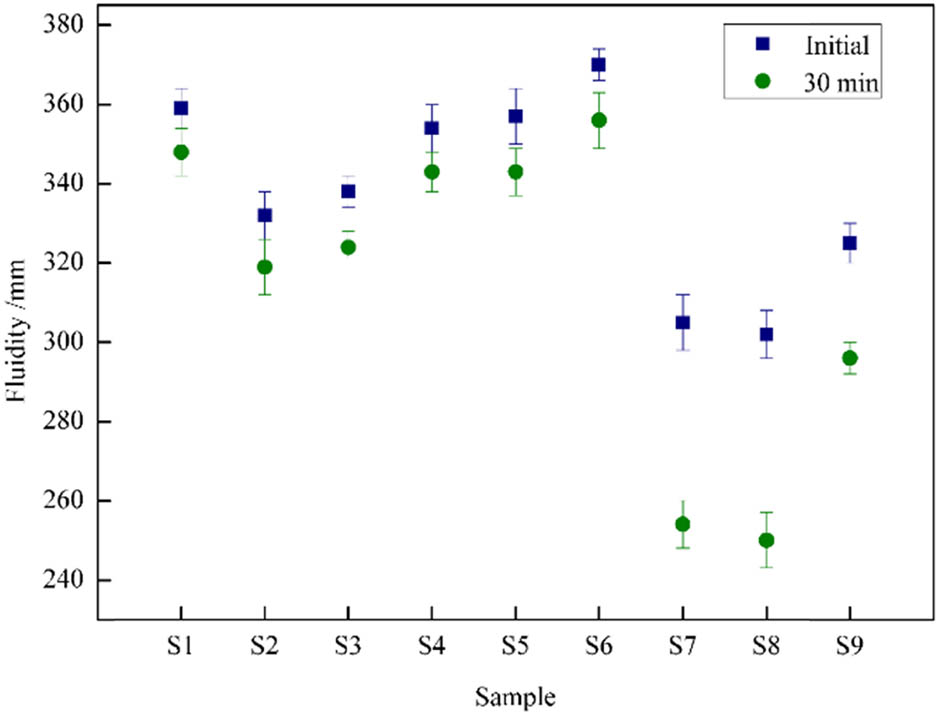
Figure 5
Influence of activation modes on the fluidity of RP grouts.
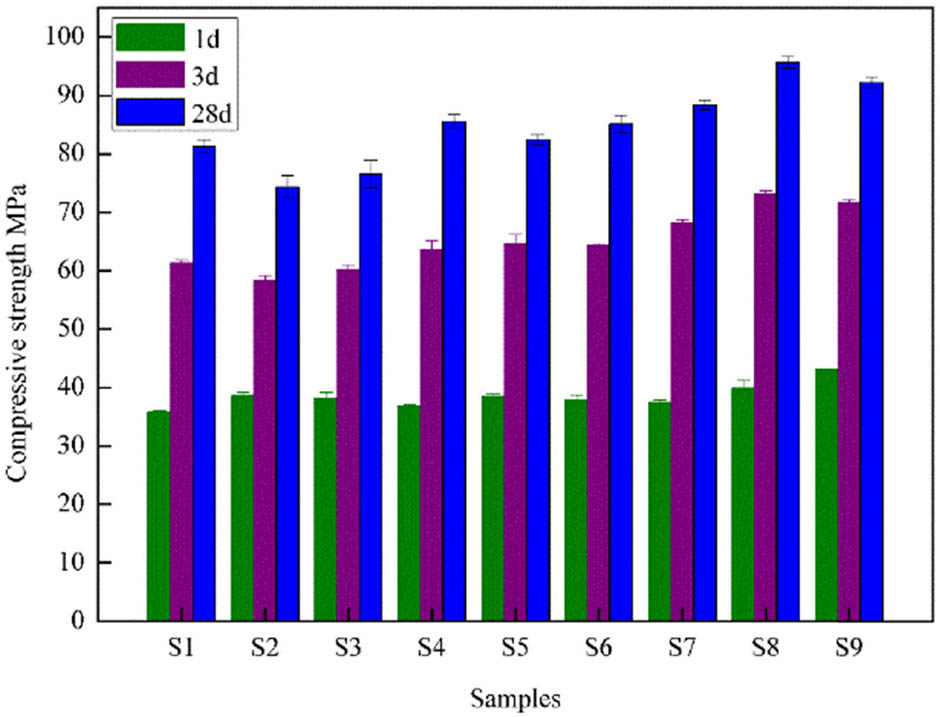
Figure 6
Influence of activation modes on the compressive strength of grouts.
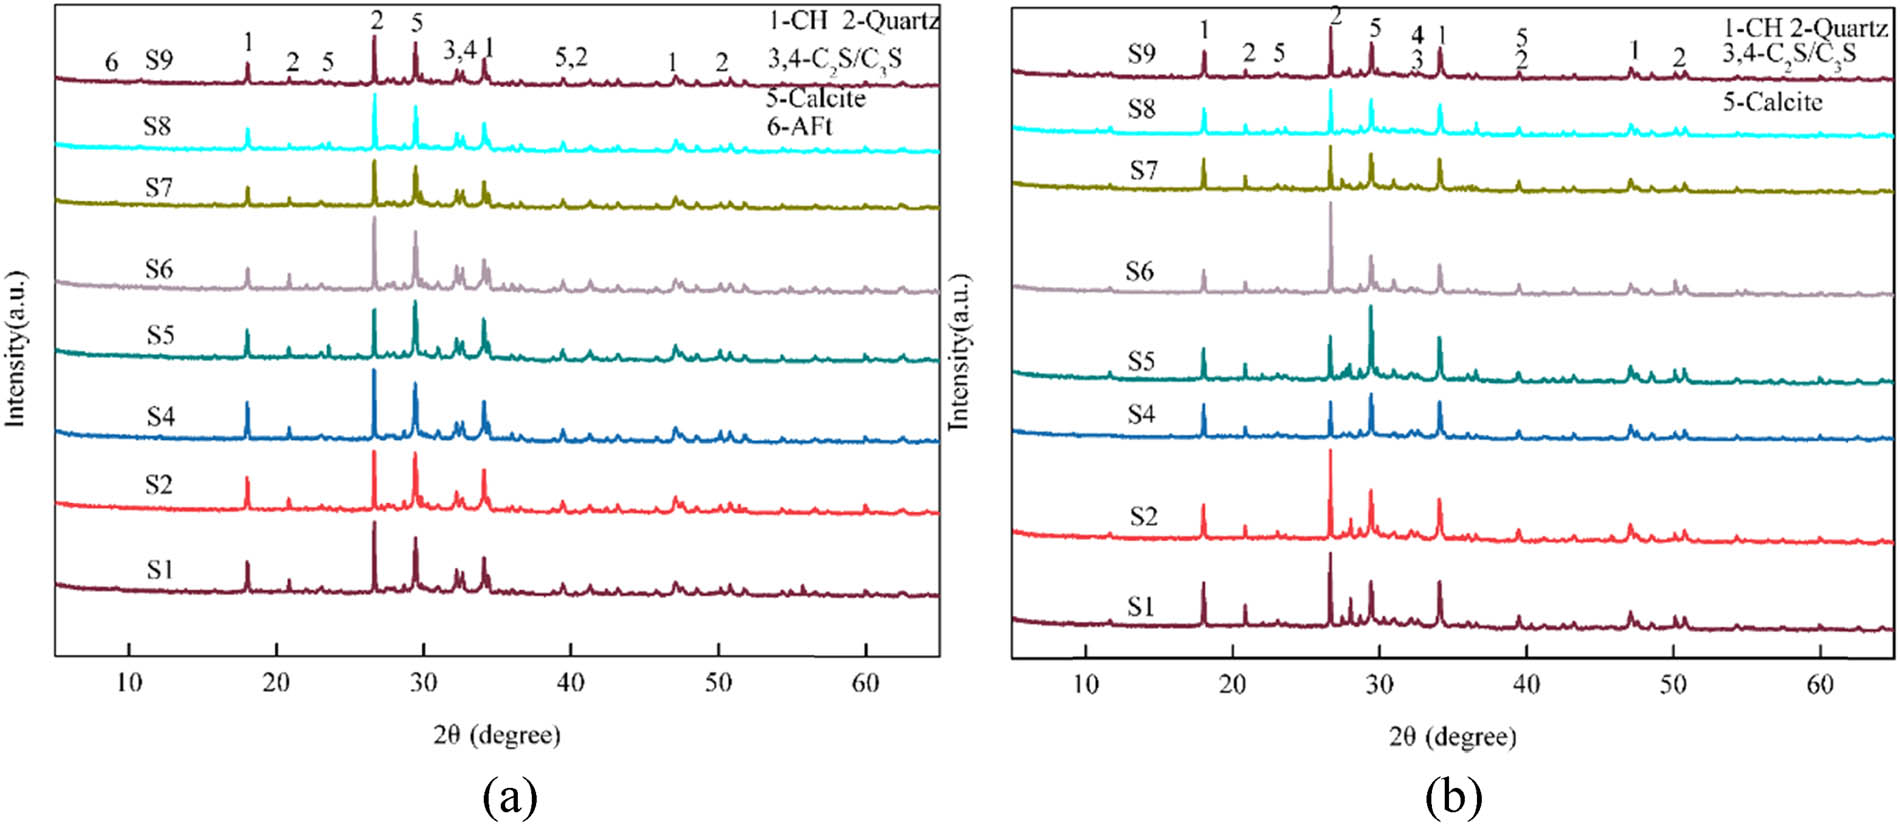
Figure 7
XRD patterns of hardened samples of RP activated by different methods at 1 (a) and 28 (b) days.
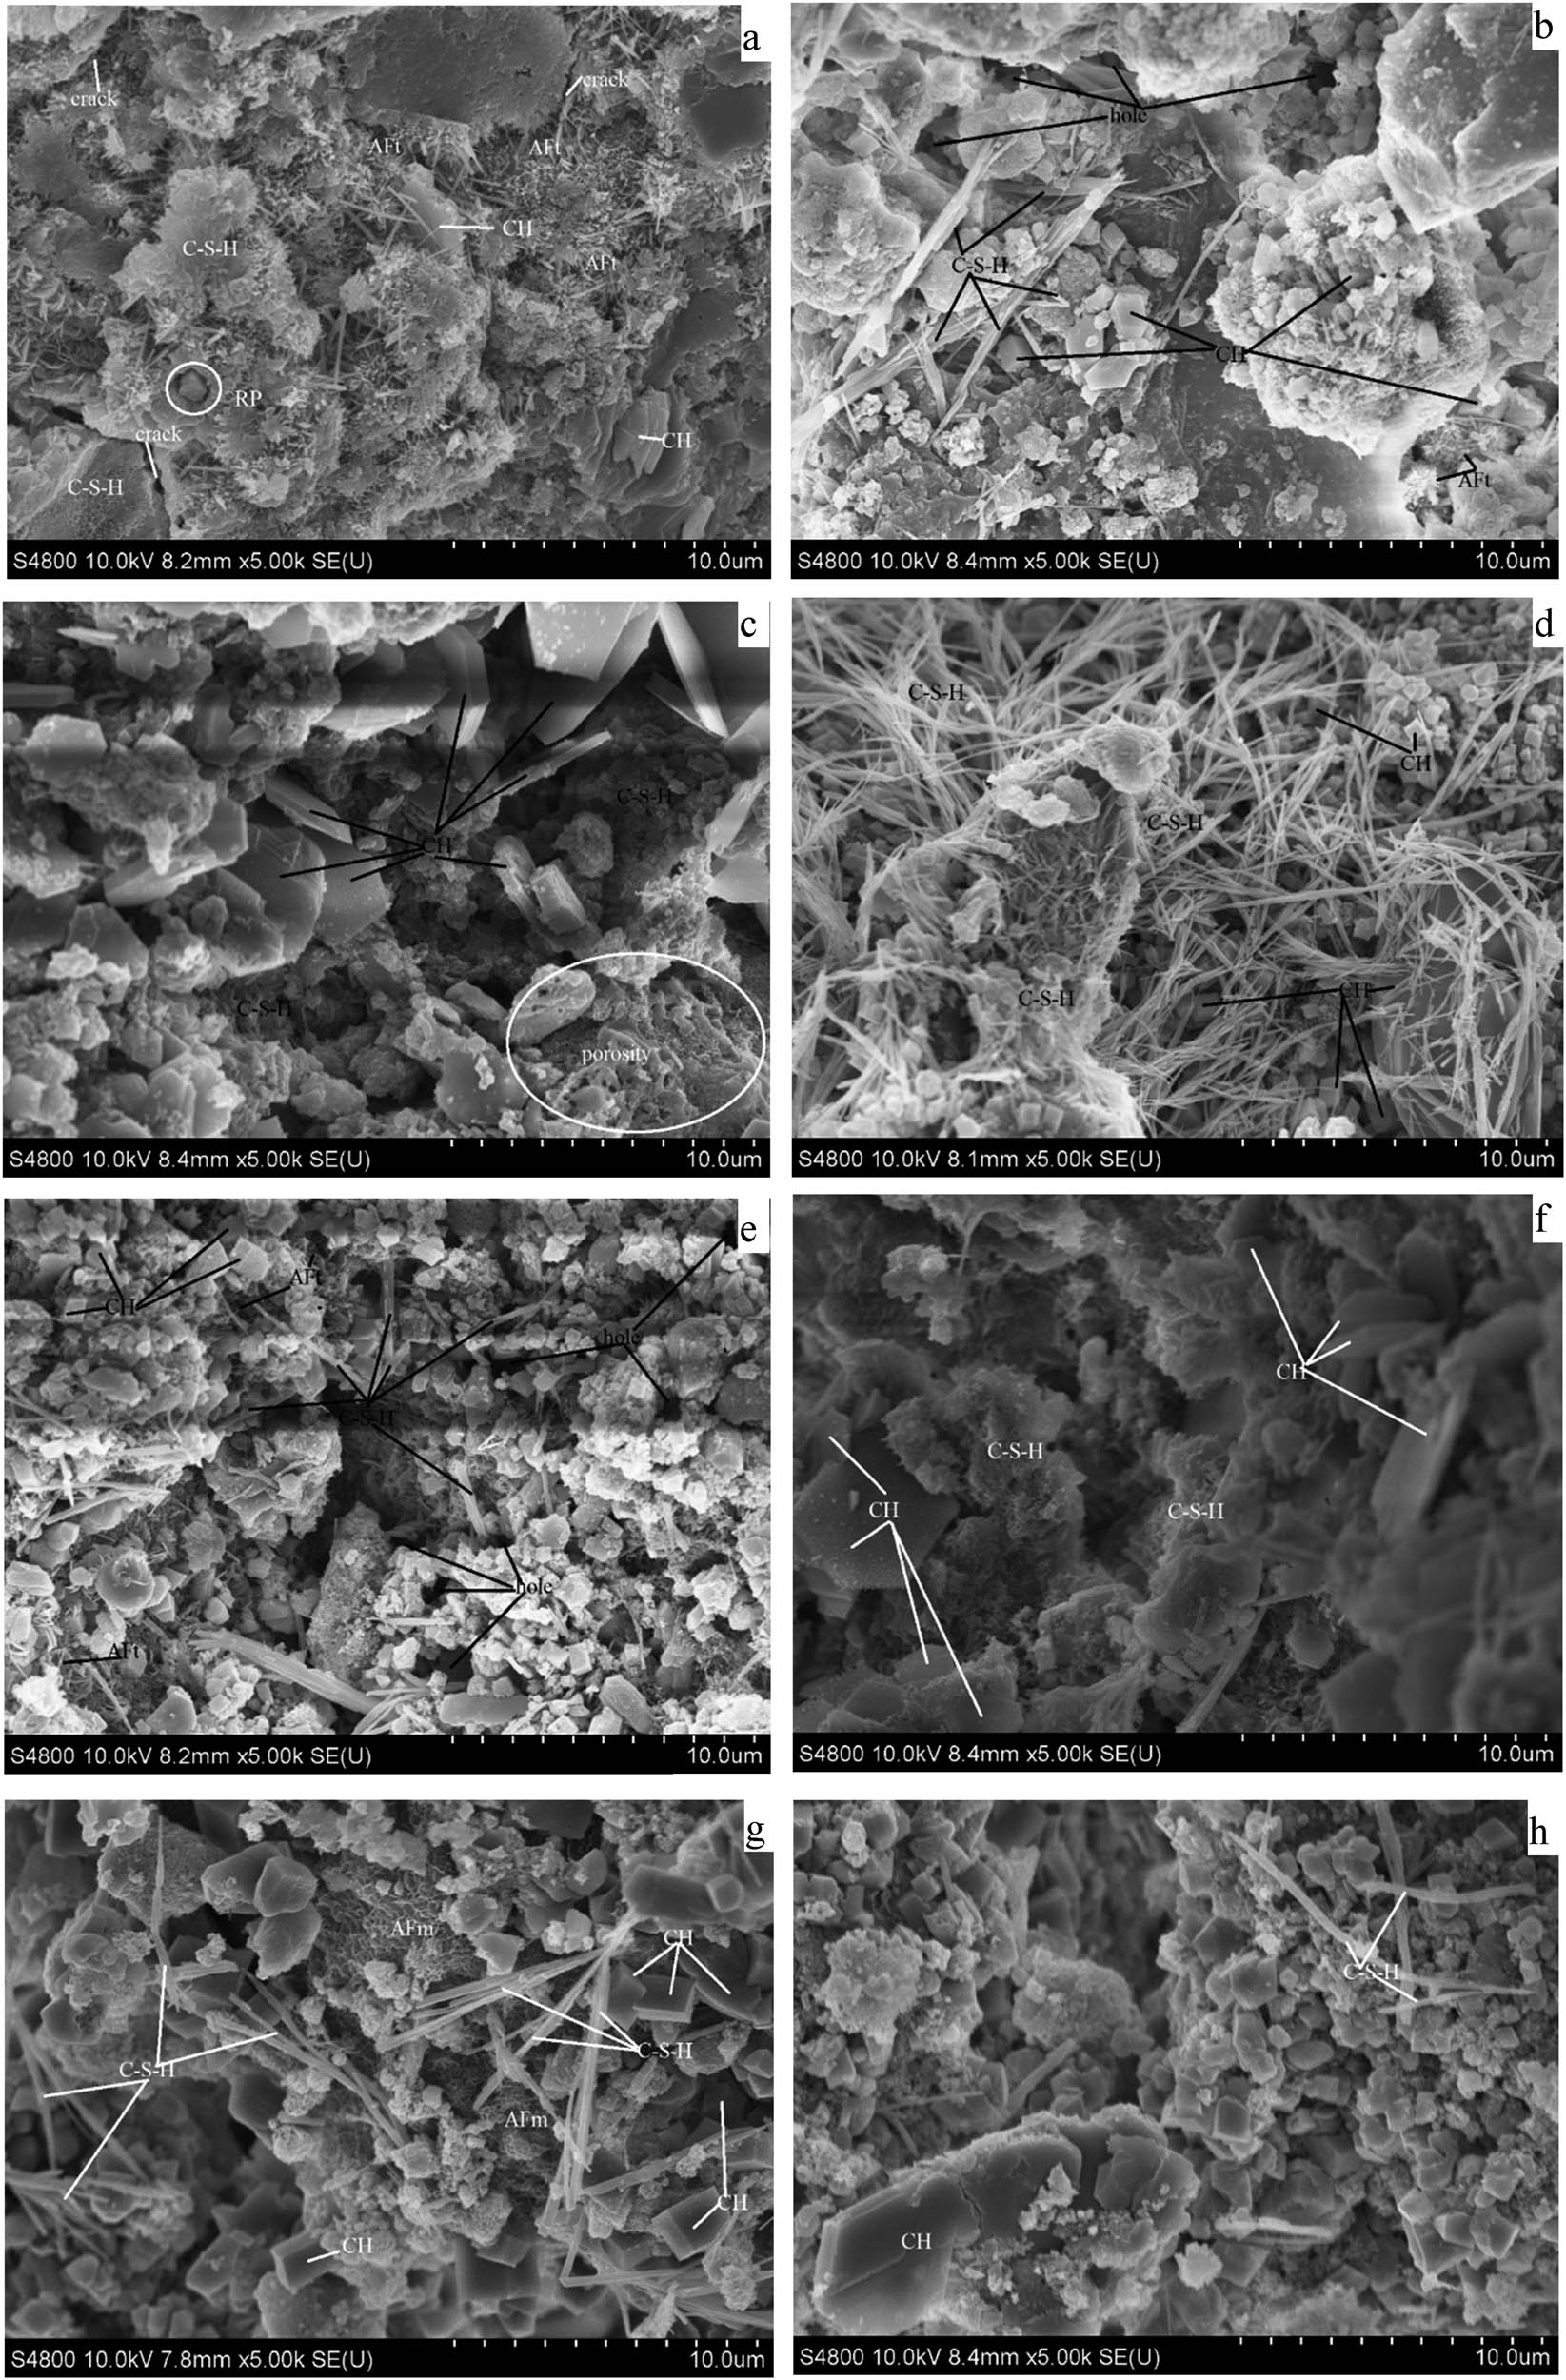
Figure 8
SEM images of samples S1 (a), S2 (b), S4 (c), S5 (d), S6 (e), S7 (f), S8 (g), and S9 (h) at 1 day.
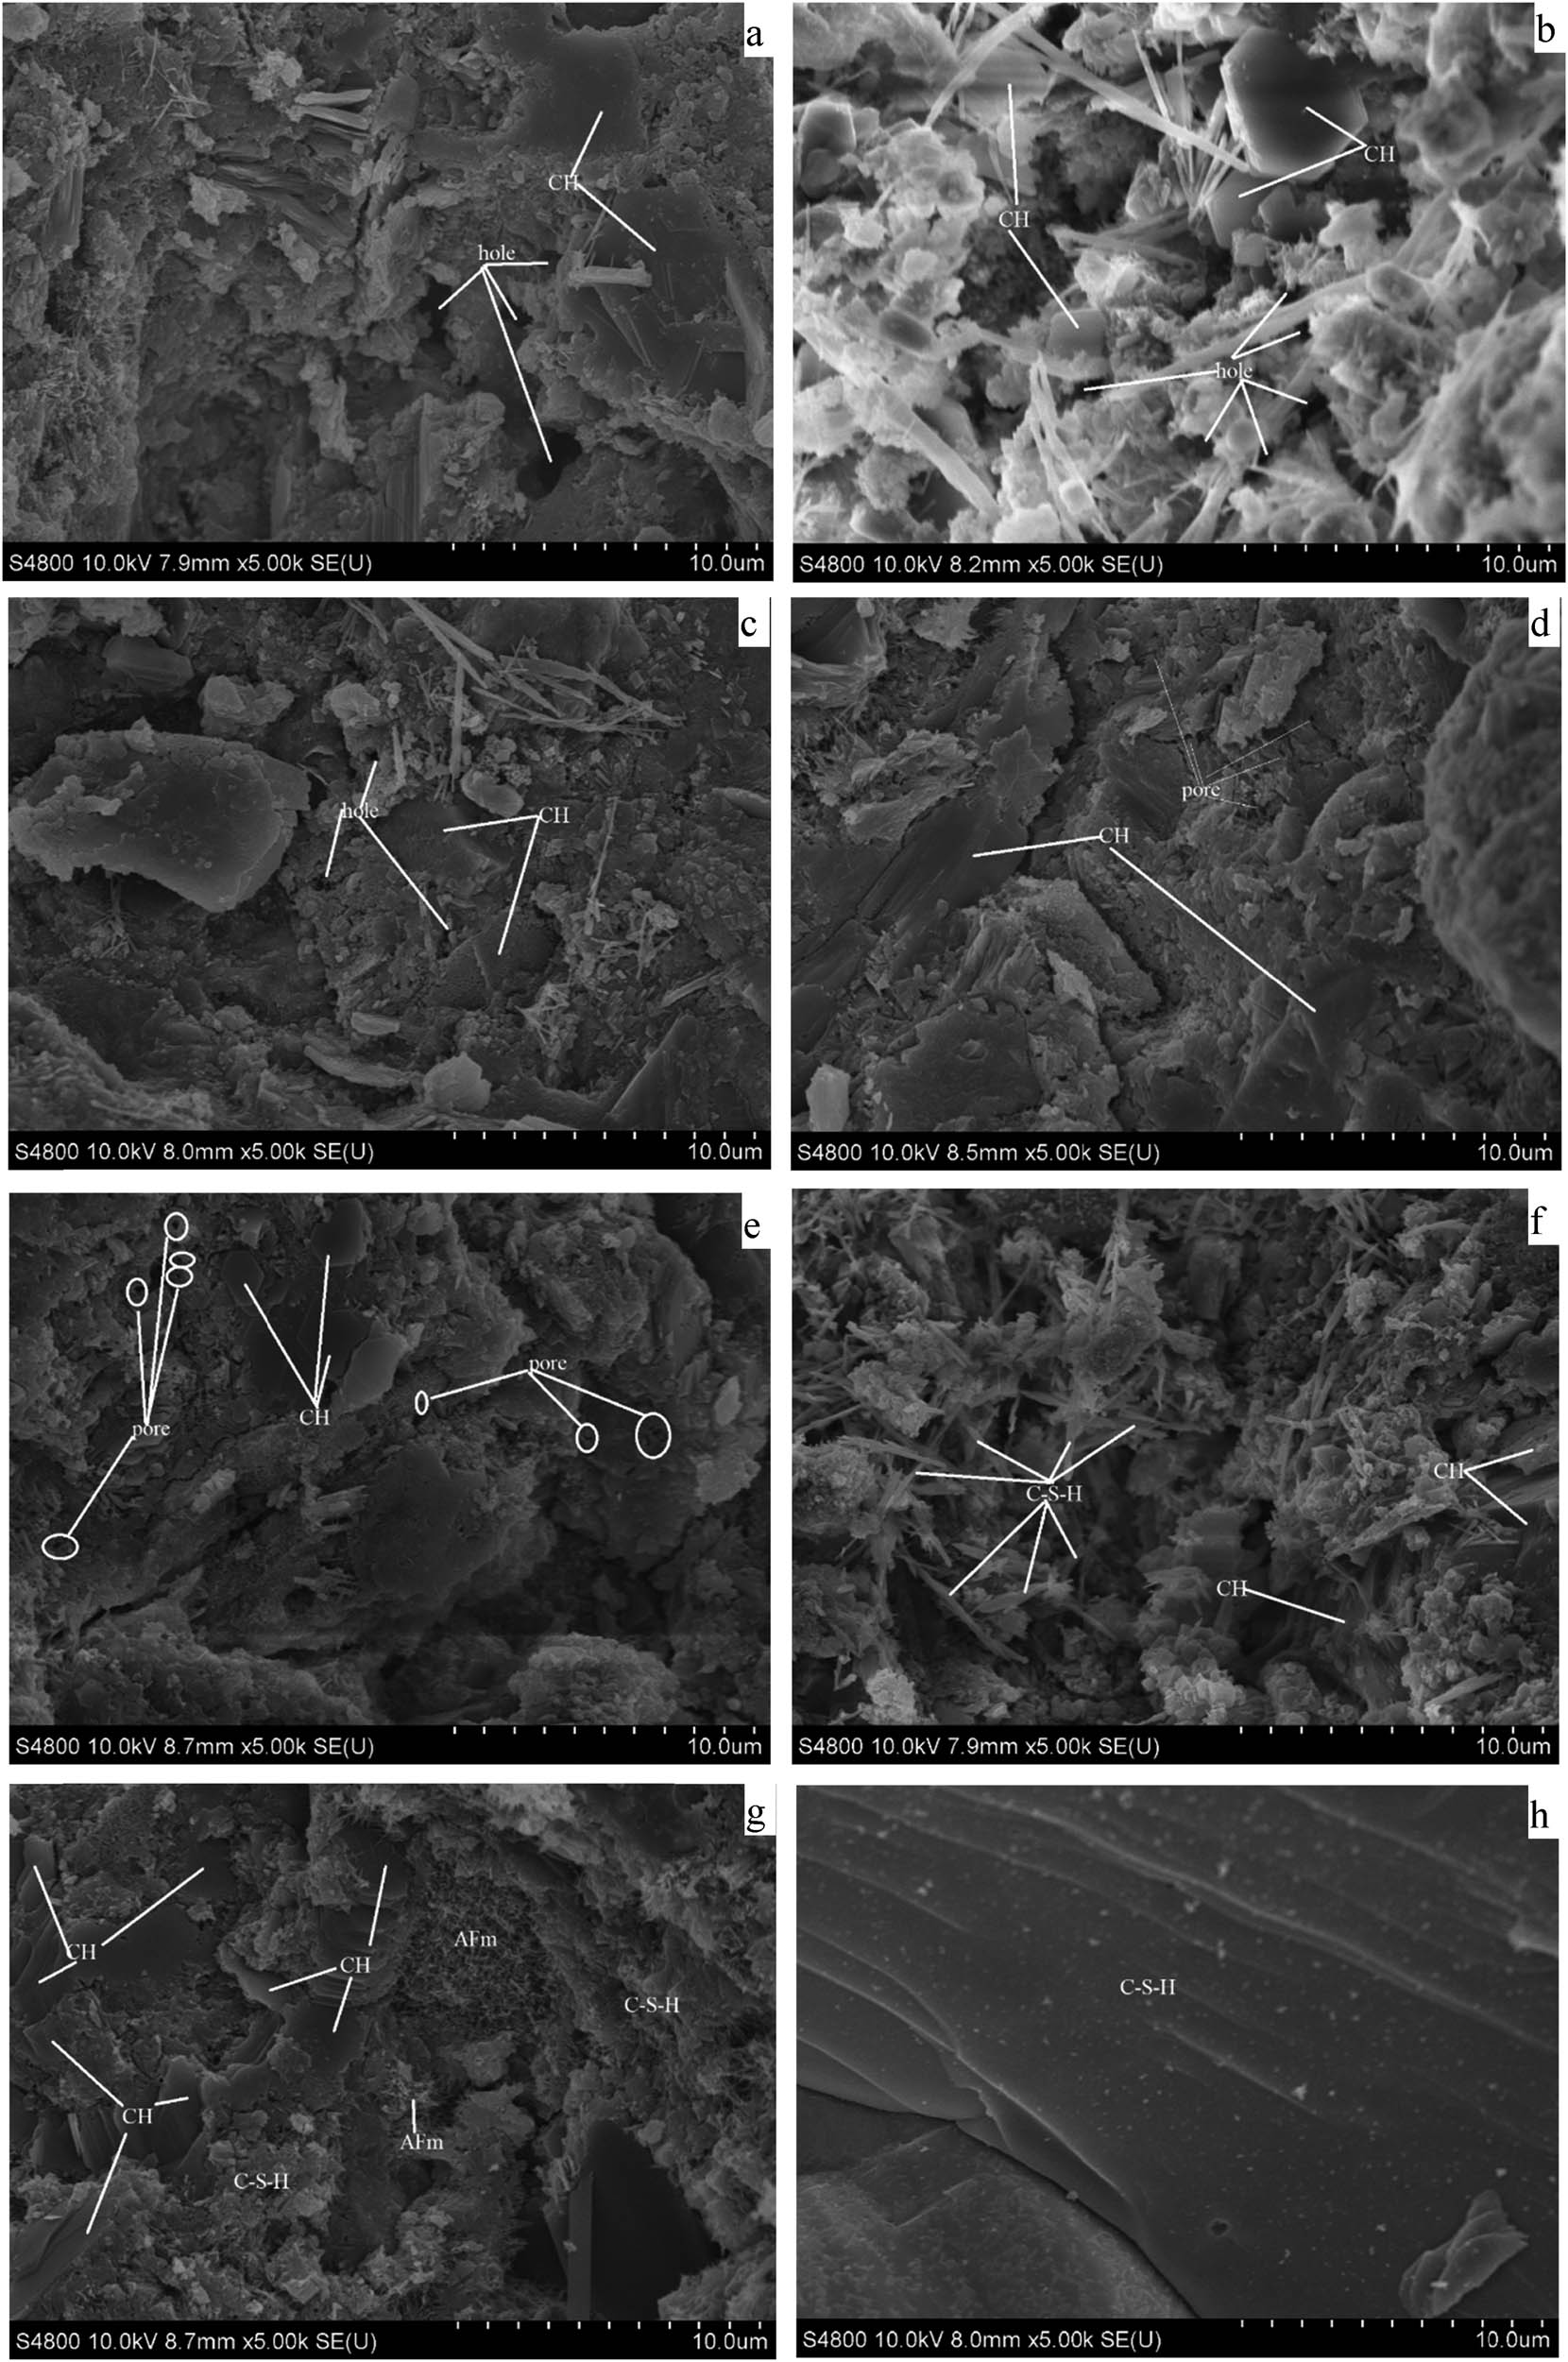
Figure 9
SEM images of samples S1 (a), S2 (b), S4 (c), S5 (d), S6 (e), S7 (f), S8 (g), and S9 (h) at 28 days.