
Table 1
Composition of ammonium sulfate wastewater.
| Name | MgO | BaO | CaO | MnO2 | ||
|---|---|---|---|---|---|---|
| Concentration (g/L) | <0.05 | <0.010 | 0.017 | 9.29 | 0.96 | 1.09 |
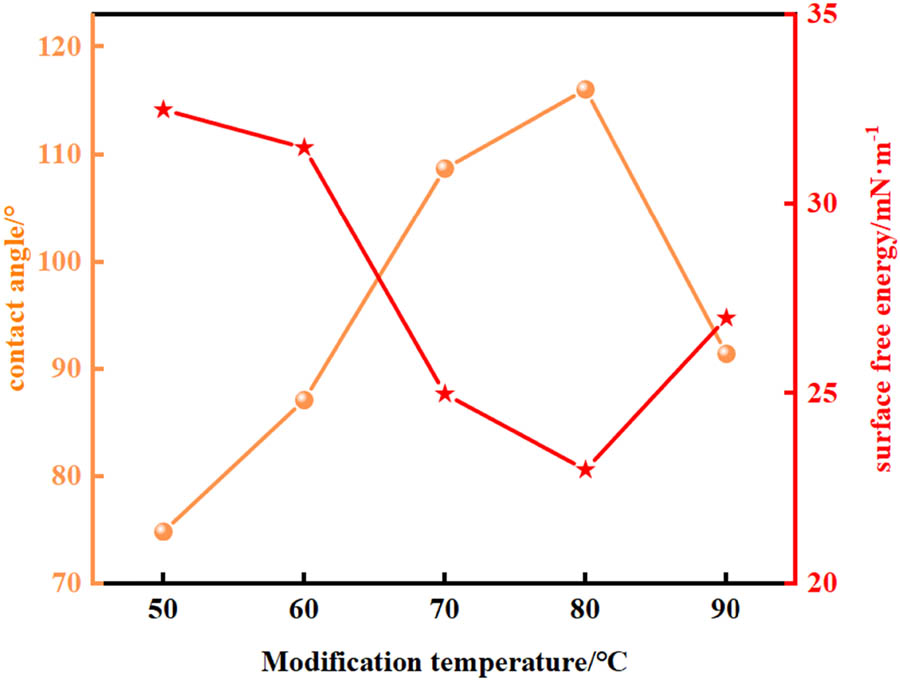
Figure 1
Effect of different modification temperatures on contact angle and surface free energy of CSW.
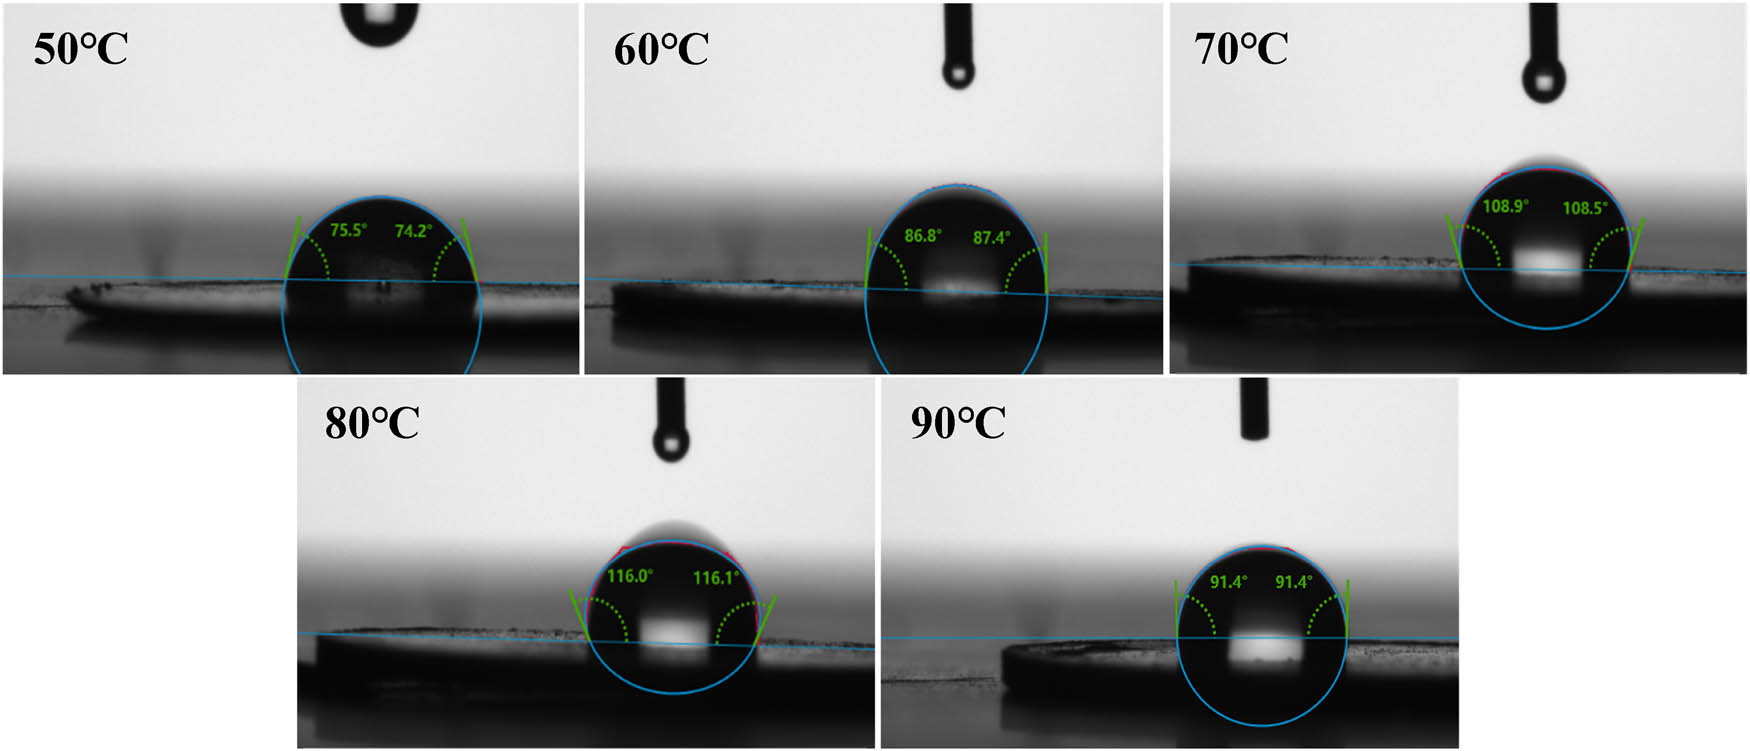
Figure 2
Contact angle of CSW at different modification temperatures.
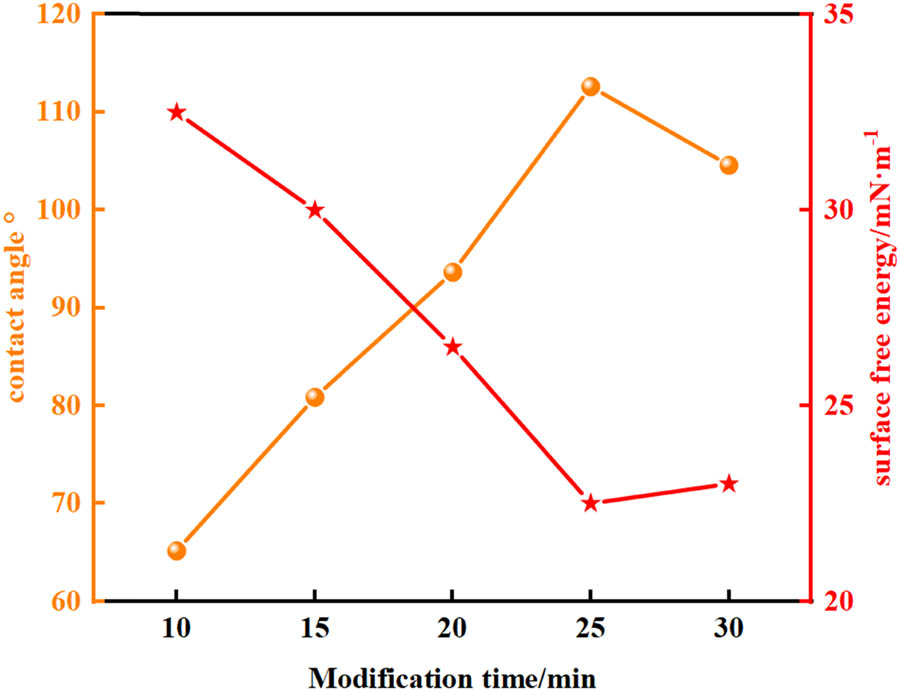
Figure 3
Effect of different modification times on contact angle and surface free energy of CSW.
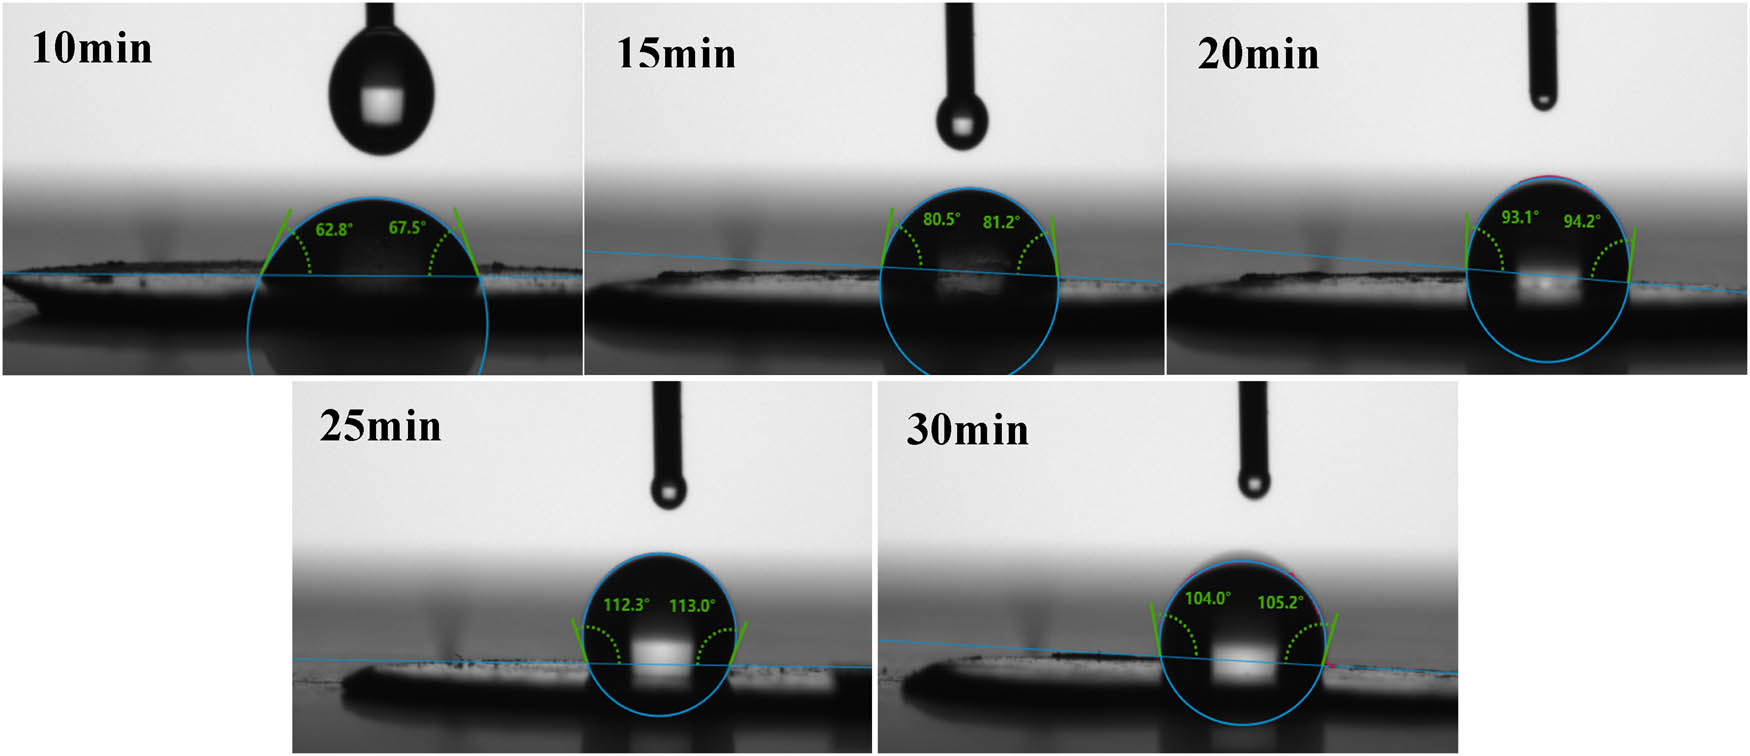
Figure 4
Contact angle of CSW at different modification times.
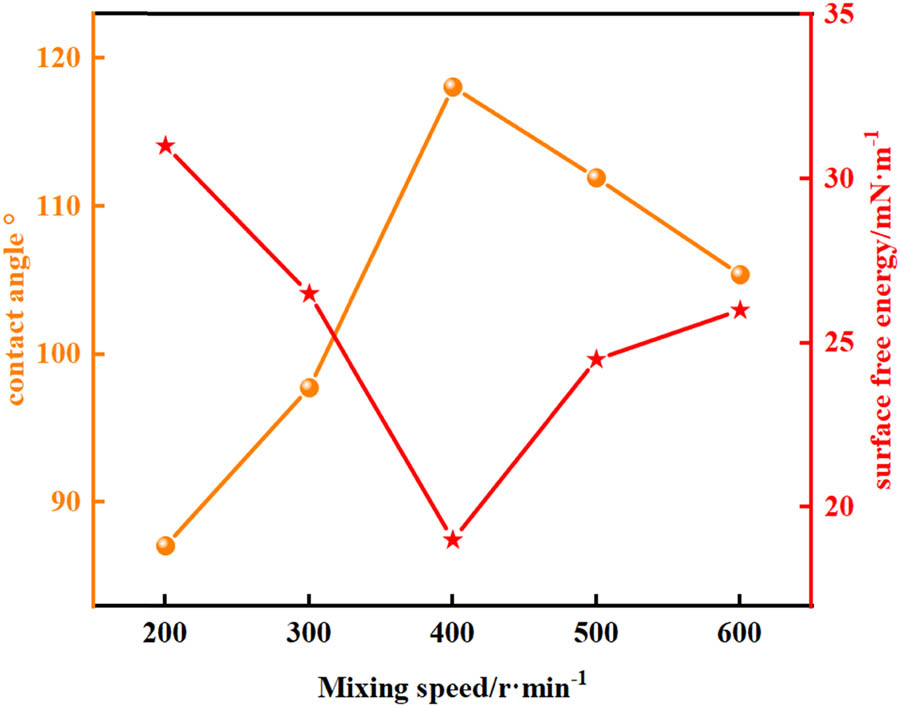
Figure 5
Effect of different stirring speeds on contact angle and surface free energy of CSW.
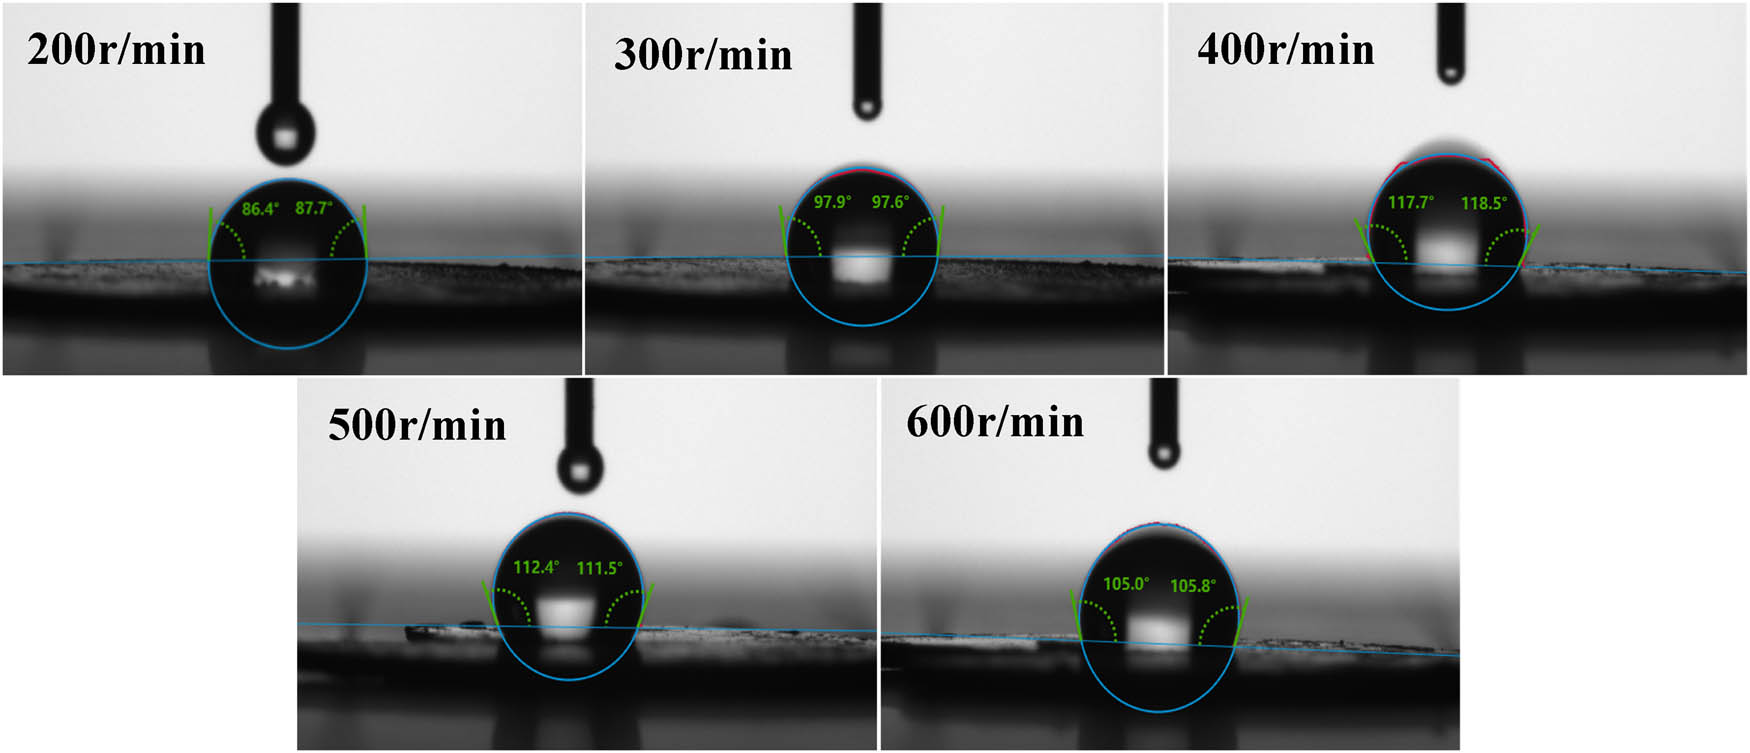
Figure 6
Contact angle of CSW at different stir-ring speeds.
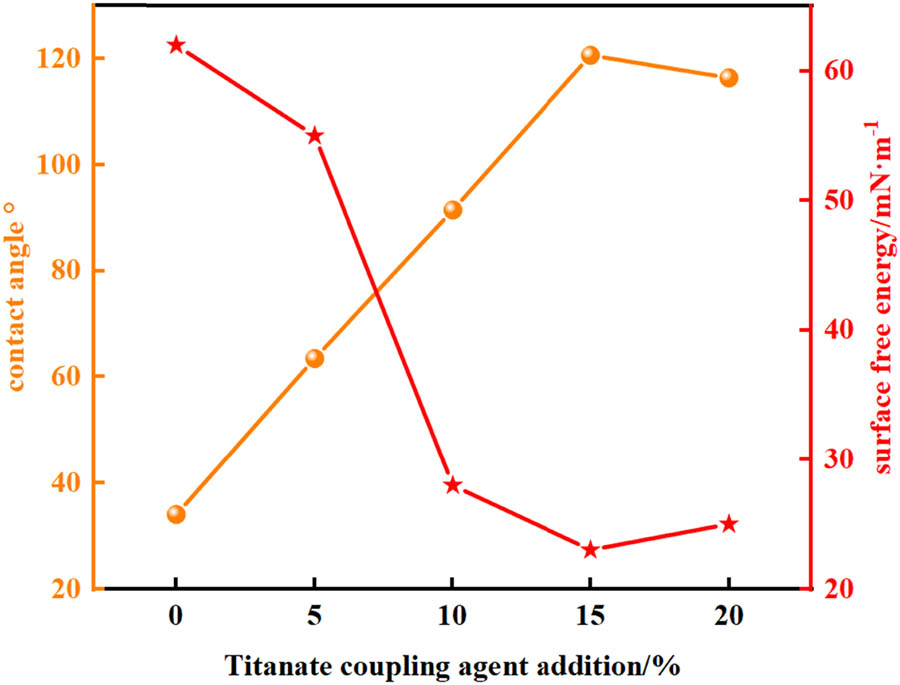
Figure 7
Effect of the titanate coupling agent addition on contact angle and surface free energy of CSW.
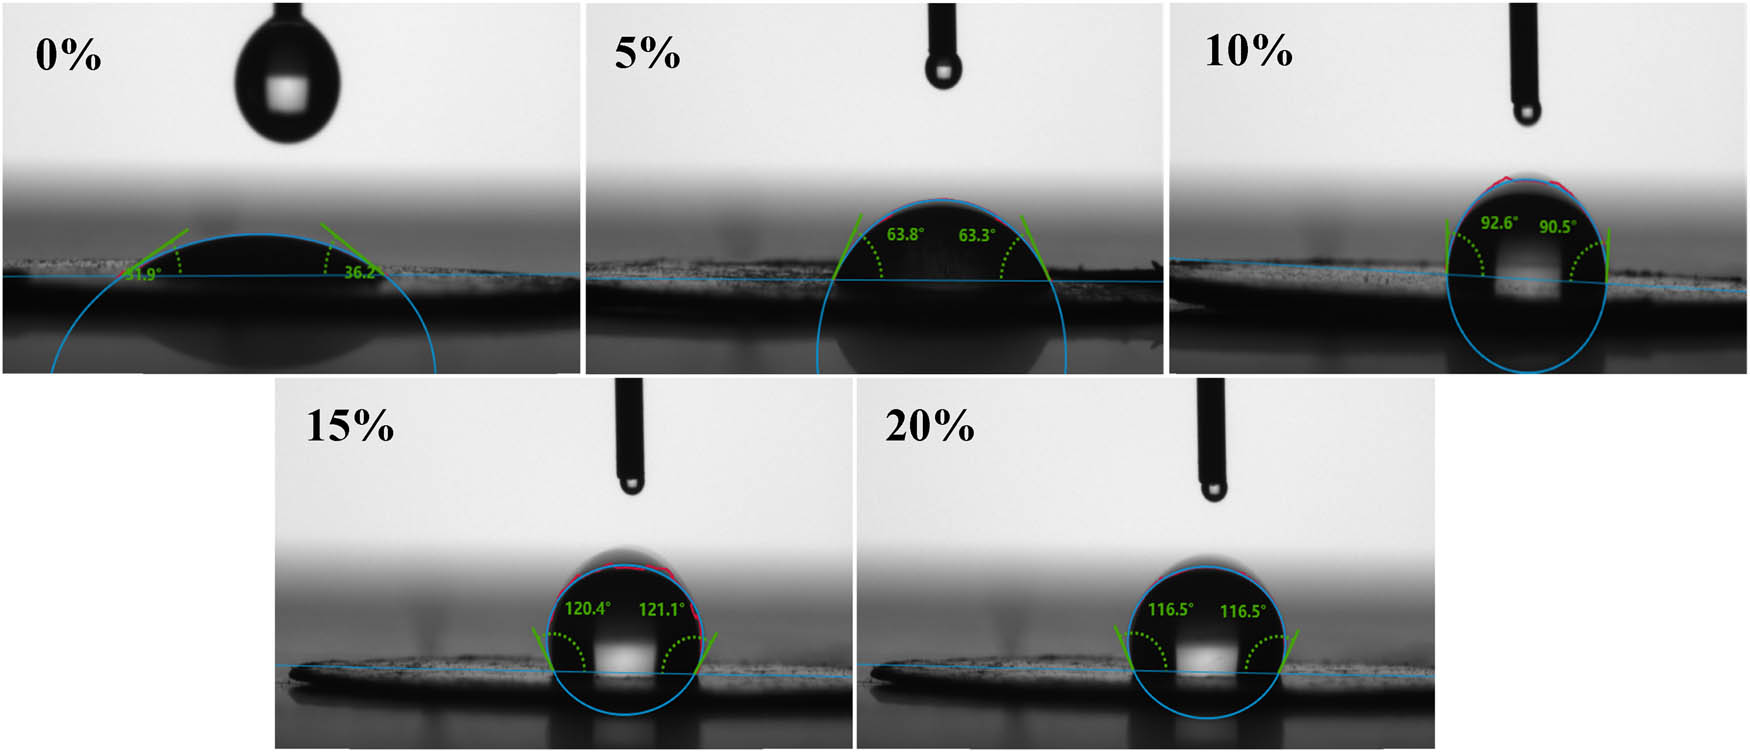
Figure 8
Contact angle of CSW with different titanate coupling agent additions.
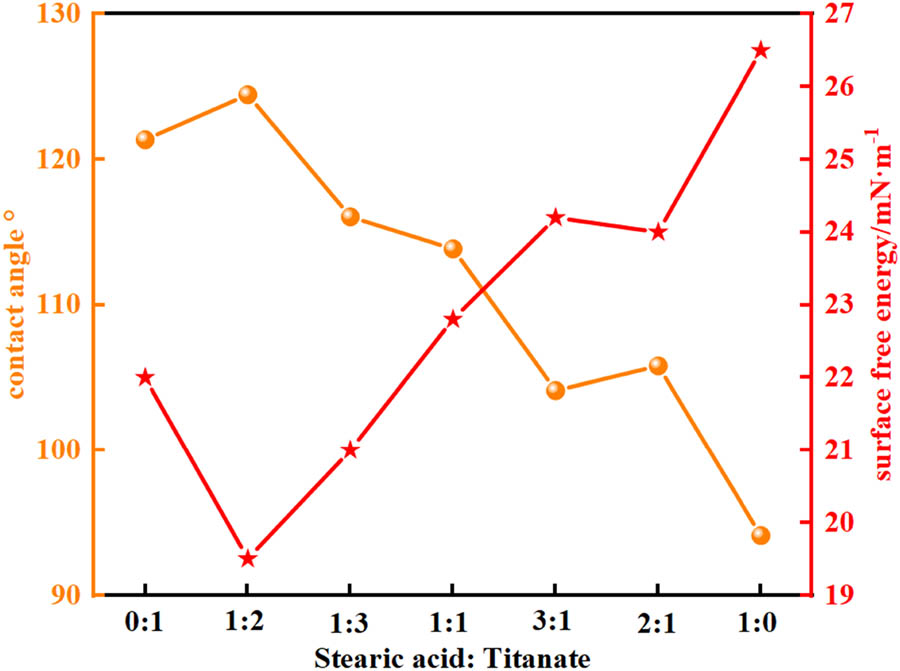
Figure 9
Effect of the stearate-to-titanate mass ratio on contact angle and surface free energy of CSW.
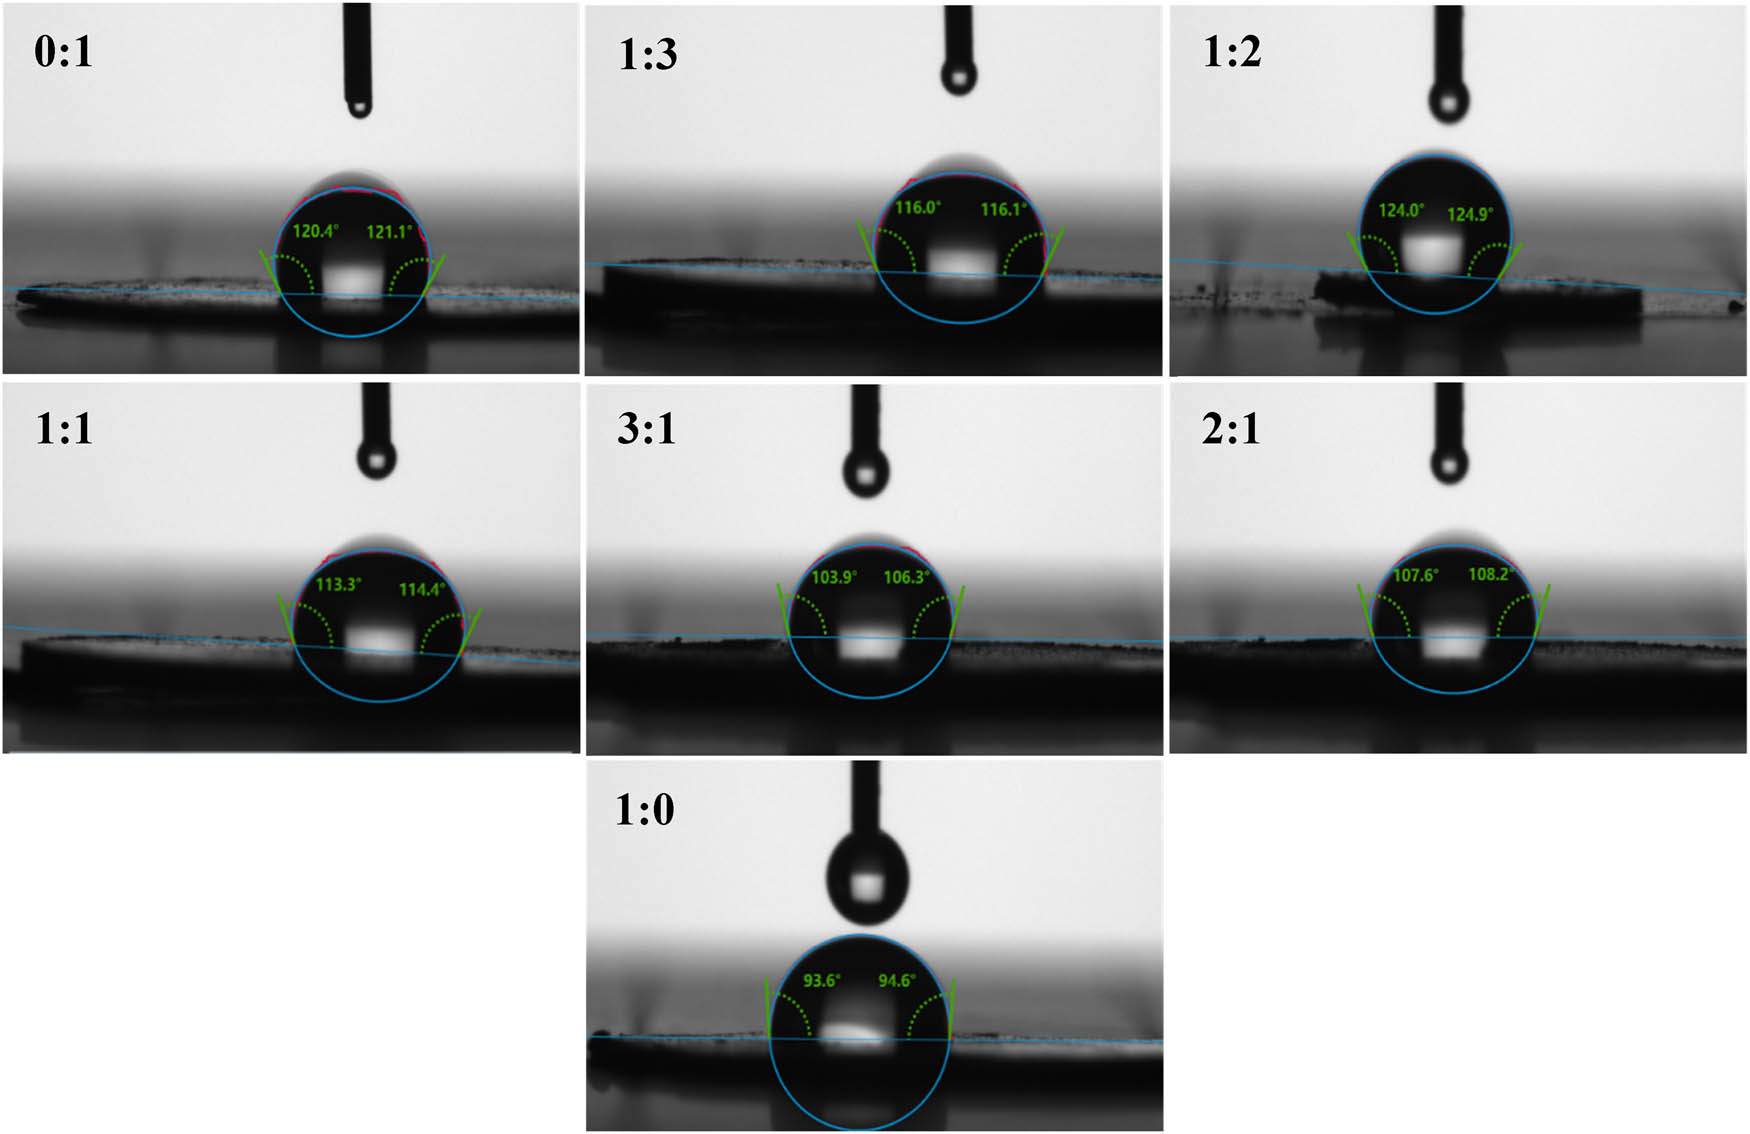
Figure 10
Contact angle of CSW with different stearate-to-titanate mass ratios.
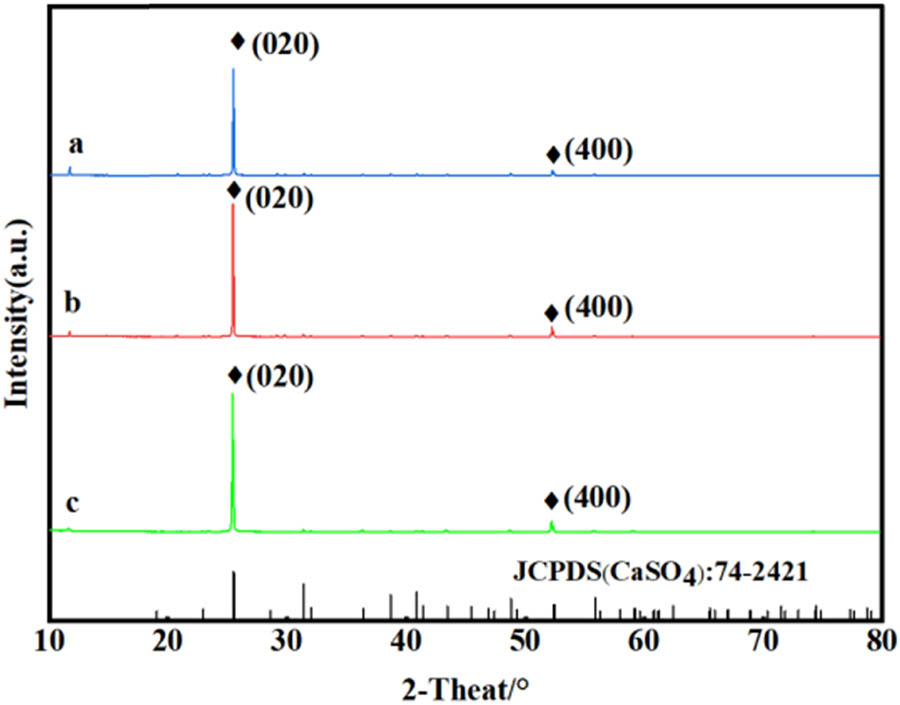
Figure 11
XRD patterns of anhydrous CSW before and after surface modification: (a) CSW, (b) MCSW, and (c) CMCSW.
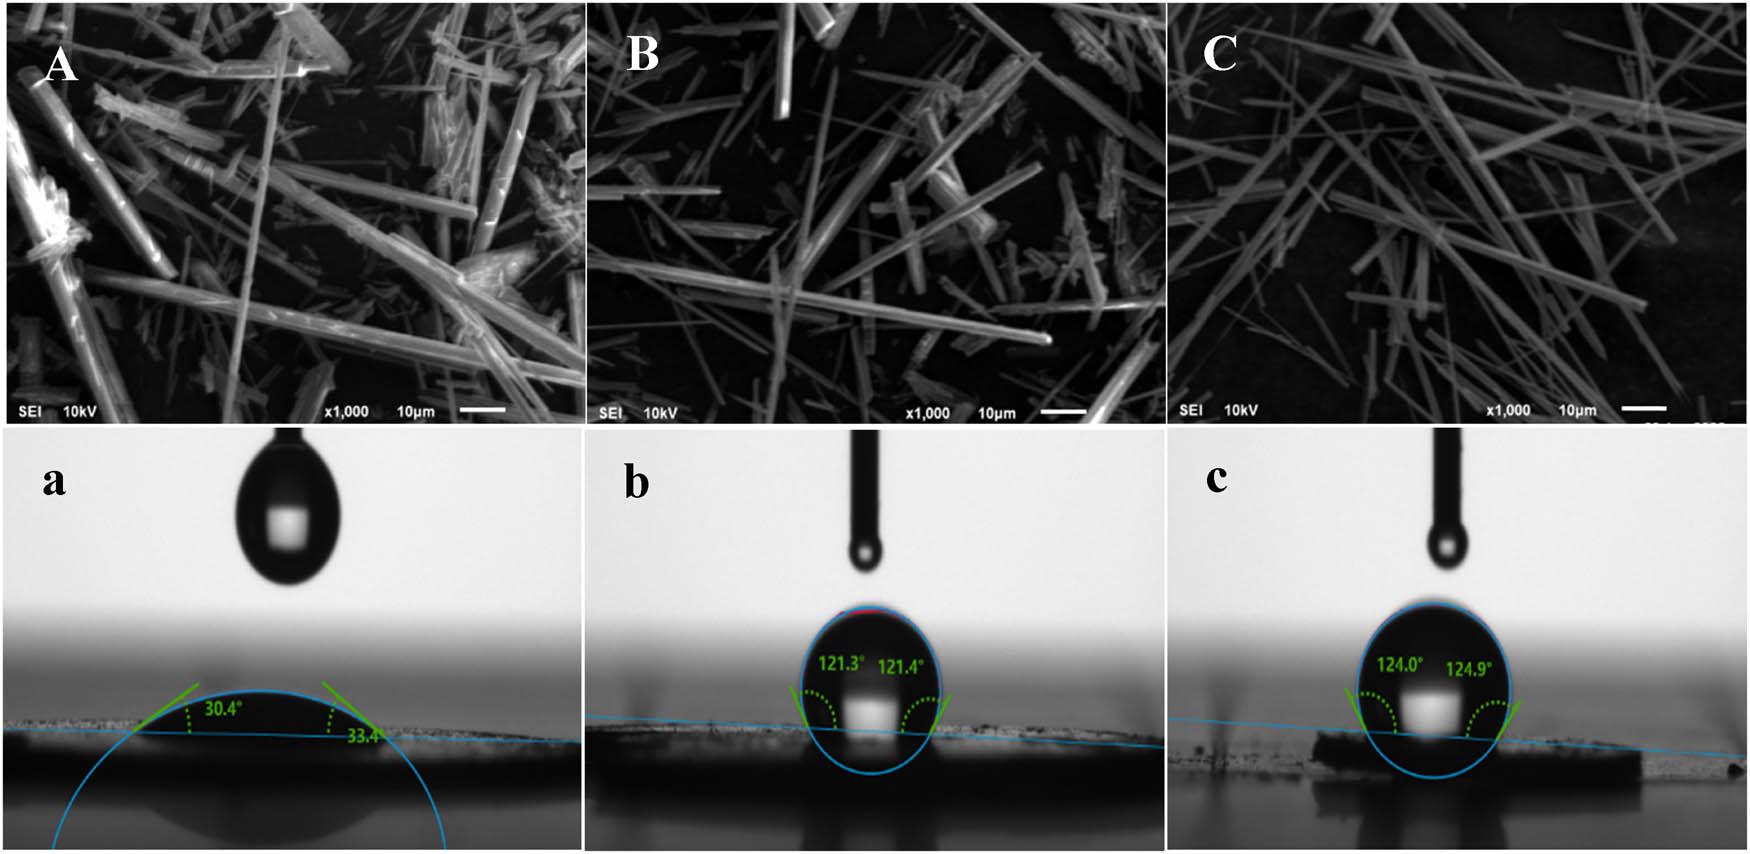
Figure 12
SEM images and contact angles of CSW before and after modification: (A) and (a) CSW, (B) and (b) MCSW, and (C) and (c) CMCSW.
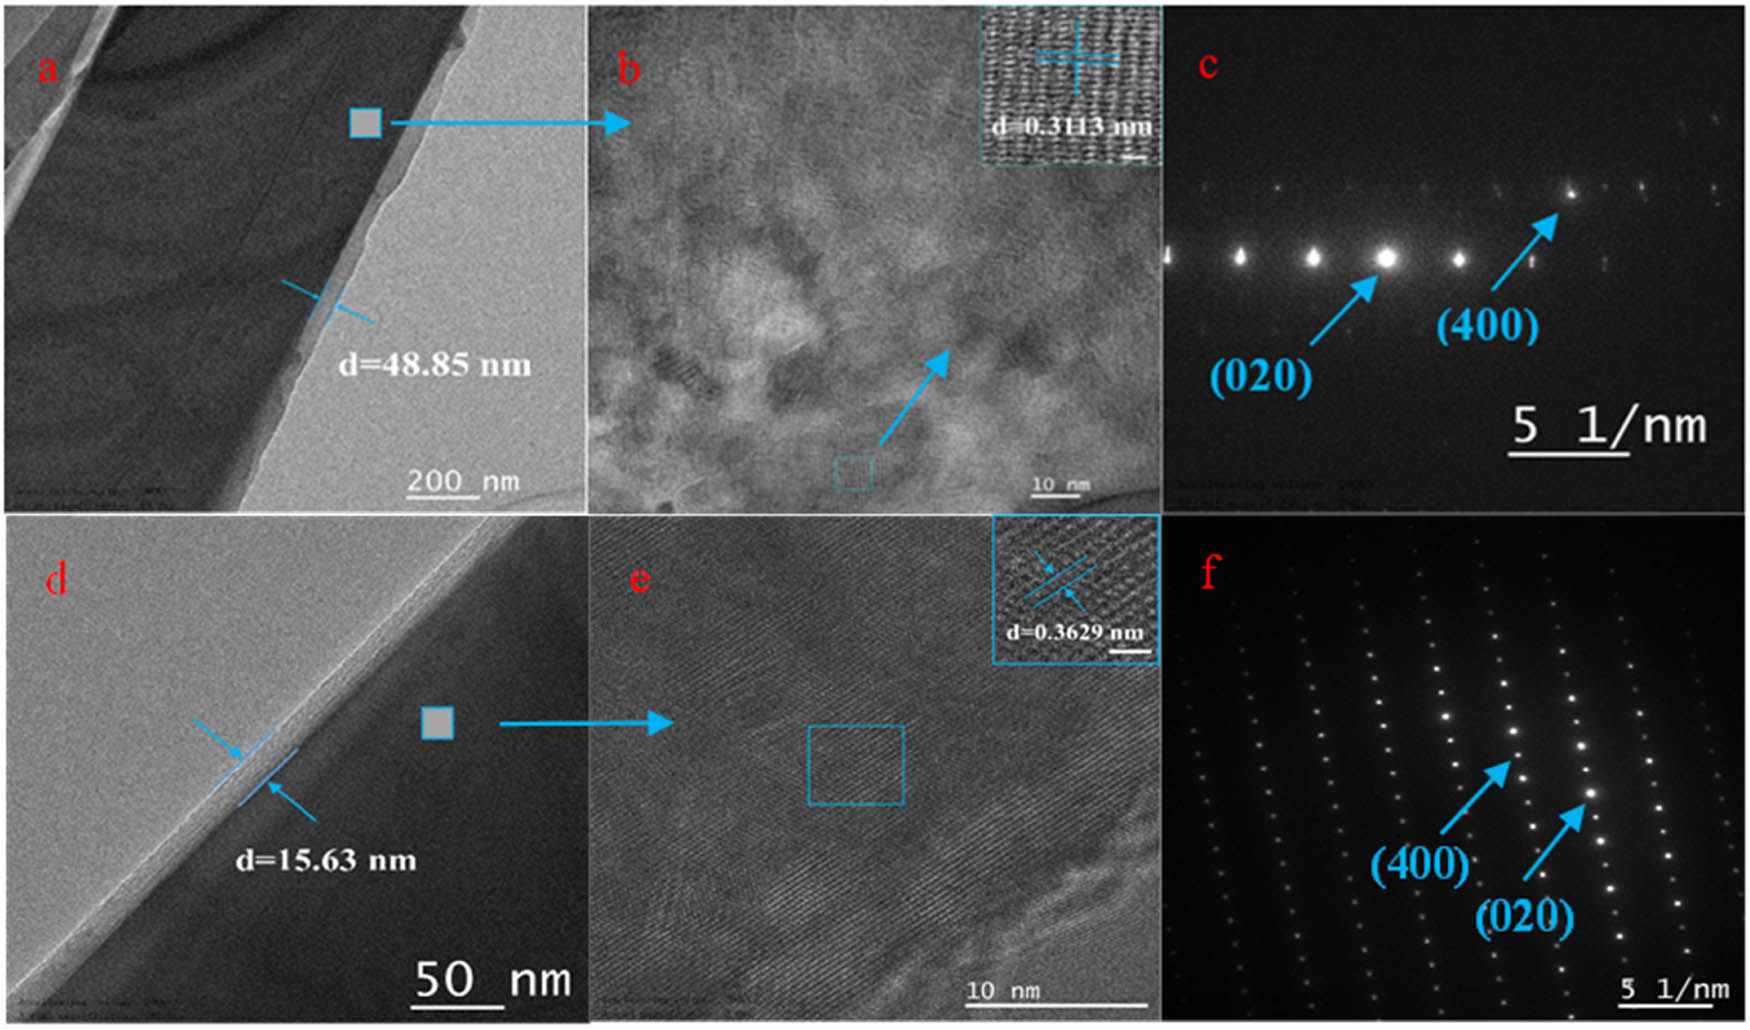
Figure 13
TEM images of modified CSW: (a) TEM photo of MCSW, (b) HRTEM photo of MCSW, (c) SAED photo of MCSW, (d) TEM photo of CMCSW, (e) HRTEM photo of CMCSW, and (f) SAED photo of CMCSW.
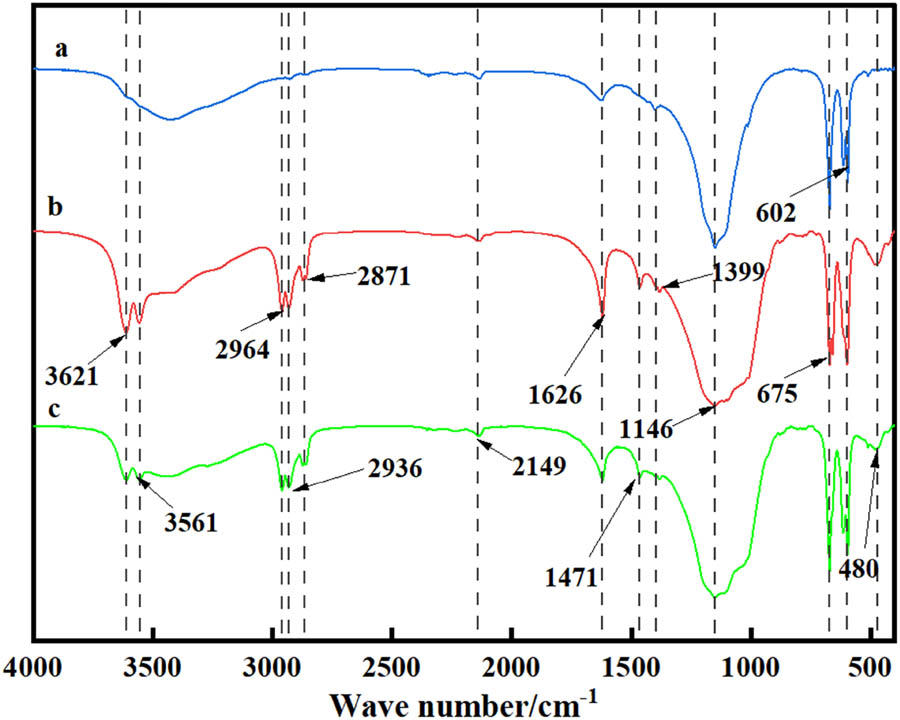
Figure 14
FT-IR patterns of anhydrous CSW before and after surface modification: (a) CSW, (b) MCSW, and (c) CMCSW.
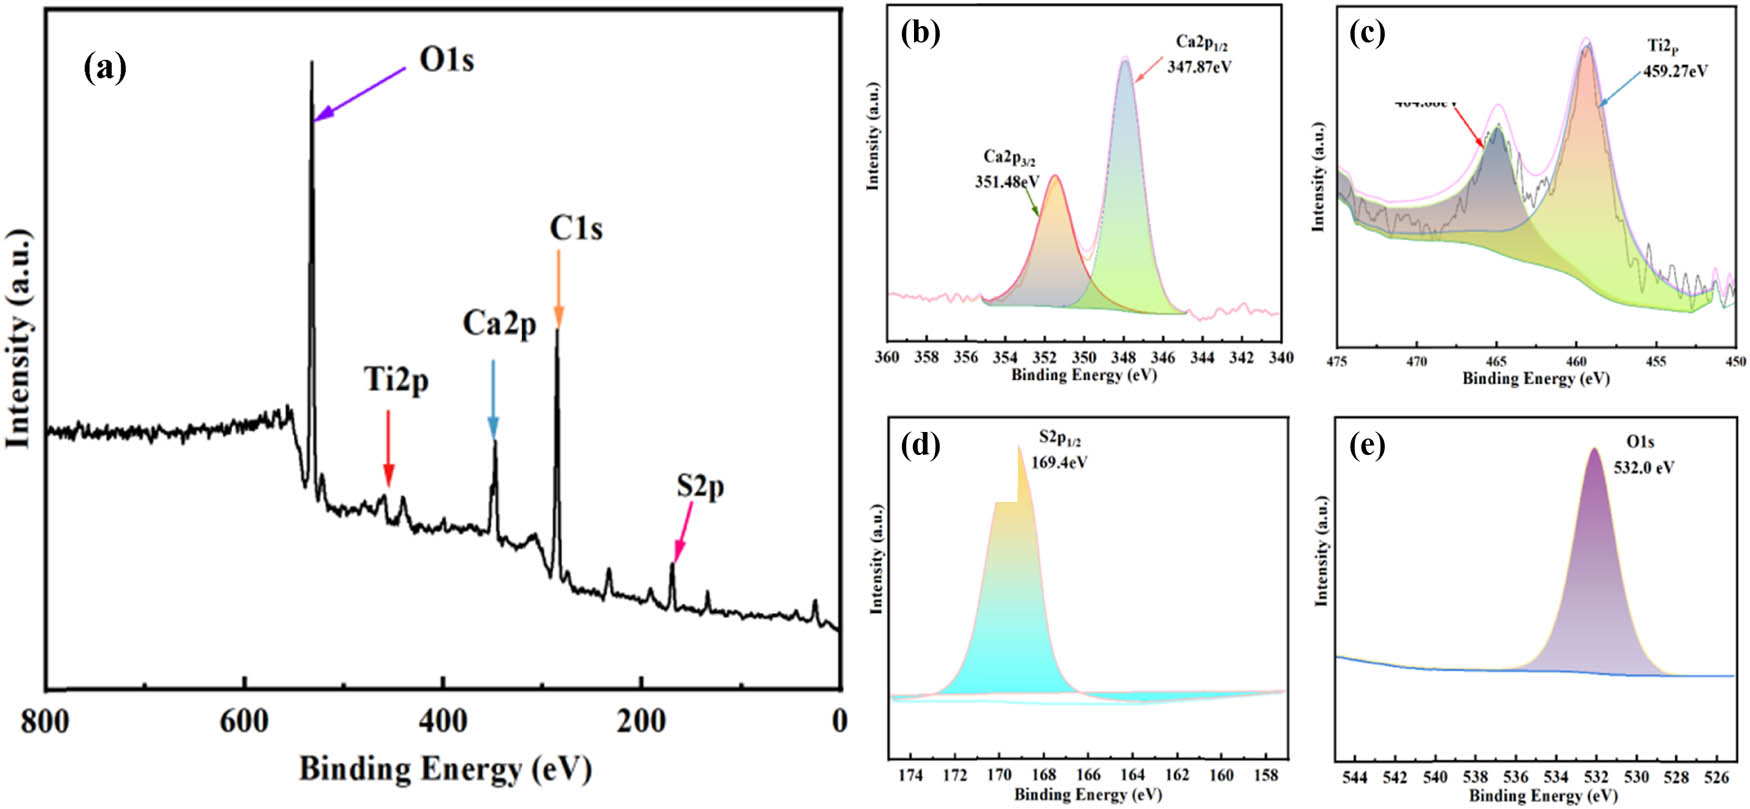
Figure 15
XPS analysis of MCSW: (a) total spectrum, (b) Ca, (c) Ti, (d) S, and (e) O.
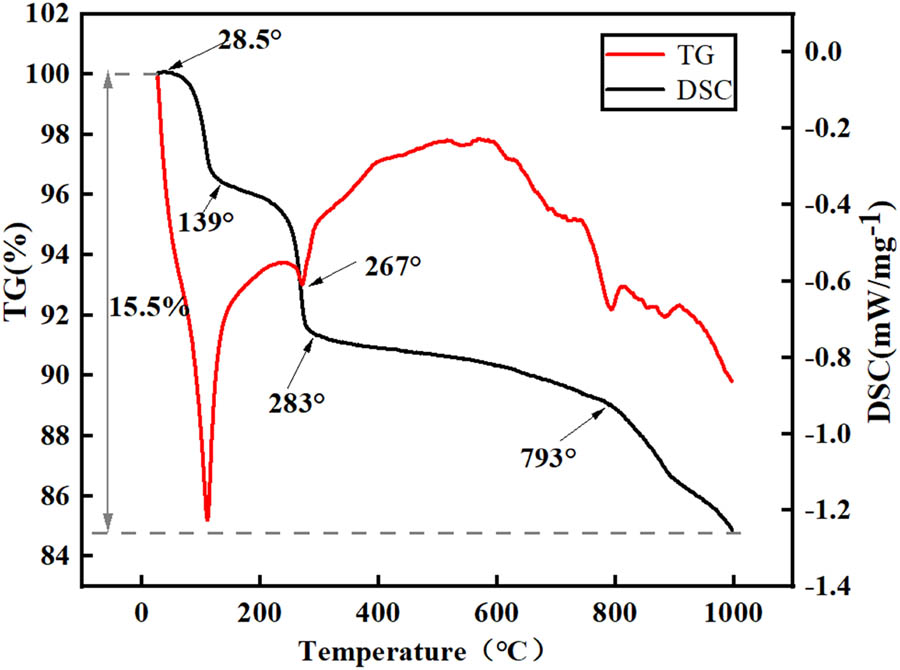
Figure 16
TG-DSC plot of CMCSW.
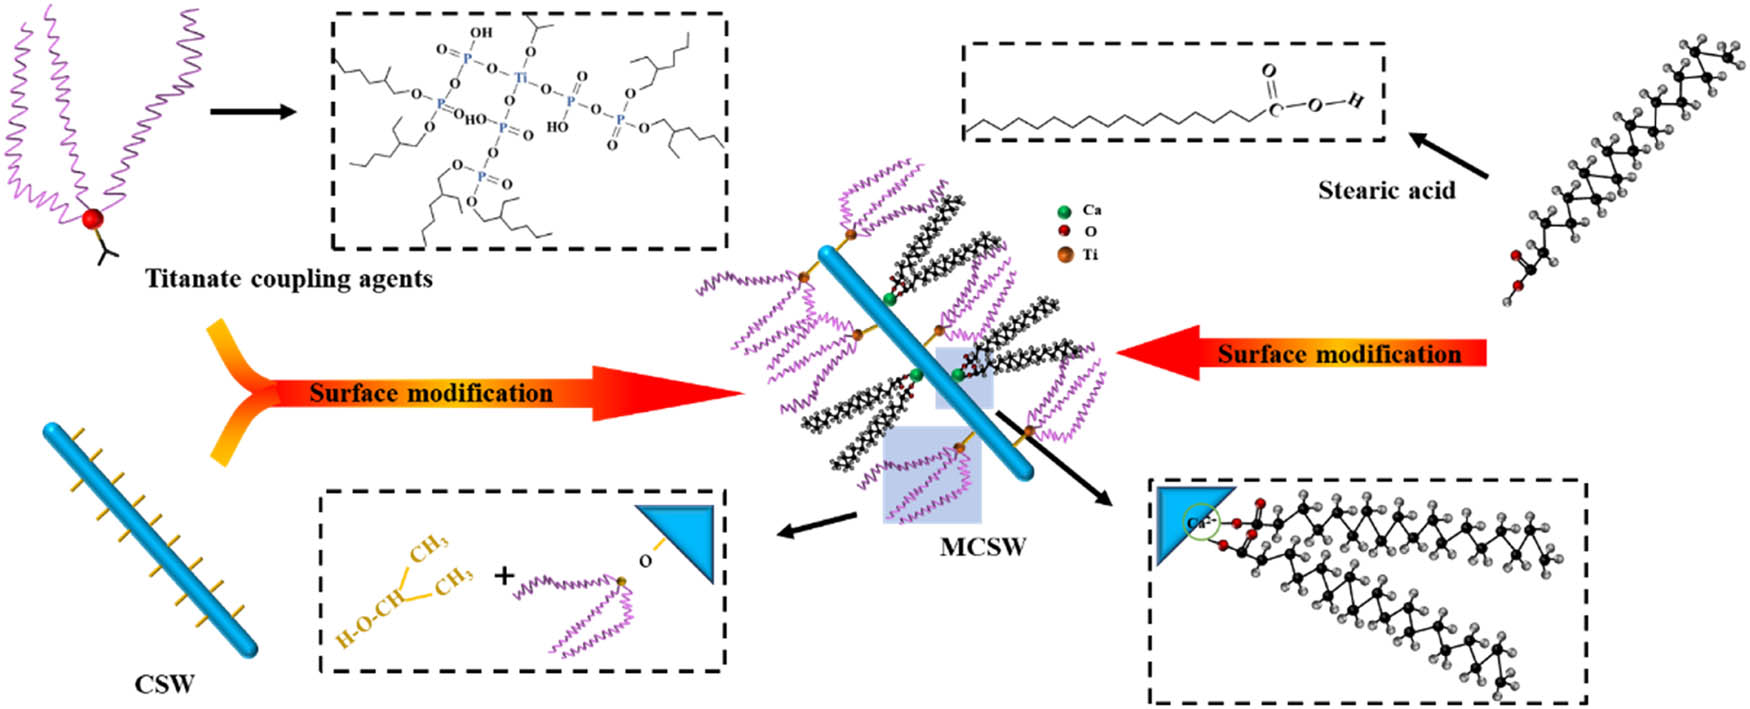
Figure 17
Modification mechanism diagram of CSW.
Table 3
Mechanical property parameters of PVC composites with different additions of CSW/MCSW/CMCSW.
| Specimens | Tensile strength (MPa) | Elongation at break (%) | Permissible tensile stress (σ) (MPa) | Strength max (N) | Young’s modulus (MPa) | Durometer (HA) | |
|---|---|---|---|---|---|---|---|
| 10% | 60% | ||||||
| Unfilled | 23.88 | 97.45 | 15.92 | 416.30 | 159.2 | 26.53 | 90 |
| CSW5 | 27.97 | 119.75 | 18.64 | 538.99 | 186.4 | 31.07 | 89 |
| CSW10 | 29.82 | 190.73 | 19.88 | 534.61 | 198.8 | 33.13 | 96 |
| CSW15 | 31.58 | 221.86 | 21.05 | 617.49 | 210.5 | 35.08 | 95 |
| CSW20 | 30.92 | 186.74 | 20.61 | 627.72 | 206.1 | 34.35 | 93 |
| MCSW5 | 33.90 | 154.30 | 22.60 | 623.96 | 226.0 | 37.67 | 93 |
| MCSW10 | 36.80 | 192.51 | 24.53 | 626.09 | 245.3 | 24.53 | 95 |
| MCSW15 | 37.19 | 240.50 | 24.79 | 665.82 | 247.9 | 41.32 | 96 |
| MCSW20 | 34.90 | 230.73 | 23.26 | 668.74 | 232.6 | 38.77 | 98 |
| CMCSW5 | 39.22 | 215.40 | 26.14 | 627.21 | 261.4 | 43.57 | 97 |
| CMCSW10 | 41.04 | 263.16 | 27.36 | 726.69 | 273.6 | 45.60 | 98 |
| CMCSW15 | 41.25 | 352.61 | 27.50 | 787.41 | 275.0 | 45.83 | 98 |
| CMCSW20 | 37.24 | 254.81 | 24.83 | 751.34 | 248.3 | 41.38 | 99 |
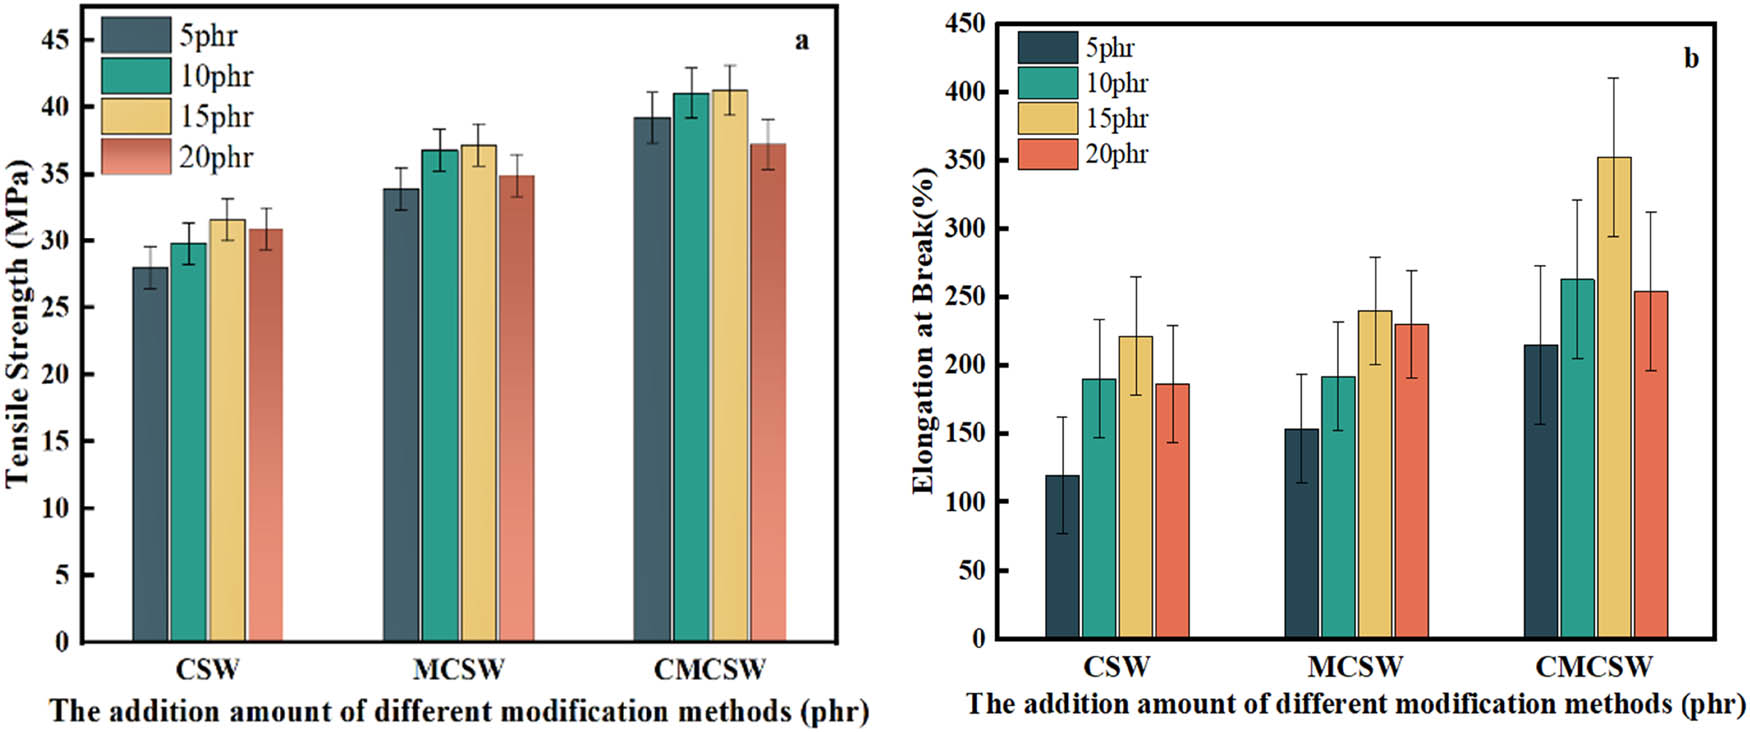
Figure 18
Mechanical properties of PVC composites with different additions of CSWs: (a) tensile strength and (b) elongation at break.
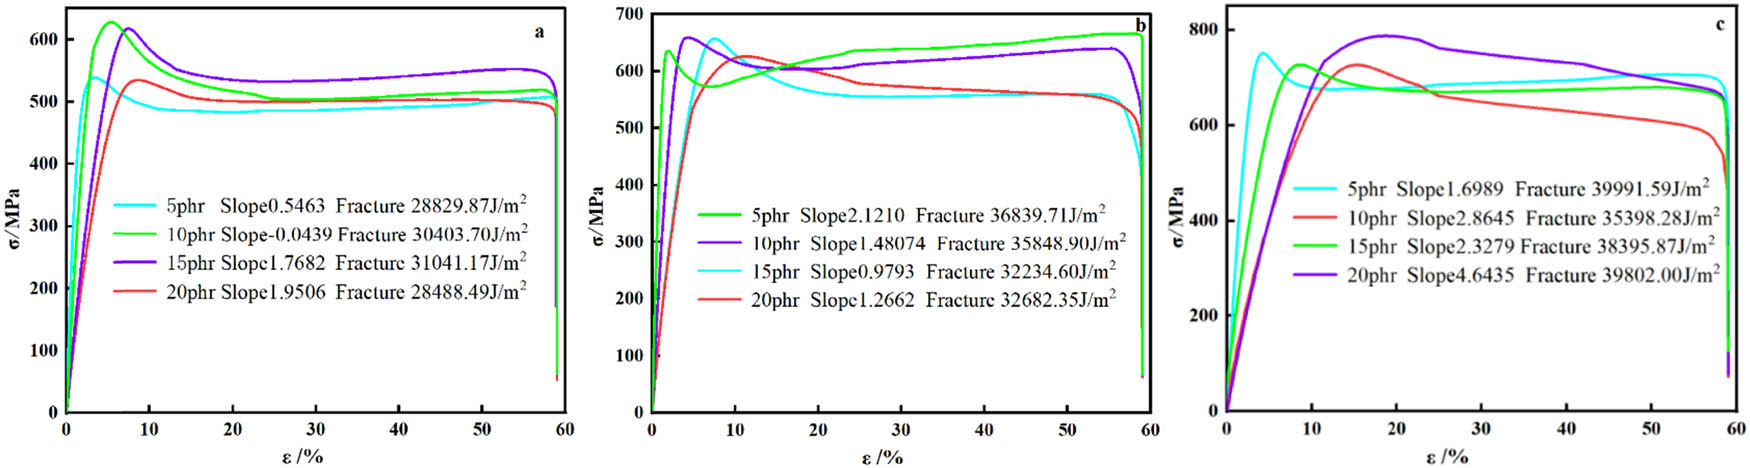
Figure 19
Stress–strain curve of CSW/MCSW/CMCSW-PVC composites: (a) stress–strain curve of CSW-PVC composite, (b) stress–strain curve of MCSW-PVC composite, and (c) stress–strain curve of CMCSW-PVC composite.
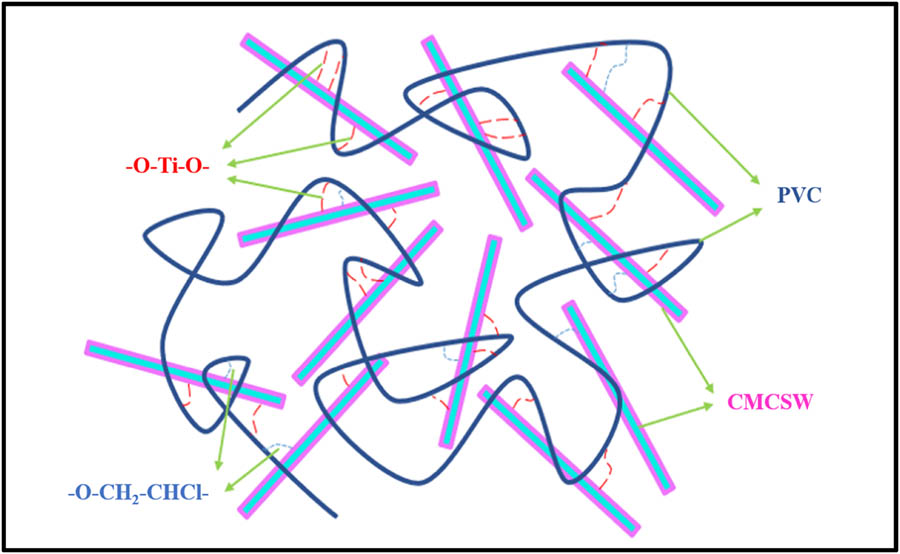
Figure 20
Interaction mechanism of CMCSW with PVC composites.