
Table 1.
NR formulation with different antioxidant additions (phr)
| Group | 1 | 2 | 3 |
|---|---|---|---|
| Natural Rubber | 100 | 100 | 100 |
| Zinc oxide | 5 | 5 | 5 |
| Stearic acid | 4 | 4 | 4 |
| Sulfur | 2.3 | 2.3 | 2.3 |
| Accelerator Ma | 0.3 | 0.3 | 0.3 |
| Accelerator DMb | 1.6 | 1.6 | 1.6 |
| Antioxidant PAS-Ce | 0 | 1.2 | 0 |
| Antioxidant 2246 | 0 | 0 | 1.2 |
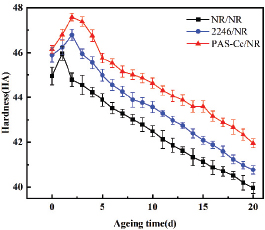
Fig. 1.
Changes in hardness of three systems at different aging times at 80°C
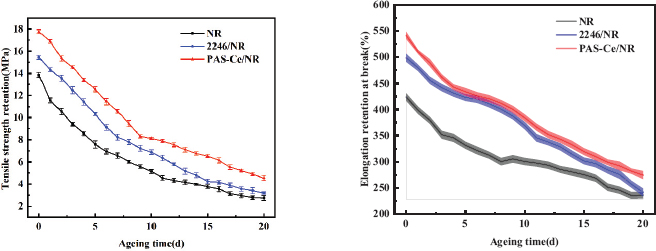
Fig. 2.
Tensile strength and elongation retention at the break of three systems with different aging times at 80°C
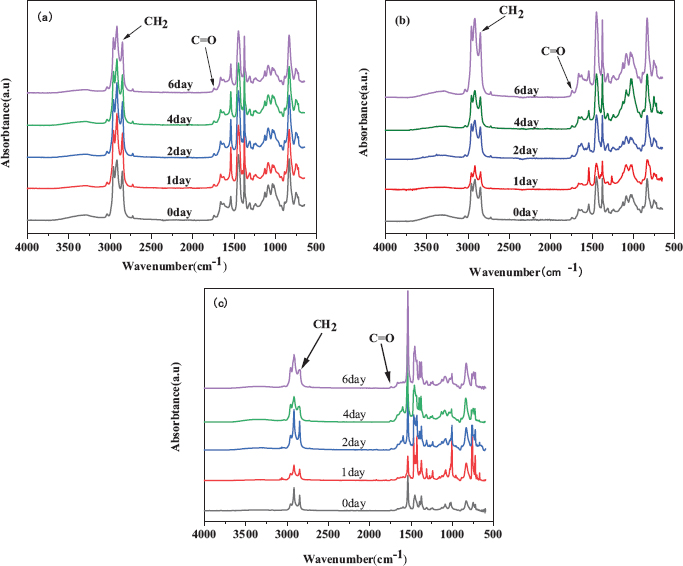
Fig. 3.
FTIR of three systems at 80°C before and after 6 days of aging (a) NR (b) PAS-Ce/NR (c) 2246/NR
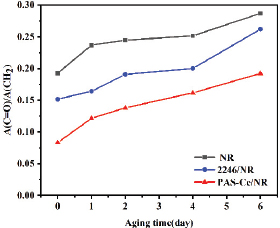
Fig. 4.
Absorbance ratio of NR at different times of aging at 80°C for the three systems (A(C=O)/A(CH2))
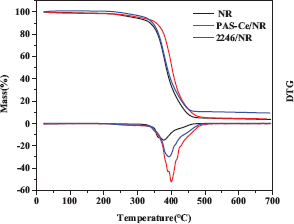
Fig. 5.
TG and DTG curves of samples from three NR systems at different warming rates
Table 2.
Characteristic temperature of thermal and oxygen aging of different adhesive materials
| Category | Blank adhesive material | PAS-Ce/NR 2246/NR | |
|---|---|---|---|
| T0/°C | 218 | 230 | 236 |
| Tmax/°C | 356 | 387 | 345 |
| T0.05/°C | 287 | 313 | 303 |
| Tf/°C | 466 | 480 | 472 |
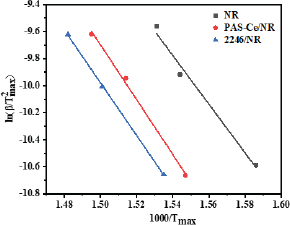
Fig. 6.
Plot of lnβ/T2max versus 1000/Tmax determined by the Kissinger method
Table 3.
Activation energy calculated according to the Kissinger method
| Category | Blank adhesive material | PAS-Ce/NR | 2246/NR |
|---|---|---|---|
| Ea/kJ/mol | 149.311 | 168.615 | 161.956 |
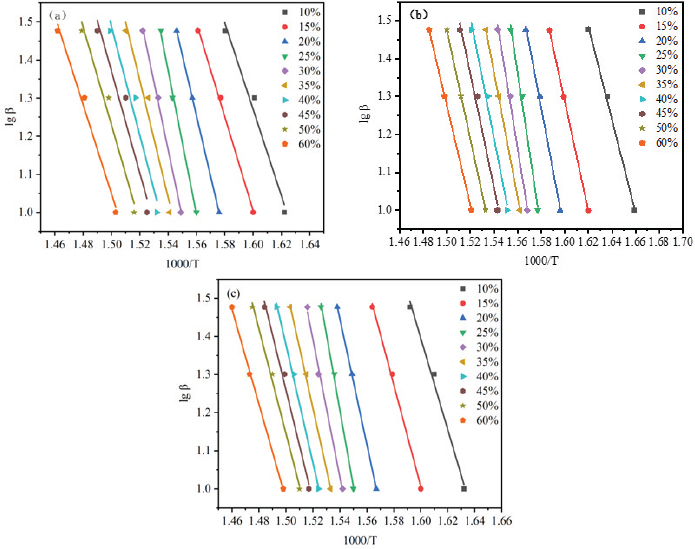
Fig. 7.
Relationship between lnβ and 1000/T in three NR complexes determined by FWO at specific weightlessness rates (a) NR (b) PAS-Ce/NR and (c) 2246/NR
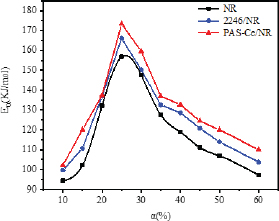
Fig. 8.
Relationship between Eα and α in three NR composite systems determined by FWO
Table 4.
Activation energy calculated according to the FWO method
| Category | Blank adhesive material | PAS-Ce/NR | 2246/NR |
|---|---|---|---|
| Ea(kJ·mol−1) | 94.423∼156.834 | 102.183∼173.406 | 99.678∼166.108 |

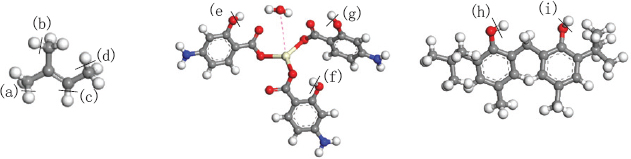
Fig. 9.
NR, chemical bond breakage location of antioxidant PAS-Ce and antioxidant 2246 (cyan, gray, blue, white, and red represent lanthanum, carbon, nitrogen, hydrogen, and oxygen, respectively)
Table 5.
Total electron energy of each dissociation reaction reactants and radical generators at 0 K
| NR | NR·(a) | NR·(b) | NR·(c) | NR·(d) | |
|---|---|---|---|---|---|
| E/(Ha) −196.4709459 PAS-Ce | −195.8011947 PAS-Ce·(e) | −195.8011947 PAS-Ce·(f) | −195.8011947 PAS-Ce·(g) | −195.8011947 2246 | |
| E/(Ha) −1786.38994 2246·(h) | −1795.4308478 2246·(i) | −1795.4539801 H· | −1795.4249401 | −1083.9759531 | |
| E/(Ha) −1083.40659 | −1083.368464 | −0.494376 |
Table 6.
Energy correction values of the reactants and radicals for each dissociation reaction
| T(K) | Energy School is worth (Kcal/mol) | |||||
|---|---|---|---|---|---|---|
| NR·(a) | PAS-Ce·(e) | PAS-Ce·(f) | PAS-Ce·(g) | 2246·(h) | 2246·(i) | |
| 200.00 | 63.045 | 203.522 | 204.182 | 203.446 | 277.349 | 276.256 |
| 225.00 | 61.225 | 198.901 | 199.726 | 198.742 | 273.450 | 272.447 |
| 250.00 | 59.347 | 193.999 | 194.989 | 193.757 | 269.301 | 268.394 |
| 275.00 | 57.412 | 189.213 | 190.359 | 188.894 | 264.907 | 264.101 |
| 298.15 | 55.570 | 188.82 | 189.978 | 182.961 | 260.622 | 259.913 |
| 300.00 | 55.421 | 183.37 | 184.698 | 177.161 | 260.270 | 259.569 |
| 325.00 | 53.376 | 177.652 | 179.153 | 171.099 | 255.396 | 254.804 |
| 350.00 | 51.277 | 171.673 | 173.349 | 164.78 | 250.280 | 249.807 |
| 375.00 | 49.125 | 165.437 | 167.29 | 158.21 | 244.947 | 244.581 |
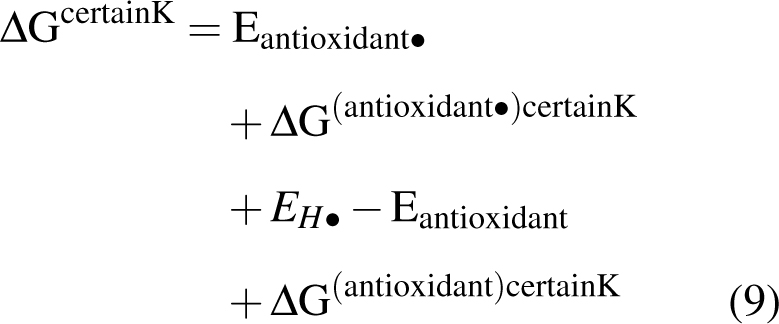
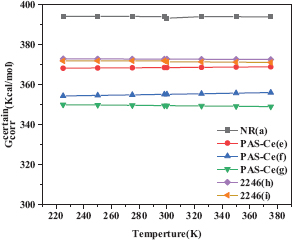
Fig. 10.
Free energy of each dissociation reaction at different temperatures