
Fig. 1.
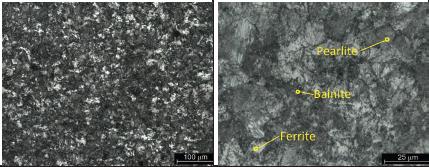
Fig. 2.
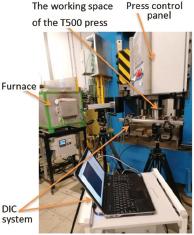
Fig. 3.
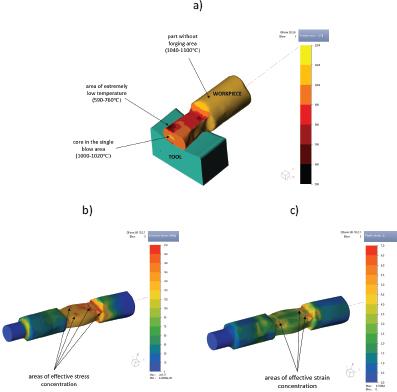
Fig. 4.
Fig. 5.
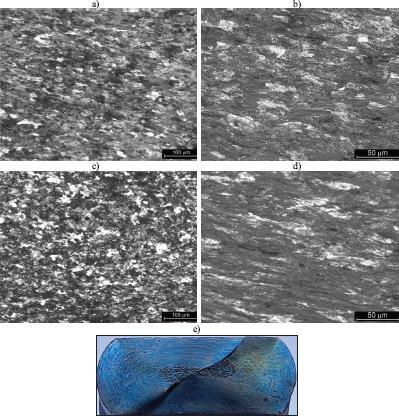
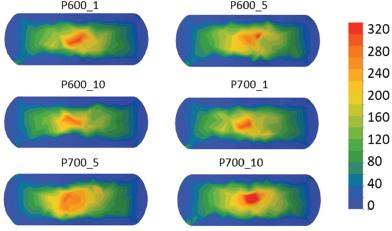
Fig. 6.
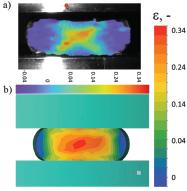
Fig. 7.
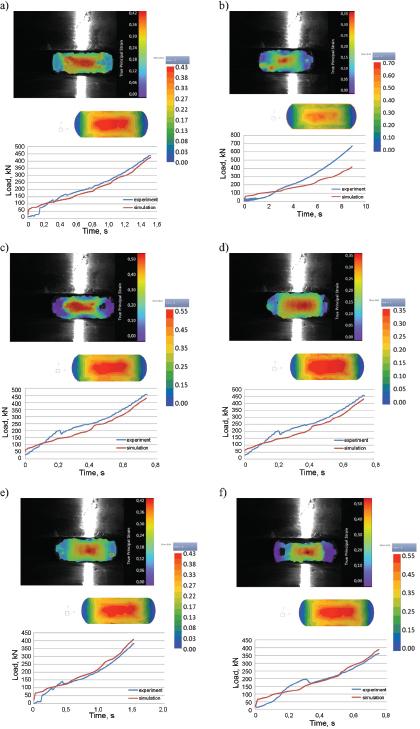
Fig. 8.
Effect of deformation process parameters on specimen condition
| Sample labeling | Temperature, °C | Traverse velocity, mm/s | Crack |
|---|---|---|---|
| P1_600 | 600 | 1 | No |
| P2_600 | 600 | 10 | Yes |
| P3_700 | 700 | 1 | No |
| P4_700 | 700 | 10 | No |
| P5_900 | 900 | 1 | No |
Maximum damage criterion value determined for individual samples
| Sample | Temperature, °C | Velocity, mm/s | Cockrofta – Lathama criterion |
|---|---|---|---|
| P600_1 | 600 | 1 | 306 |
| P600_5 | 5 | 267 | |
| P600_10 | 10 | 367 | |
| P700_1 | 700 | 1 | 297 |
| P700_5 | 5 | 268 | |
| P700_10 | 10 | 360 |
DIC Q-400 system parameters [31]
| System components | System parameters | ||
|---|---|---|---|
| Cameras | Max resolution | 5 MPx 2448 × 2050 pixel | |
| Pixel size | 3.45 μm × 3.45 μm | ||
| Shutter time | 4 μ sec- 2 sec | ||
| Objectives | 1.9/35 | Focal length | 34.9 mm |
| Focal distance (F-number) | 1.9 | ||
| Light source | Monochromatic | ||
| Wavelength | Red (620-750nm) | ||
| Calibration plates | GI-06-WMB | 9×9 | Object size 60 mm |
Chemical composition of 80MnSi8-6 steel [%wt_]
| Element | C | Si | Mn | P | S | Cr | Mo | V | Fe |
|---|---|---|---|---|---|---|---|---|---|
| Content, mass % | 0.79 | 1.55 | 1.9 | 0.003 | 0.003 | 1.3 | 0.25 | 0.11 | Bal. |