
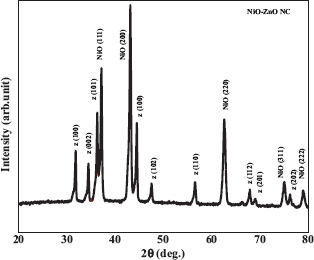
Fig. 1
X-ray diffraction pattern of NiO–ZnO NC. NC, nanocomposite
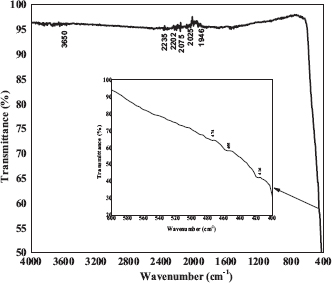
Fig. 2
FTIR spectrum of NiO–ZnO NC
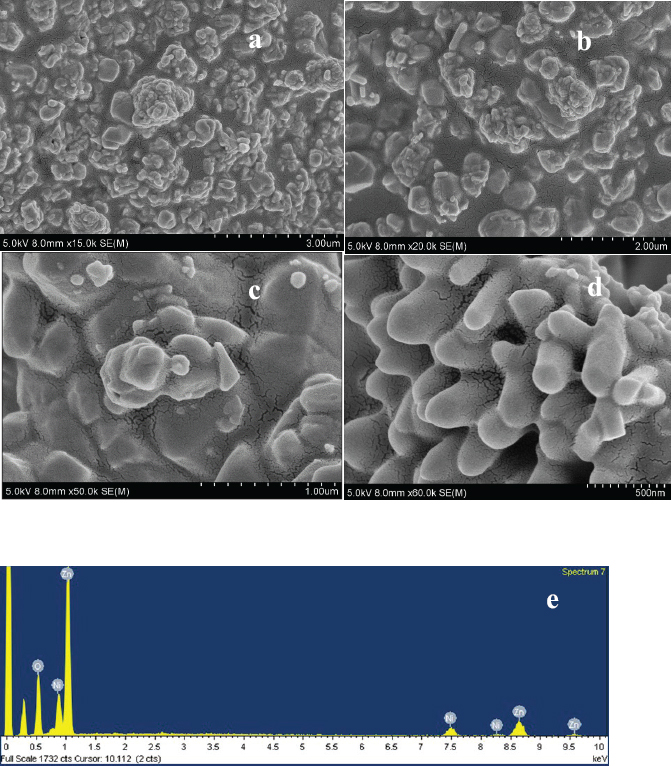
Fig. 3
(A–D) FE-SEM micrographs of NiO–ZnO NC with different magnifications (15, 20, 50 and 60 K) and (E) EDX spectrum. NC, nanocomposite
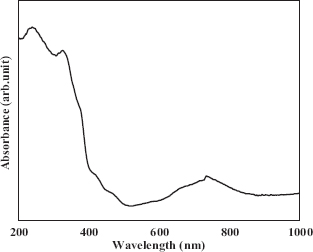
Fig. 4
Absorbance spectrum of NiO–ZnO NC. NC, nanocomposite
Table 1.
Shows that MIC of flucanazole and NiO–ZnO NC
| S.No | Test organism/Fungai | Zone of inhibition (mm) | ||||
| Standard | 250 μg | 500 μg | 750 μg | 1,000 μg | ||
| 1 | A. niger(E) | 10 ± 1.00 | 12 ± 1.10 | 14 ± 1.20 | 15.5 ± 1.20 | 17 ± 1.30 |
| 2 | A. flavus(D) | 10 ± 0.8 | 12.4 ± 1.0 | 15 ± 1.10 | 16.0 ± 1.2 | 18 ± 1.2 |
| 3 | A.fumigatus(C) | 8 ± 0.6 | 10.0 ± 0.8 | 11.5 ± 1.0 | 13 ± 1.1 | 14 ± 1.2 |
| 4 | C. albicans (B) | 10 ± 0.9 | 12 ± 1.0 | 14 ± 1.1 | 15.5 ± 1.2 | 17 ± 1.2 |
| 5 | Mucor sp.(A) | 10 ± 0.8 | 12.5 ± 1.0 | 14.5 ± 1.2 | 16 ± 1.3 | 17 ± 1.4 |
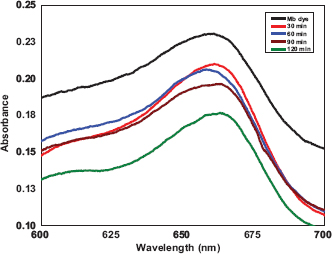
Fig. 5
Photocatalytic degradation of MB dye using ZnO/NiO catalyst. MB, methylene blue