
Fig. 1.

Fig. 2.
Fig. 3.
Fig. 4.
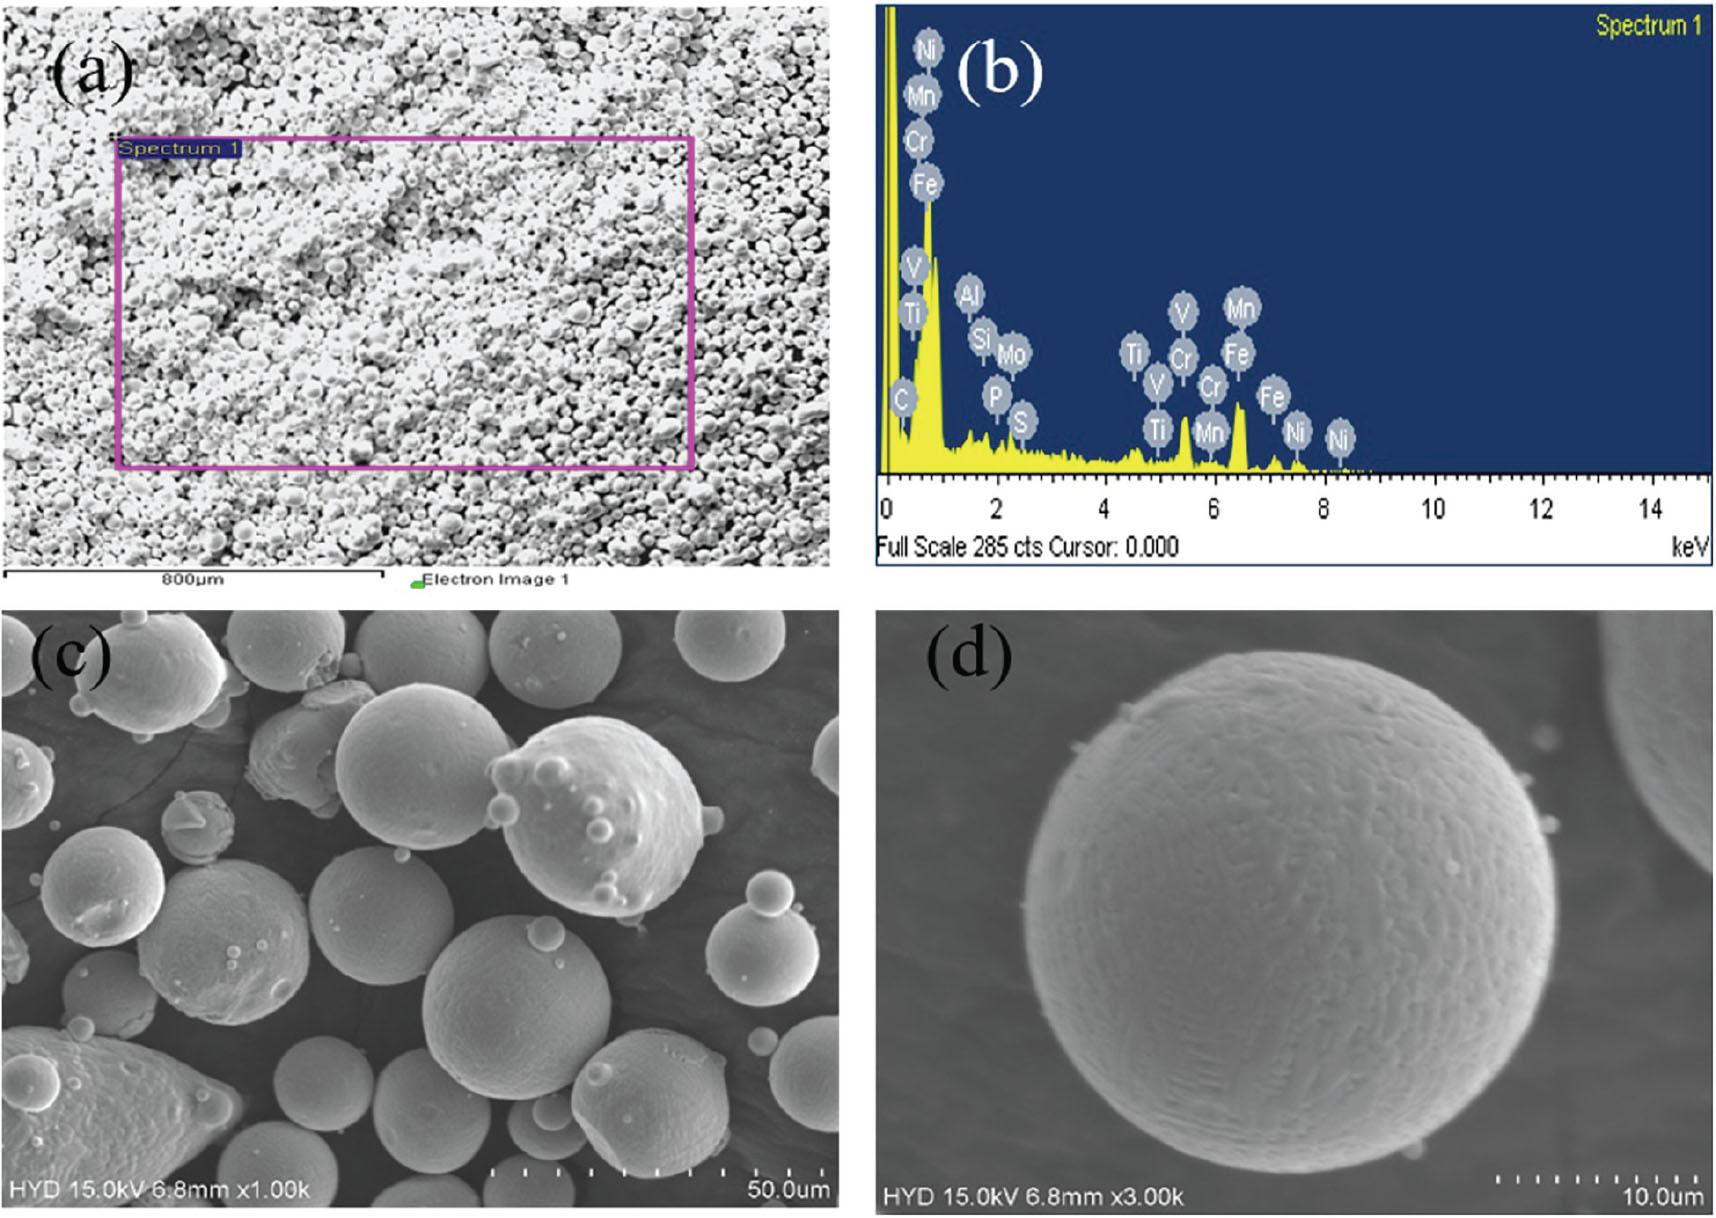
Fig. 5.
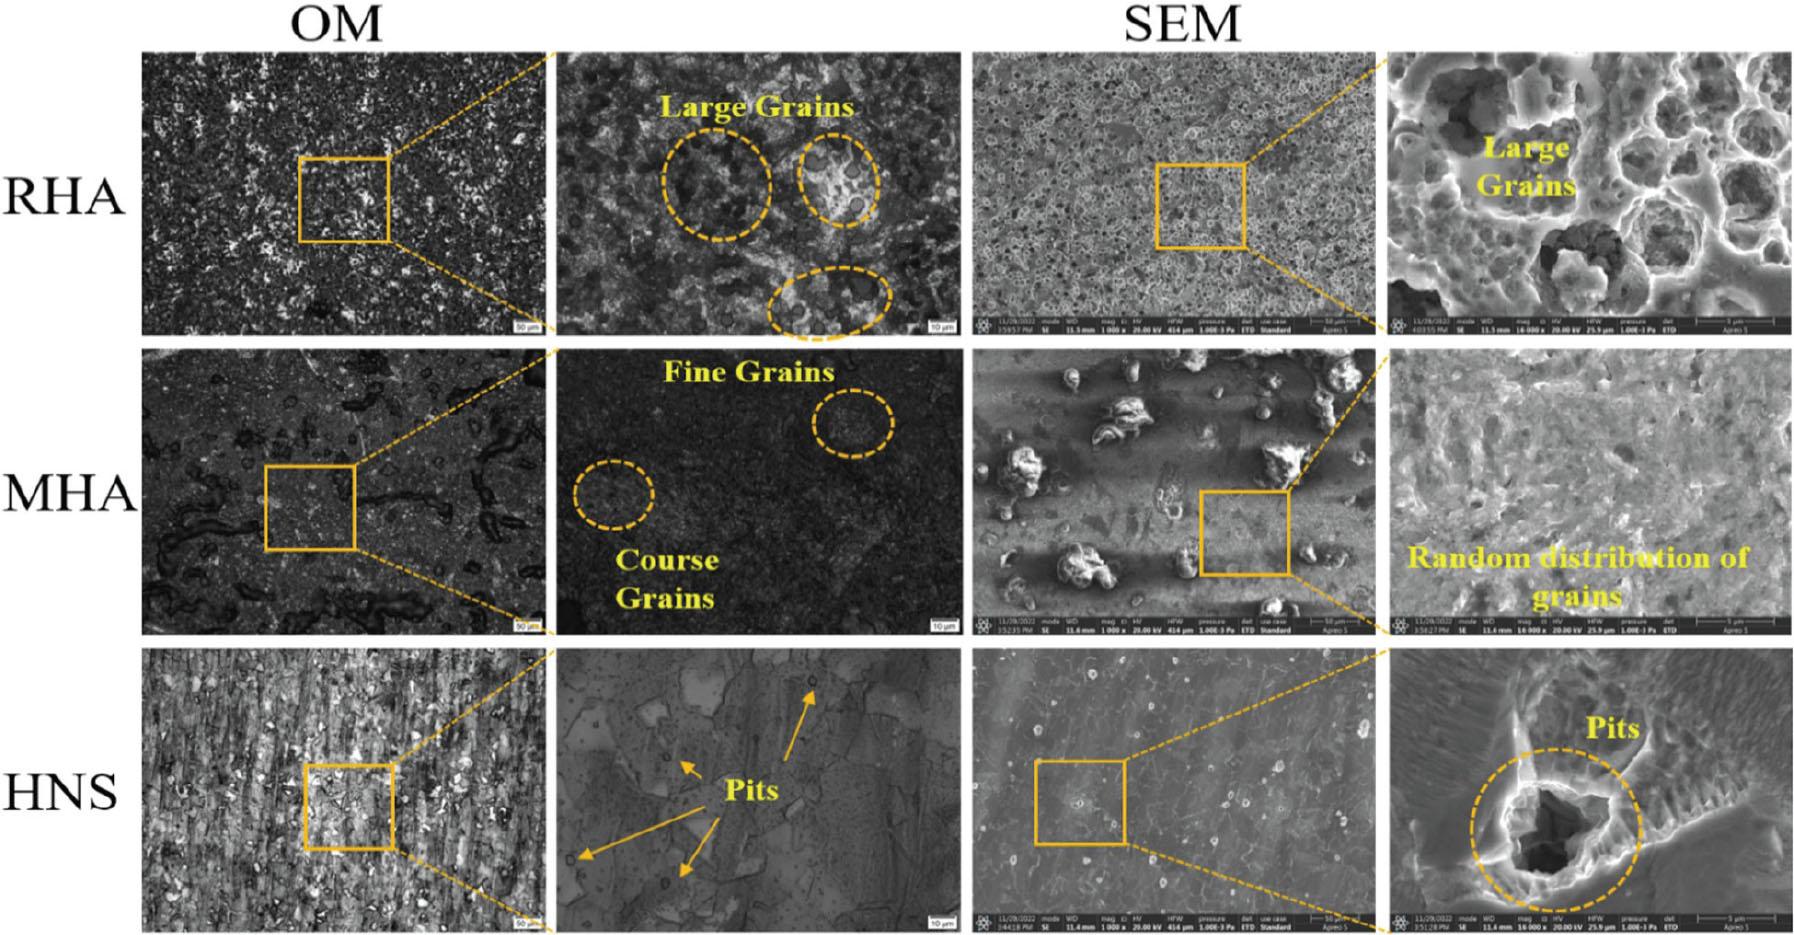
Fig. 6.

Fig. 7.
Fig. 8.
Fig. 9.
Response variables, surface roughness, and micro-Vickers hardness for the honeycomb micro-lattice structure
| Non-stress relived (as printed) | |||||||||
|---|---|---|---|---|---|---|---|---|---|
| Surface roughness (Ra) | Micro-Vickers Hardness (HV) | ||||||||
| S.No. | Lattice | Design | Non-stress relieved | Average (Ra) | Max | Min | Average | Max | Min |
| 1 | Honeycomb | Design 1 | 2A | 11.29 | 11.64 | 10.54 | 219HV1 | 225 | 213 |
| 2 | Honeycomb | Design 2 | 3A | 9.94 | 11.84 | 9.36 | 220HV1 | 227 | 215 |
| 3 | Honeycomb | Design 3 | 4A | 11.18 | 11.18 | 9.87 | 230HV1 | 242 | 218 |
| 4 | Honeycomb | Design 4 | 5A | 8.91 | 12.6 | 8.54 | 213HV1 | 218 | 207 |
| 5 | Honeycomb | Design 5 | 6A | 11.69 | 12.34 | 9.03 | 194HV1 | 201 | 190 |
| Stress relieved | |||||||||
| S.No. | Lattice | Design | Stress relieved | Average (Ra) | Max | Min | Average | Max | Min |
| 1 | Honeycomb | Design 1 | 2B | 14.58 | 24.26 | 9.23 | 233HV1 | 239 | 228 |
| 2 | Honeycomb | Design 2 | 3B | 14.79 | 17.12 | 10.48 | 214HV1 | 220 | 209 |
| 3 | Honeycomb | Design 3 | 4B | 13.76 | 15.91 | 12.11 | 193HV1 | 197 | 190 |
| 4 | Honeycomb | Design 4 | 5B | 12.26 | 13.66 | 11.43 | 222HV1 | 226 | 218 |
| 5 | Honeycomb | Design 5 | 6B | 20.24 | 24.23 | 17.19 | 220HV1 | 226 | 216 |
| Heat treated (Final specimens) | |||||||||
| S. No. | Lattice | Design | Heat treated | Average (Ra) | Max | Min | Average | Max | Min |
| 1 | Honeycomb | Design 1 | 2C,2D,2E | 11.59 | 15.2 | 9.12 | 460HV1 | 475 | 451 |
| 2 | Honeycomb | Design 2 | 3C,3D.3E | 7.77 | 7.94 | 7.65 | 418HV1 | 425 | 412 |
| 3 | Honeycomb | Design 3 | 4C,4D,4E | 7.67 | 8.46 | 6.63 | 423HV1 | 426 | 420 |
| 4 | Honeycomb | Design 4 | 5C,5D,5E | 8.82 | 8.87 | 8.77 | 460HV1 | 470 | 451 |
| 5 | Honeycomb | Design 5 | 6C.6D,6E | 11.92 | 12.81 | 10.41 | 455HV1 | 461 | 450 |
Response variables, surface roughness, and micro-Vickers hardness for the gyroid micro-lattice structure
| Non-stress relived (as printed) | |||||||||
|---|---|---|---|---|---|---|---|---|---|
| Surface roughness (Ra) | Micro-Vickers hardness (HV) | ||||||||
| S. No. | Lattice | Design | Non-Stress Relieved | Average (Ra) | Max | Min | Average | Max | Min |
| 1 | Gyroid | Design 1 | 1A | 10.5 | 12.86 | 8.11 | 215HV1 | 220 | 211 |
| Stress relieved | |||||||||
| S. No. | Lattice | Design | Stress relieved | Average (Ra) | Max | Min | Average | Max | Min |
| 1 | Gyroid | Design 1 | 1B | 11.85 | 13.46 | 10.83 | 226HV1 | 229 | 222 |
| Heat treated (final specimens) | |||||||||
| S. No. | Lattice | Design | Heat treated | Average (Ra) | Max | Min | Average | Max | Min |
| 1 | Gyroid | Design 1 | 1C,1D,1E | 3.56 | 3.74 | 3.37 | 418HV1 | 425 | 411 |
Particle size distribution – sieve analysis
| Particle size (μm) | Sieve number | % by mass |
|---|---|---|
| <45 | −325 | 78.28 |
| >45 | +325 | 17.28 |
| >53 | +270 | 3.78 |
| >63 | +230 | 0.65 |
Corrosion rate for RHA, MHA, HNS, honeycomb, and gyroid micro-lattice structures
| Case | Specimen | Initial weight (g) | Final weight (g) | Total weight loss (g) | Corrosion rate (mm/ year) |
|---|---|---|---|---|---|
| Existing materials | RHA | 12.4093 | 12.4029 | 0.0064 | 2.847817577 |
| MHA | 11.8837 | 11.8795 | 0.0042 | 1.868880285 | |
| HNS | 13.6118 | 13.6066 | 0.0052 | 2.313851781 | |
| Honeycomb lattice | 5D (ideal) | 77.6933 | 77.3803 | 0.313 | 1.218227858 |
| structure | 6D (non-ideal) | 80.6307 | 80.3128 | 0.3179 | 1.237299156 |
| Gyroid | 1D | 40.0436 | 39.9027 | 0.1409 | 1.671511872 |
Flow rate, apparent, and tap density test results
| Test | Test method | Results |
|---|---|---|
| Flow rate | ASTM B213 | 18s/50g |
| Apparent density | ASTM B212 | 3.98g/cm3 |
| Tap density | ASTM B527 | 4.65g/cm3 |
Compressive residual stress for RHA, MHA, HNS, honeycomb and gyroid micro-lattice structures
| Material | Compressive residual stress values (MPa) |
|---|---|
| Existing Materials | |
| RHA | 306.627 |
| MHA | 348.454 |
| HNS | 432.367 |
| Micro-metallic lattice structures | |
| Honeycomb | 581.907 |
| Gyroid | 483.679 |
Corrosion resistance (in %) of micro-metallic lattice structures: honeycomb and gyroid vs_ RHA, MHA, and HNS
| Before compression | |||
|---|---|---|---|
| Comparison of corrosion rate | Percentage difference | Comparison of corrosion rate | Percentage difference |
| Honeycomb vs. RHA | 57.23% | Gyroid vs. RHA | 41.31% |
| Honeycomb vs. MHA | 34.83% | Gyroid vs. MHA | 10.6% |
| Honeycomb vs. HNS | 47.36 % | Gyroid vs. HNS | 27.75% |
| After compression tests | |||
| Honeycomb vs. RHA | 37.61% | Gyroid vs. RHA | 17.88% |
| Honeycomb vs. MHA | 4.92% | Gyroid vs. MHA | 25.16% |
| Honeycomb vs. HNS | 23.21% | Gyroid vs. HNS | 1.08% |
| Micro-metallic lattice structures | |||
| Honeycomb vs. gyroid (before compression) | 27.11% | ||
| Honeycomb vs. gyroid (after compression) | 24.03% | ||
Micro-lattice structure design variations
| Gyroid | Design 1 | ||||
|---|---|---|---|---|---|
| Dimensions (L × W × H) (mm) 24 × 20 × 30 | |||||
| Honeycomb | Design 1 | Design 2 | Design 3 | Design 4 | Design 5 |
| Dimensions (L × W × H) (mm) | 24 × 20 × 30 | ||||
| Wall thickness (mm) | 2 | 2 | 2 | 2 | 2 |
| Detail size (mm) | 1 | 1 | 1 | 1 | 1 |
| Hole diameter (mm) | 1.4 | 1.2 | 1 | 0.8 | 0.5 |
| Infill thickness (mm) | 1.4 | 1.2 | 1 | 0.8 | 0.5 |
Corrosion rate for honeycomb and gyroid micro-lattice structures after compression test
| Case | Specimen | Initial weight (g) | Final weight (g) | Total weight loss (g) | Corrosion rate (mm/year) |
|---|---|---|---|---|---|
| Honeycomb lattice | 5C (ideal) | 82.129 | 81.6725 | 0.4565 | 1.776744463 |
| structure | 6C (non-ideal) | 78.4252 | 77.9683 | 0.4569 | 1.778301304 |
| Gyroid | 1C | 32.1465 | 31.9494 | 0.1971 | 2.338218523 |
Compressive residual stress comparison of micro metallic lattice structures honeycomb and gyroid vs_ RHA, MHA, and HNS
| Comparison of residual stress values | % Increase in residual stress | Comparison of residual stress values | % Increase in residual stress |
|---|---|---|---|
| Honeycomb vs. RHA | 47.30% | Gyroid vs. RHA | 36.6% |
| Honeycomb vs. MHA | 40.12% | Gyroid vs. MHA | 27.96% |
| Honeycomb vs. HNS | 25.70% | Gyroid vs. HNS | 10.61% |
| Micro-metallic lattice structures | |||
| Honeycomb vs. Gyroid | 16.88% | ||
TOPSIS analysis for honeycomb micro-lattice structure for LPBF-generated specimens
| Non-stress-relieved condition | ||||||||
|---|---|---|---|---|---|---|---|---|
| Normalized residual matrix | Weighted residual matrix | Distance to ideal | ||||||
| Coupon no. | NRa | NVHN | WRa | WVHN | Si+ | Si- | Ci | Rank |
| 2A | 0.369 | 0.419 | 0.185 | 0.209 | 0.039 | 0.007 | 0.154 | 4 |
| 3A | 0.325 | 0.421 | 0.163 | 0.210 | 0.017 | 0.029 | 0.633 | 2 |
| 4A | 0.365 | 0.440 | 0.183 | 0.220 | 0.037 | 0.010 | 0.204 | 3 |
| 5A | 0.291 | 0.408 | 0.146 | 0.204 | 0.000 | 0.046 | 0.994 | 1 |
| 6A | 0.382 | 0.371 | 0.191 | 0.186 | 0.047 | 0.001 | 0.002 | 5 |
| Stress-relieved condition | ||||||||
| Normalized residual matrix | Weighted residual matrix | Distance to ideal | ||||||
| Coupon no. | NRa | NVHN | WRa | WVHN | Si+ | Si- | Ci | Rank |
| 2B | 0.477 | 0.446 | 0.239 | 0.223 | 0.038 | 0.094 | 0.713 | 3 |
| 3B | 0.484 | 0.409 | 0.242 | 0.205 | 0.042 | 0.090 | 0.682 | 4 |
| 4B | 0.450 | 0.369 | 0.225 | 0.185 | 0.026 | 0.106 | 0.803 | 2 |
| 5B | 0.401 | 0.425 | 0.201 | 0.212 | 0.000 | 0.131 | 0.999 | 1 |
| 6B | 0.662 | 0.421 | 0.331 | 0.210 | 0.131 | 0.001 | 0.005 | 5 |
| Heat-treated condition | ||||||||
| Normalized residual matrix | Weighted residual matrix | Distance to ideal | ||||||
| Coupon no. | NRa | NVHN | WRa | WVHN | Si+ | Si- | Ci | Rank |
| 2C,2D,2E | 0.379 | 0.880 | 0.190 | 0.440 | 0.064 | 0.007 | 0.099 | 4 |
| 3C,3D.3E | 0.254 | 0.800 | 0.127 | 0.400 | 0.003 | 0.068 | 0.954 | 2 |
| 4C,4D,4E | 0.251 | 0.809 | 0.125 | 0.405 | 0.001 | 0.070 | 0.982 | 1 |
| 5C,5D,5E | 0.289 | 0.880 | 0.144 | 0.440 | 0.019 | 0.052 | 0.736 | 3 |
| 6C.6D,6E | 0.390 | 0.871 | 0.195 | 0.435 | 0.070 | 0.001 | 0.018 | 5 |
Physical properties of A286 steel
| Property | Value | ||||||||||||
|---|---|---|---|---|---|---|---|---|---|---|---|---|---|
| Ultimate tensile strength | 620 MPa | ||||||||||||
| Yield strength | 275 MPa | ||||||||||||
| Elongation at break | 40% | ||||||||||||
| Modulus of elasticity | 201 GPa | ||||||||||||
| Poisson’s ratio | 0.3 | ||||||||||||
| Shear modulus | 77 GPa | ||||||||||||
| Reduction of area | 20% | ||||||||||||
| Chemical composition (% weight factor) of A286 steel | |||||||||||||
| Element | C | Mn | Si | P | S | Ni | Cr | Mo | V | Al | Ti | Cu | Fe |
| Weight (%) | 0.034 | 0.126 | 0.236 | 0.012 | 0.006 | 25.62 | 15.40 | 1.331 | 0.196 | 0.209 | 2.054 | 0.014 | Bal. |