
Fig. 1.
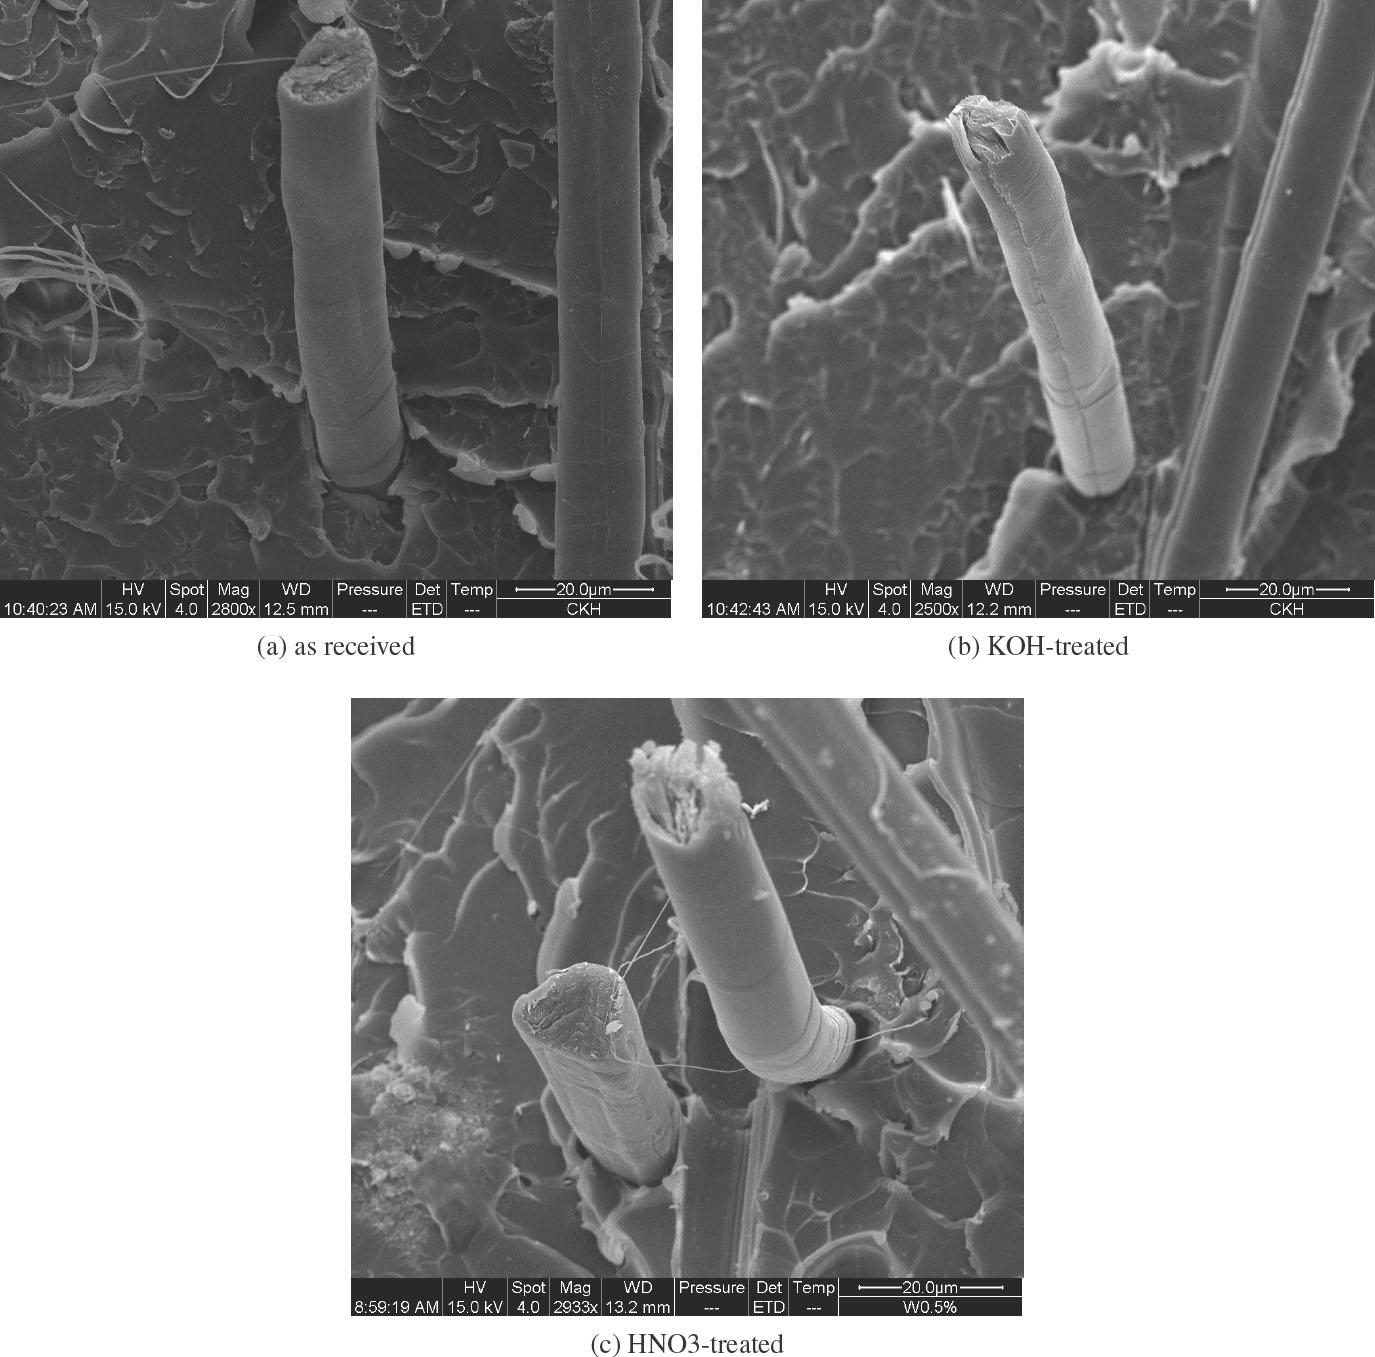
Fig. 2.
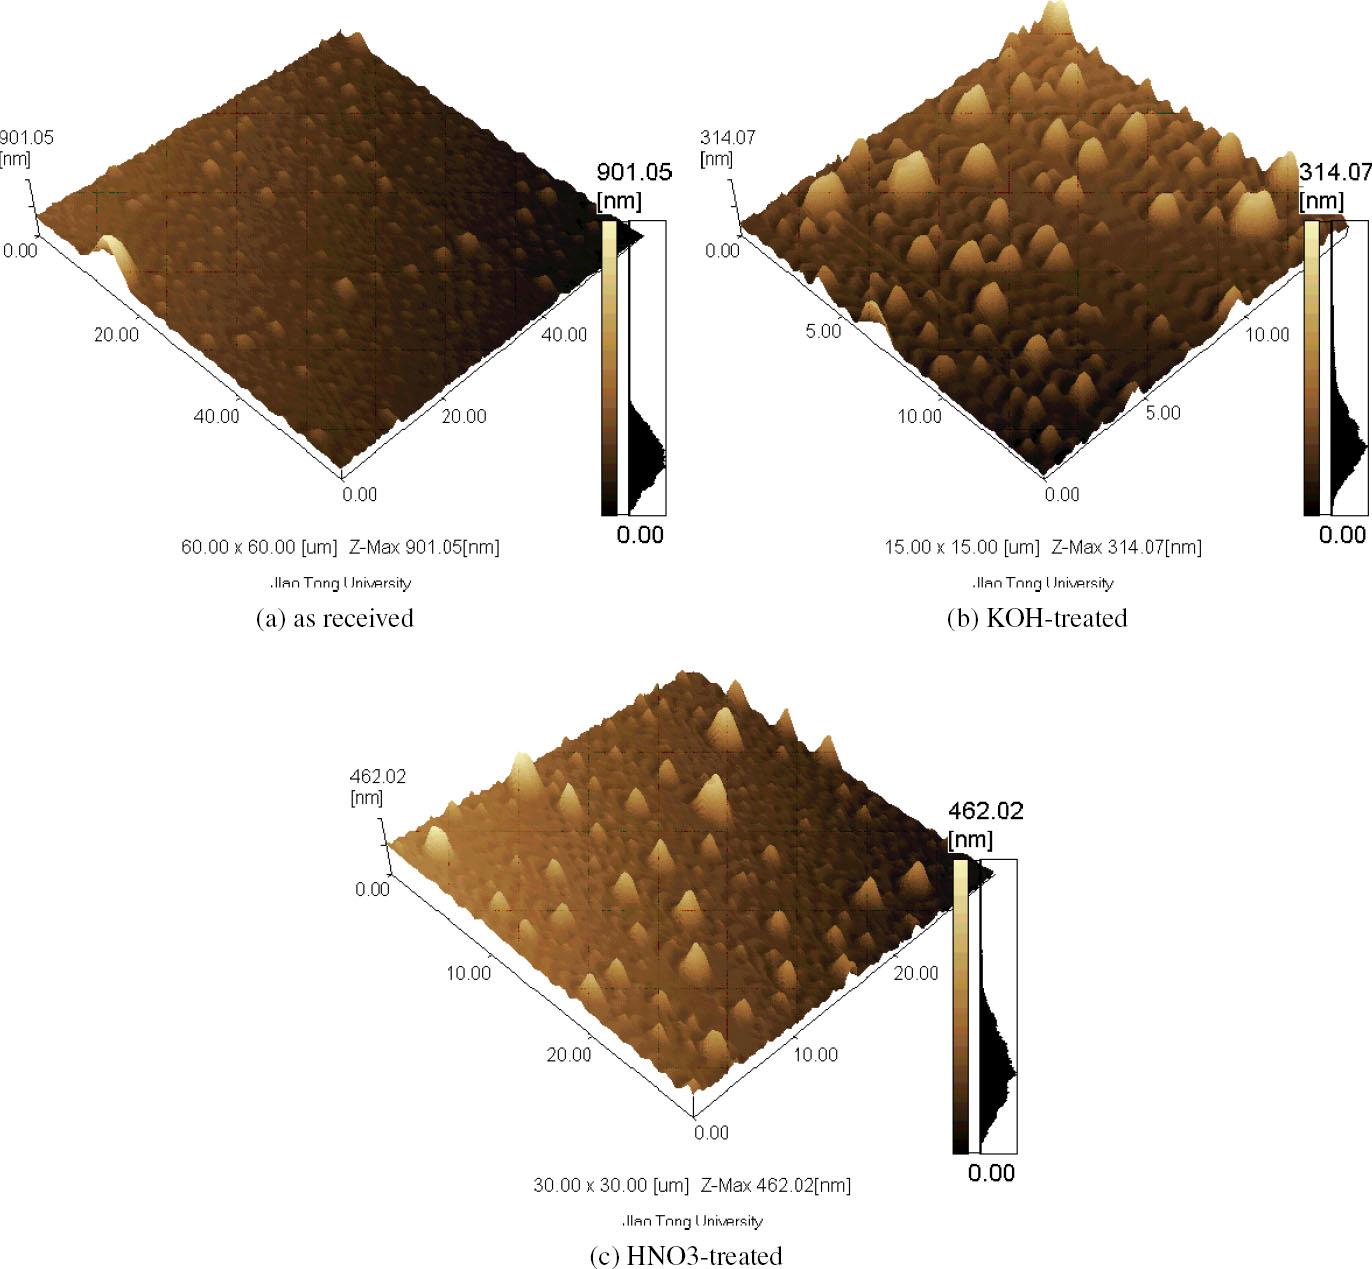
Fig. 3.
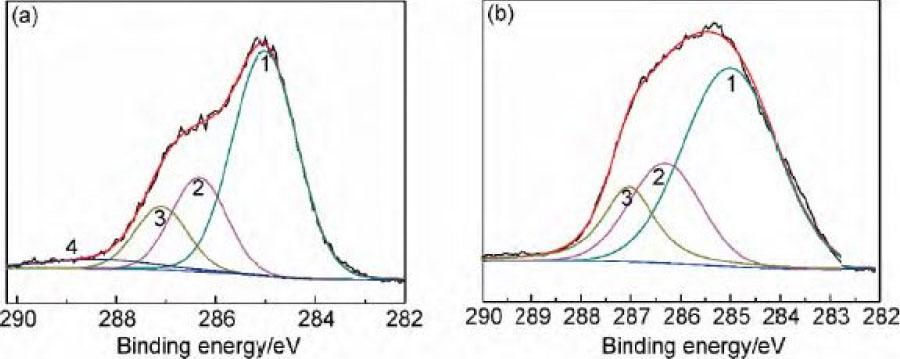
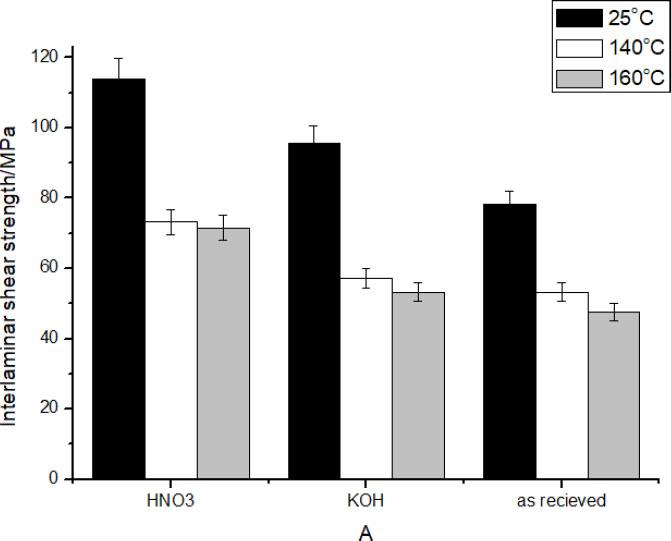
Fig. 4.
Surface compositions of carbon fibers
| Sample | Cls | Ols | Nls | Si2p | O/C | ||||
|---|---|---|---|---|---|---|---|---|---|
| Binding Energy /eV | Atom Fraction /% | Binding Energy /eV | Atom Fraction /% | Binding Energy /eV | Atom Fraction /% | Binding Energy /eV | Atom Fraction /% | ||
| HNO3 | 285.0 | 74.96 | 532.4 | 20.34 | 400.1 | 1.76 | 102.6 | 3.14 | 0.26 |
| KOH | 285.0 | 77.24 | 532.8 | 17.67 | 400.4 | 1.83 | 102.4 | 3.29 | 0.22 |
XPS Cls curve fitting results of carbon fibers
| Sample | C-C or C-H (Peak1) | C-OH or C-OR (Peak2) | C-O (Peak3) | COOH (Peak4) | Activated Carbon /% | ||||
|---|---|---|---|---|---|---|---|---|---|
| Binding Energy /eV | Atom Fraction /% | Binding Energy /eV | Atom Fraction /% | Binding Energy /eV | Atom Fraction /% | Binding Energy /eV | Atom Fraction /% | ||
| HNO3 | 285.0 | 61.61 | 286.3 | 21.67 | 287.2 | 12.13 | 288.7 | 4.18 | 39.54 |
| KOH | 285.0 | 59.58 | 286.3 | 24.28 | 287.2 | 16.46 | 40.32 | ||
Carbon fibers surface energies and contact angles in different liquids
| Sample | Contact angle/ | γ/(mJ·m^-2) | γ/(mJ·m^-2) | γ/(mJ·m^-2) | ||
|---|---|---|---|---|---|---|
| Deionized water | Ethylene glycol | Diiodomethane | ||||
| HNO3 | 57.3±1.2 | 42.7±0.9 | 28.1±1.1 | 29.5±0.7 | 16.9±0.8 | 44.6±1.4 |
| KOH | 55.4±1.1 | 43.9±0.8 | 27.3±1.0 | 28.4±0.6 | 17.6±0.5 | 46.3±1.6 |
| As received | 56.2±1.3 | 43.2±0.7 | 27.6±1.2 | 28.9±0.8 | 17.1±0.7 | 45.7±1.5 |