
Fig. 1.

Fig. 2.
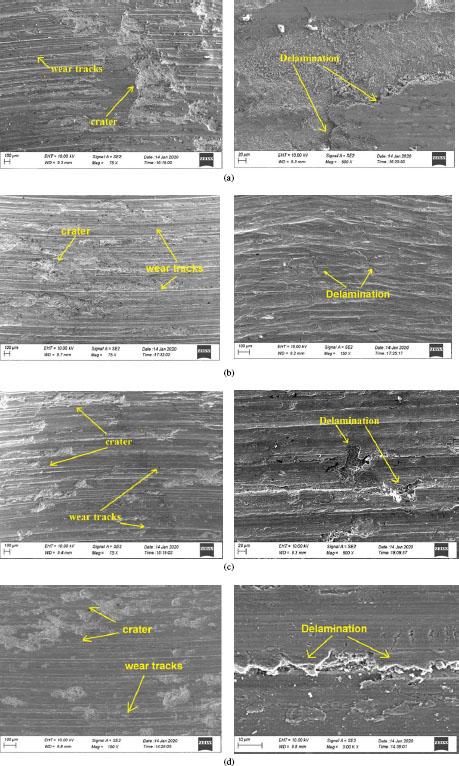
Fig. 3.
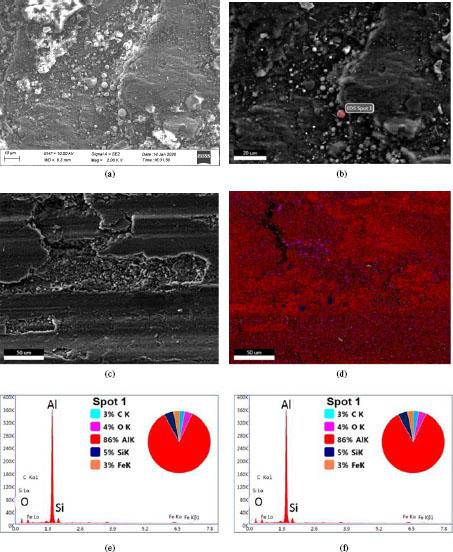
Fig. 4.
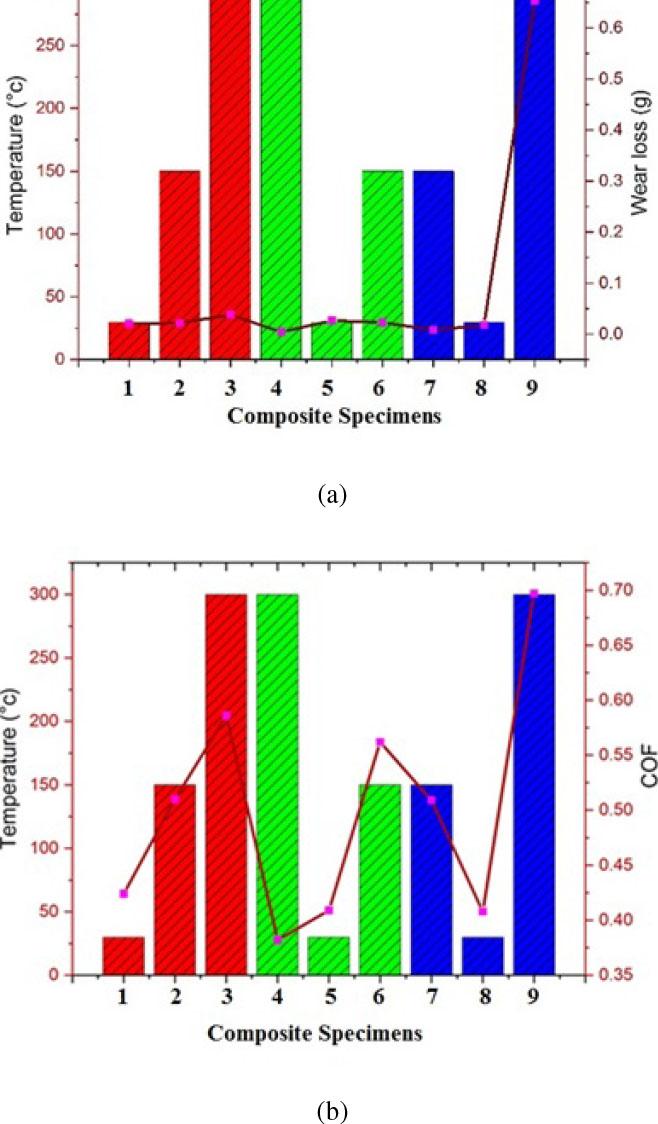
Fig. 5.
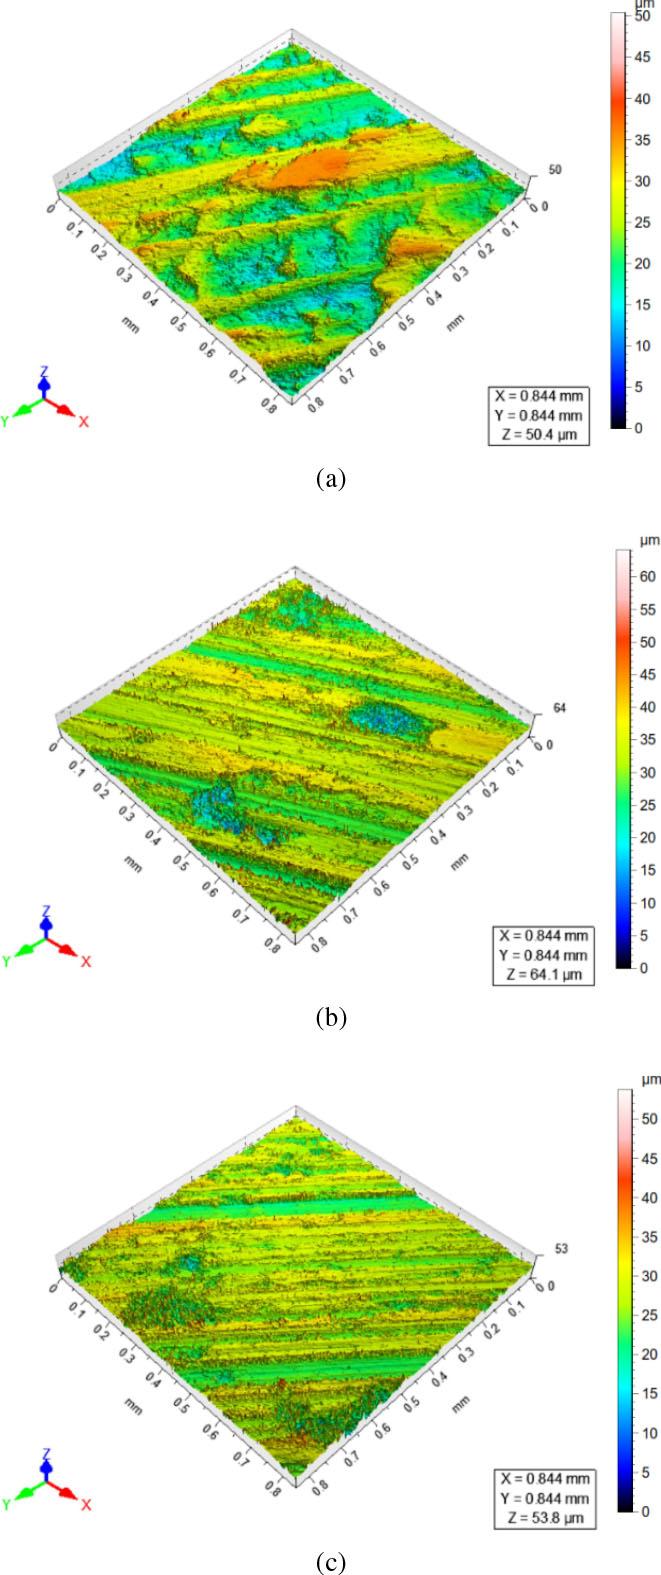
Fig. 6.
Control factors and their levels
| Factors | Level 1 | Level 2 | Level 3 |
|---|---|---|---|
| Composite | E8 (C1) | E9 (C2) | E2 (C3) |
| Sliding load (N) | 20 | 40 | 60 |
| Sliding velocity (m/s) | 1 | 2 | 3 |
| Temperature (C) | 30 | 150 | 300 |
Details of wear studies
| Parameters | Details |
|---|---|
| Wear test standard | ASTM-G99 |
| Pin material | Hybrid AMMC (SAAW with nano and micro Al2O3) |
| Disc material | Hard bearing steel EN31 Size: Dia: 100, Thickness: 8 mm; Initial roughness, Ra: |
| Load applied | 20, 40, & 60 N |
| Sliding velocity | 1-3 m/s |
| Test Duration | 1500 s |
| Sliding distance | 50-120mm |
| Temperature | 30, 150 & 300°C |
| Sliding condition | Dry |
L9 OA
| Exp. Numbers | Parameters | ||||
|---|---|---|---|---|---|
| Composite identification | Reinforcement (wt.%) | Sliding load (N) | Sliding velocity (m/s) | Temperature (°C) | |
| 1 | C1 | 1%: Nano Al2O3 5.5%: Micro Al2O3 | 20 | 1 | 30 |
| 2 | C1 | 40 | 2 | 150 | |
| 3 | C1 | 60 | 3 | 300 | |
| 4 | C2 | 2%: Nano Al2O3 7%: Micro Al2O3 | 20 | 2 | 300 |
| 5 | C2 | 40 | 3 | 30 | |
| 6 | C2 | 60 | 1 | 150 | |
| 7 | C3 | 2%: Nano Al2O3 5.5%: Micro Al2O3 | 20 | 3 | 150 |
| 8 | C3 | 40 | 1 | 30 | |
| 9 | C3 | 60 | 2 | 300 | |
TOPSIS ranking
| Si + | Si − | Pi (Pref.value) | TOPSIS Ranking |
|---|---|---|---|
| 0.0603 | 0.1975 | 0.6490 | 4 |
| 0.0748 | 0.1383 | 0.6251 | 5 |
| 0.1295 | 0.0857 | 0.3982 | 8 |
| 0.0867 | 0.1445 | 0.8052 | 1 |
| 0.1281 | 0.0871 | 0.4047 | 7 |
| 0.1995 | 0.0405 | 0.1687 | 9 |
| 0.0443 | 0.1829 | 0.7661 | 2 |
| 0.0654 | 0.1820 | 0.7358 | 3 |
| 0.3377 | 0.3590 | 0.5153 | 6 |
Test results of output performance
| Expt No | Composite identification | COF | Wear (gms) | Surface roughness Ra (μm) | STDEV of COF | STDEV of Wear (gms) |
|---|---|---|---|---|---|---|
| 1 | C1 | 0.424 | 0.02063 | 0.910 | 0.0071 | 0.0003 |
| 2 | C1 | 0.51 | 0.02197 | 1.852 | 0.0141 | 0.0007 |
| 3 | C1 | 0.586 | 0.03795 | 3.279 | 0.0184 | 0.0014 |
| 4 | C2 | 0.382 | 0.00402 | 0.322 | 0.0141 | 0.0007 |
| 5 | C2 | 0.409 | 0.02665 | 2.944 | 0.0049 | 0.0017 |
| 6 | C2 | 0.562 | 0.02274 | 4.863 | 0.0141 | 0.0007 |
| 7 | C3 | 0.509 | 0.00804 | 0.405 | 0.0064 | 0.0007 |
| 8 | C3 | 0.408 | 0.0174 | 0.604 | 0.0071 | 0.0000 |
| 9 | C3 | 0.697 | 0.65243 | 2.098 | 0.0028 | 0.0356 |
ANOVA table
| Symbol | Factors | df | SS | MS | F | % contribution |
|---|---|---|---|---|---|---|
| A | Reinforcement (wt. %) | 2 | 0.0681 | 0.0341 | 0.1065 | 19.4063 |
| B | Sliding load (N) | 2 | 0.2188 | 0.1094 | 0.3421 | 62.3338 |
| C | Sliding velocity (m/s) | 2 | 0.0329 | 0.0164 | 0.0514 | 9.3644 |
| D | Temperature (deg.C) | 2 | 0.0312 | 0.0156 | 0.0488 | 8.8955 |
| E | Error | 1 | 0.3198 | 0.3198 | 0.0000 | |
| Total | 9 | 0.6708 | 0.0745 | 100 |
Normalised values of output performance
| Normalized data | Positive Matrix | Negative Matrix | ||||||
|---|---|---|---|---|---|---|---|---|
| 0.2781 | 0.0315 | 0.0635 | 0.1524 | 0.0020 | 0.0212 | 0.0835 | 0.0020 | 0.2182 |
| 0.3346 | 0.0335 | 0.2493 | 0.1524 | 0.0020 | 0.0212 | 0.0835 | 0.0020 | 0.2182 |
| 0.3844 | 0.0579 | 0.4414 | 0.1524 | 0.0020 | 0.0212 | 0.0835 | 0.0020 | 0.2182 |
| 0.2506 | 0.0061 | 0.2212 | 0.1524 | 0.0020 | 0.0212 | 0.0835 | 0.0020 | 0.2182 |
| 0.2683 | 0.0407 | 0.3963 | 0.1524 | 0.0020 | 0.0212 | 0.0835 | 0.0020 | 0.2182 |
| 0.3687 | 0.0347 | 0.6547 | 0.1524 | 0.0020 | 0.0212 | 0.0835 | 0.0020 | 0.2182 |
| 0.3339 | 0.0123 | 0.1123 | 0.1524 | 0.0020 | 0.0212 | 0.0835 | 0.0020 | 0.2182 |
| 0.2677 | 0.0265 | 0.1092 | 0.1524 | 0.0020 | 0.0212 | 0.0835 | 0.0020 | 0.2182 |
| 0.4572 | 0.9954 | 0.2824 | 0.1524 | 0.0020 | 0.0212 | 0.0835 | 0.0020 | 0.2182 |