
Fig. 1.
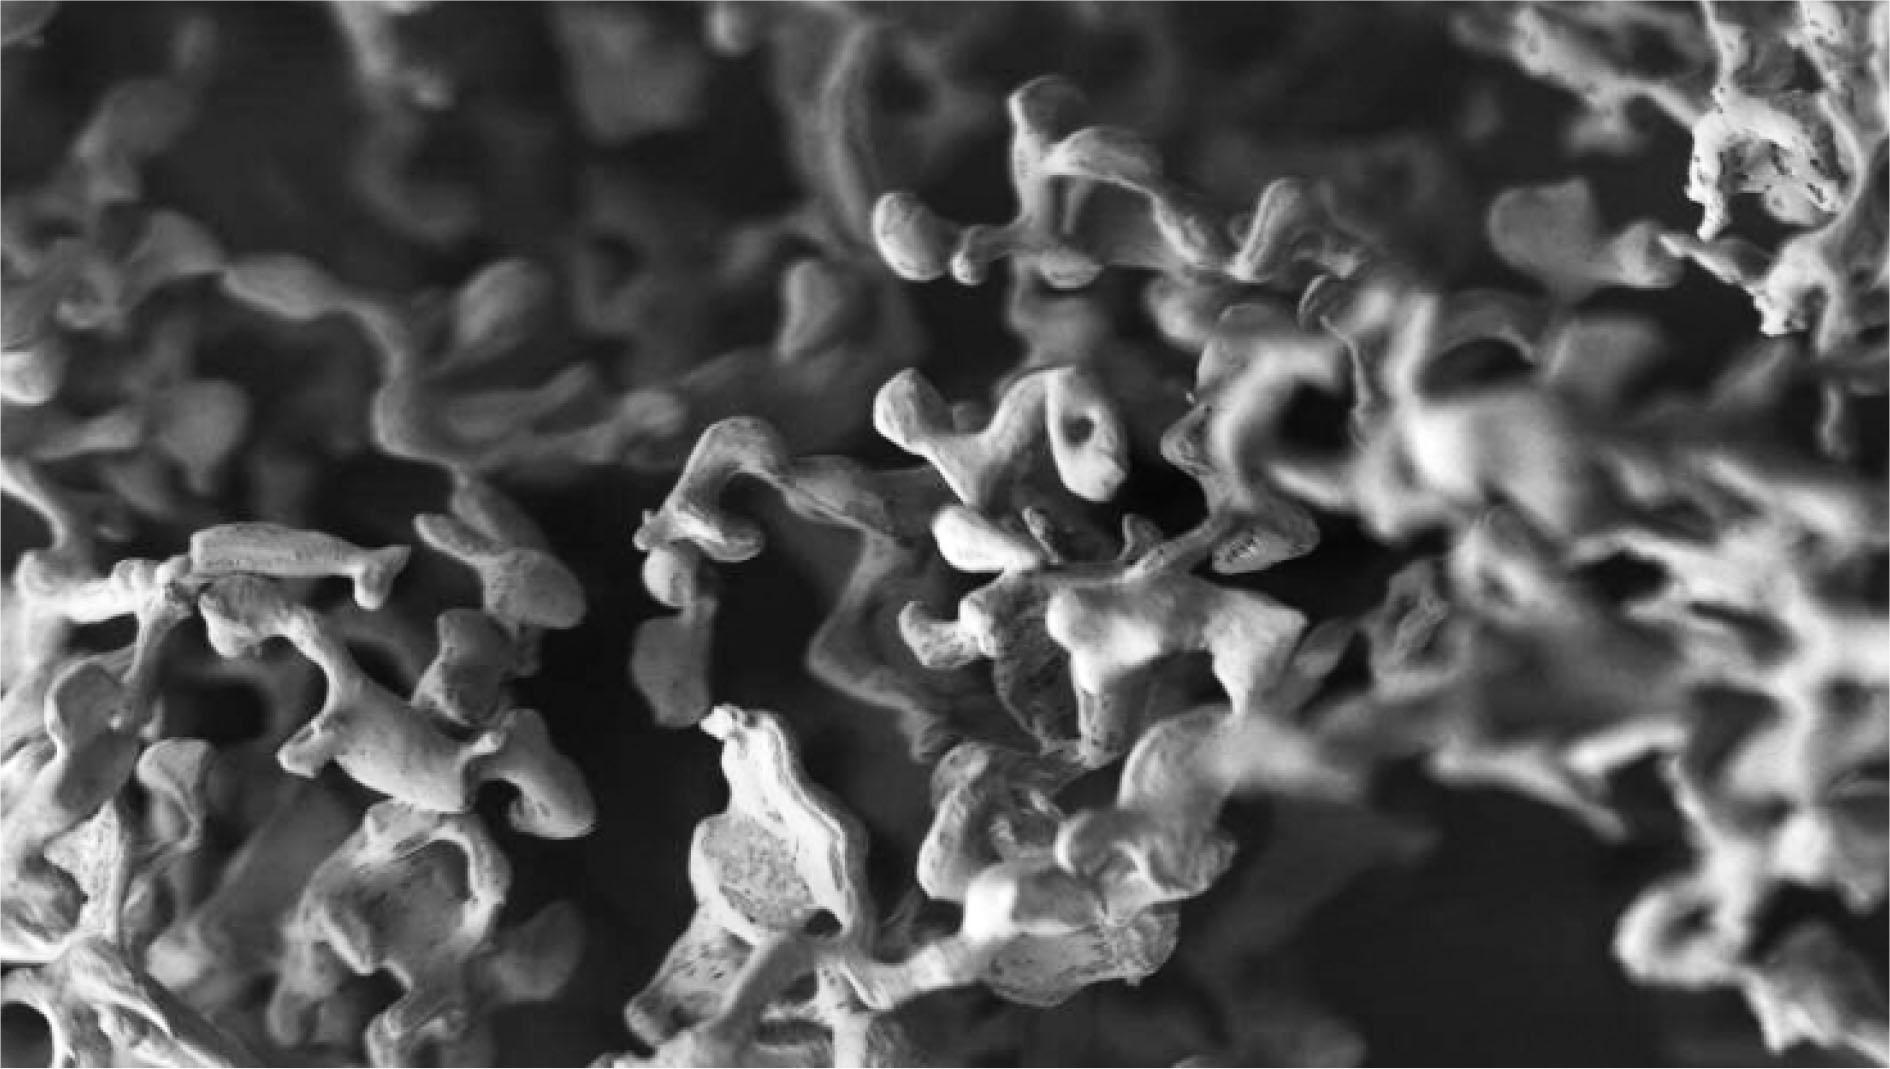
Fig. 2.
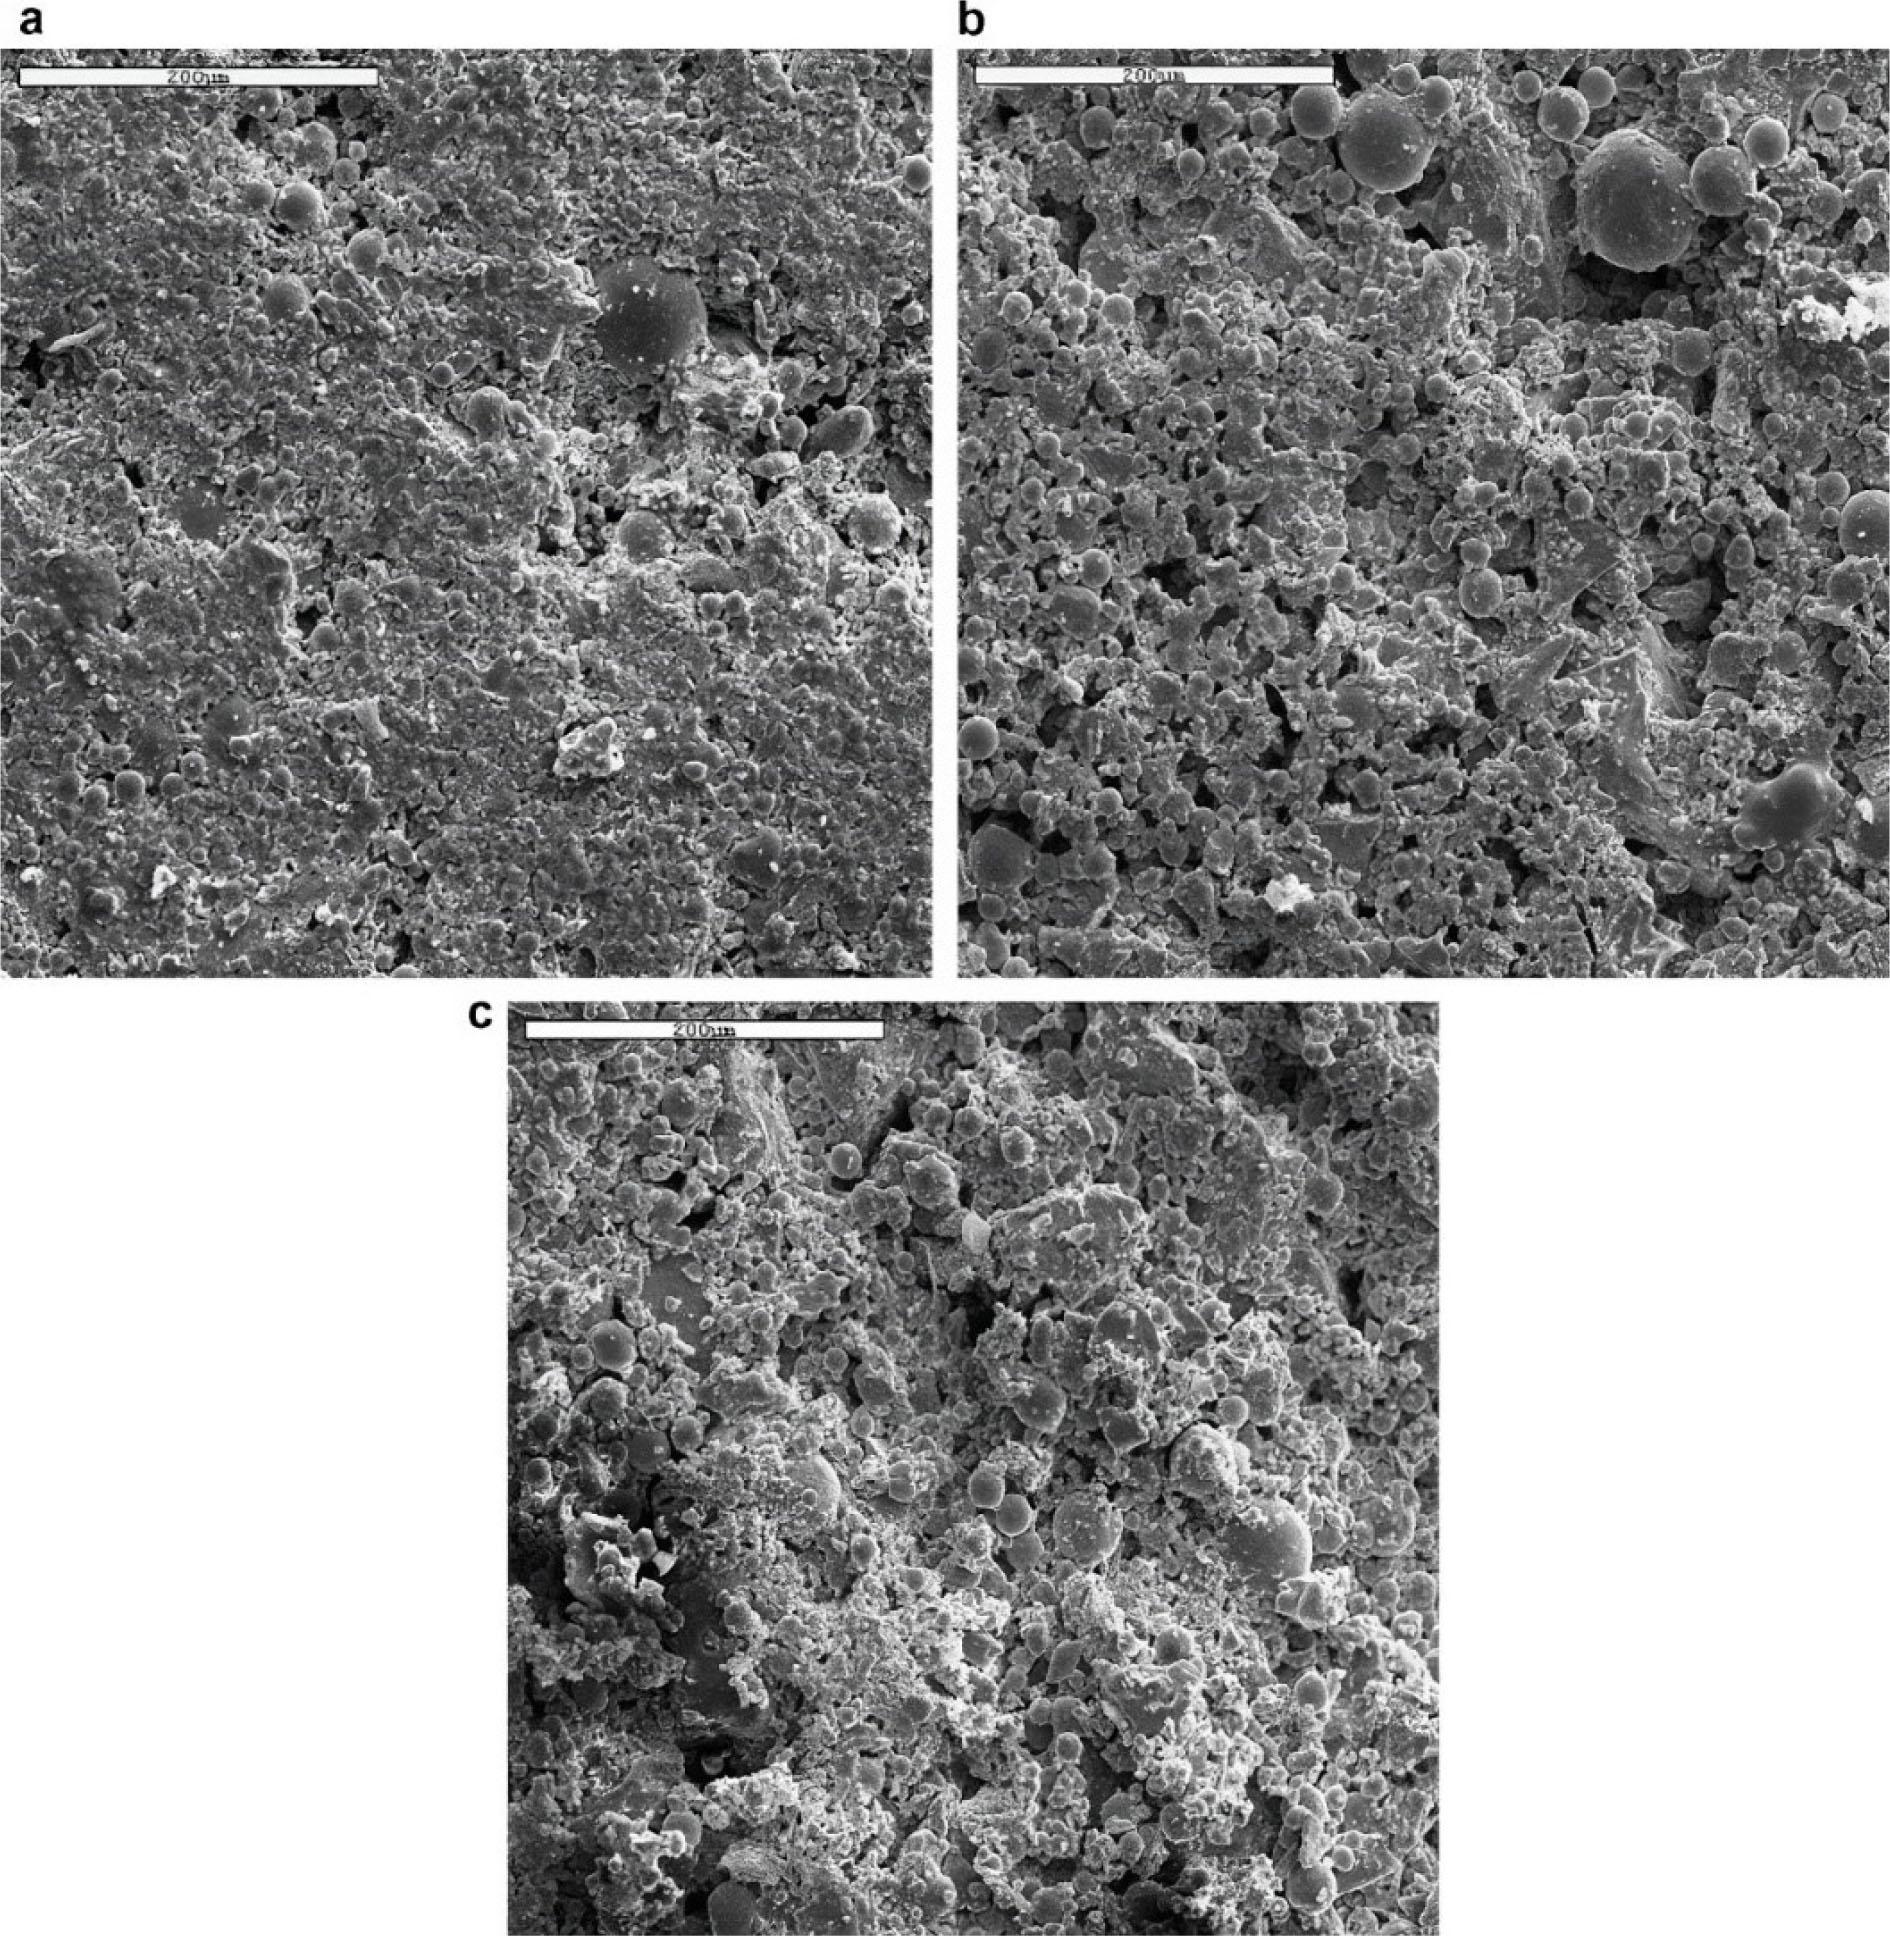
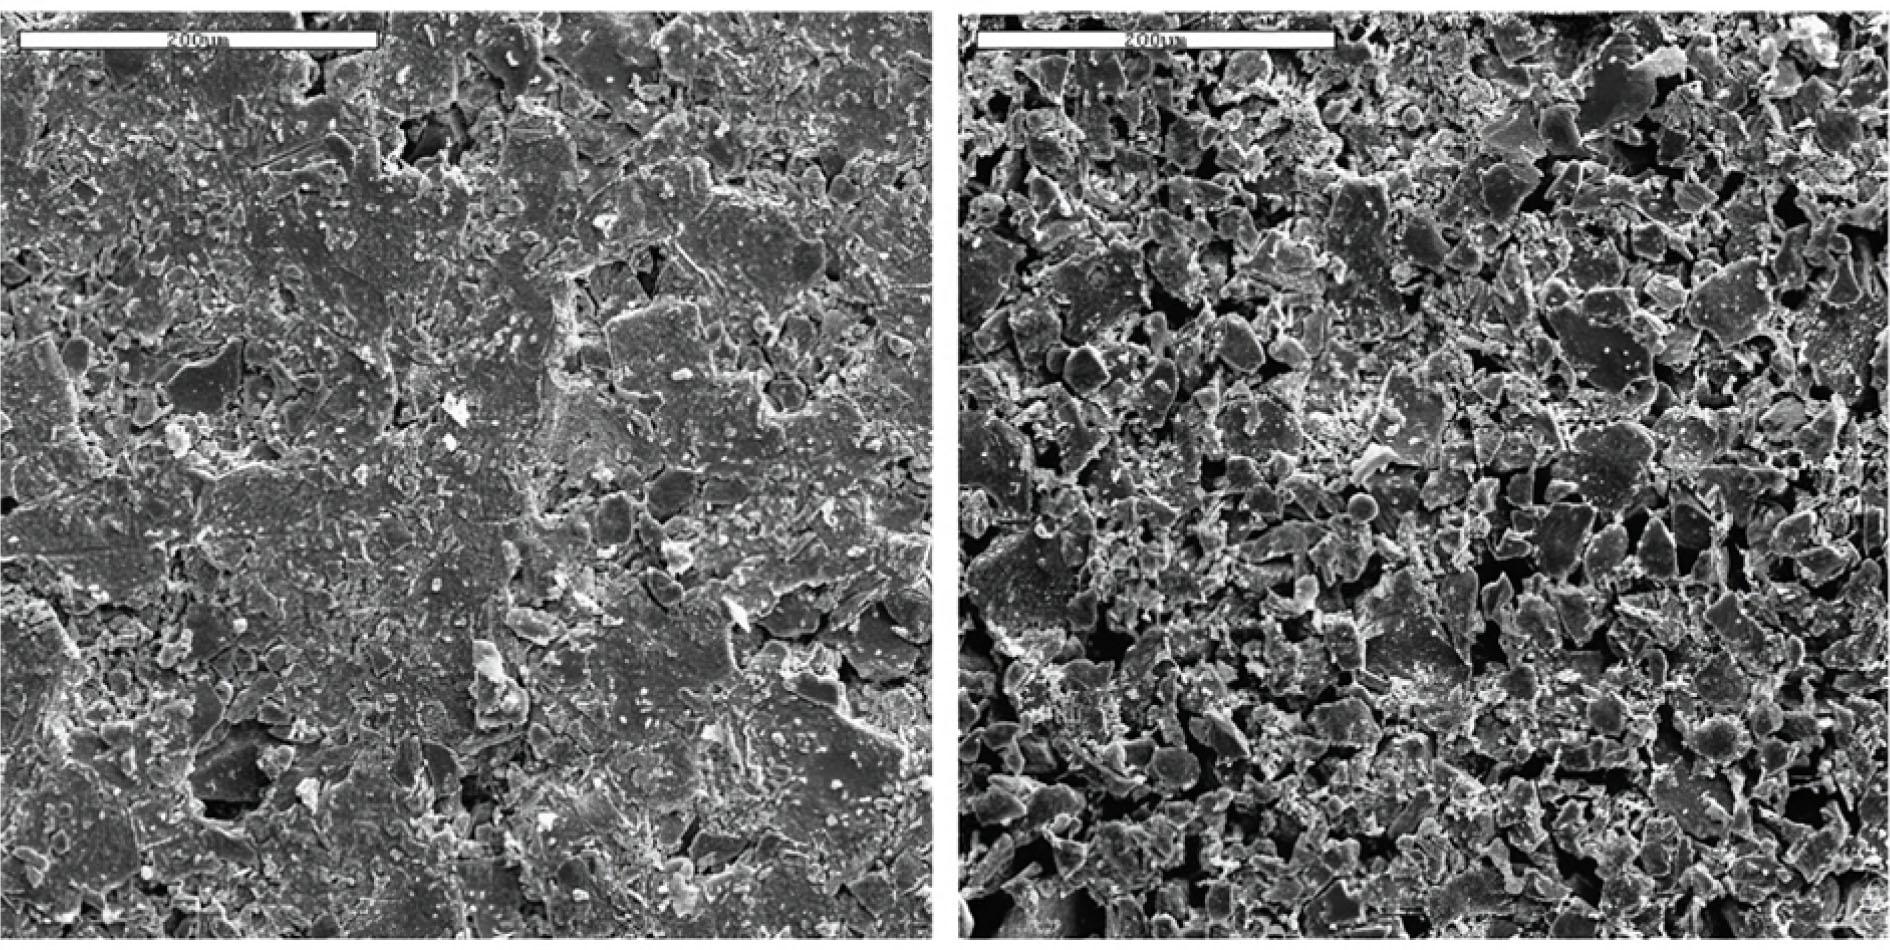
Fig. 3.
Grain composition of crushed stone and sand
| Material name | Total residues on sieves. % Sieves. mm | ||||||||||
|---|---|---|---|---|---|---|---|---|---|---|---|
| 40 | 30 20 | 10 | 5 (3) | 2.5 | 1.25 | 0.63 | 0.315 | 0.14 | <0.14 | ||
| Crushed stone | 0.5 | 10 | 30–60 | 60–85 | 90–100 | ||||||
| Tailing sand | 2 | 10 | 35 | 40 | 50 | 100 | |||||
| Sand from crushed slag | 7–22 | 20–55 | 70–90 | - | 92–99 | <8% | |||||
| Sand from non-crushed slag | 0–2 | 0–15 | 40–50 | 75–90 | 90–97 | 100 | |||||
| Sand from the ashes of the thermal power plant | 0–4 | 0–6 | 2–53 | 10–38 | 100 | ||||||
Test results of selected formulations
| Mixture | Composition of components. % | Strength. MPa | Water absorption. % | Frost. cycles | ||
|---|---|---|---|---|---|---|
| Mod. Sulfur binder | Basalt screenings | Slag sands | ||||
| SB1 | 100.0 | - | - | 58.0 | 0.06 | 400 |
| SB 2 | 26.8 | 46.4 | 26.8 | 62.1 | 0.08 | 400 |
| SB 3 | 27.2 | 46.4 | 26.4 | 63.3 | 0.08 | 400 |
| SB 4 | 27.6 | 46.4 | 26.0 | 63.7 | 0.08 | 400 |
| SB 5 | 28.0 | 46.4 | 25.6 | 64.3 | 0.08 | 400 |
| SB 6 | 28.4 | 46.4 | 25.2 | 65.3 | 0.07 | 500 |
| SB 7 | 28.8 | 46.4 | 24.8 | 66.1 | 0.07 | 500 |
| SB 8 | 29.2 | 46.4 | 24.4 | 66.6 | 0.07 | 500 |
| SB 9 | 29.6 | 46.4 | 24.0 | 67.1 | 0.07 | 500 |
| SB 10 | 30.0 | 46.4 | 23.6 | 67.1 | 0.06 | 500 |
| SB U | 30.4 | 46.4 | 23.2 | 67.0 | 0.06 | 500 |
| SB 11 | 30.8 | 46.4 | 22.8 | 67.0 | 0.06 | 500 |
| SB 12 | 30.8 | 46.4 | 22.8 | 67.0 | 0.06 | 500 |
| SB 13 | 31.2 | 46.4 | 22.4 | 67.0 | 0.07 | 500 |
| SB 14 | 31.6 | 46.4 | 22.0 | 66.5 | 0.07 | 500 |
| SB N | 32.0 | 46.4 | 21.6 | 65.8 | 0.07 | 400 |
| SB.b | 32.4 | 46.4 | 21.2 | 64.2 | 0.07 | 400 |
| SB 17 | 32.8 | 46.4 | 20.8 | 63.5 | 0.06 | 400 |
| SB 18 | 33.2 | 46.4 | 20.4 | 62.0 | 0.06 | 400 |
| SB 19 | 33.6 | 46.4 | 20.0 | 62.0 | 0.06 | 400 |
Sulfur in gases of metallurgical production
| Indicator | Amount |
|---|---|
| Sulfur content, %, not less than | 99.2 |
| Ash content, incl. Fe, Mg, Cu, %, max | 0.4 |
| Acidity in terms of H2SO4H2SO4 | 0.02 |
| Content of organic substances, %, no more | 0.5 |
| Moisture content, %, no more | 1.0 |
| Melting point, °C | 112.8 |
| Density of molten sulfur, g/cm3 | 1.8 |
| Density of solid sulfur at 20° C, g/cm3 | |
| rhombic | 2.07 |
| monoclinic | 2.06 |
| amorphous | 2.02 |
| Boiling temperature, °C | 444.6 |
| Flash point, °C | 250 |
Change in the strength of samples during testing according to the standard method
| No | Composition of sulfur concrete | Freezing temperature | Sample thawing environment | Water resistance coefficient after test cycles Kst | ||||
|---|---|---|---|---|---|---|---|---|
| 50 | 100 | 200 | 300 | 500 | ||||
| 1 | Compound A and B | −50°C | Water | 0.98 | 0.96 | 0.95 | 0.92 | 0.68 |
| 2 | Compound B | 0.90 | 0.88 | 0.85 | 0.60 | 0.42 | ||
Chemical composition of the slag in percent
| SiO2 | Al2O3 | Fe2O3 | CaO | MgO | SiO3 |
|---|---|---|---|---|---|
| 33.67 | 4.00 | 56.6 | 2.4 | 0.5 | 2.8 |
Approximate composition of asphalt concrete
| Nomination | Compound, % by weight | |||
|---|---|---|---|---|
| Bitumen, on top of mineral particles | Filler | Bitumen, on top of mineral particles | Crashed stone | |
| Asphalt concrete | 7–9 | Asphalt concrete | 7–9 | Asphalt concrete |
Optimal composition selection
| Optimal composition of sulfur structural concrete | Wt.% | |
|---|---|---|
| Technical sulfur | 18.6 | 18.6 |
| Crushed stone basalt fraction | 46.4 | 46.4 |
| Sand slag fineness module (2.9–3.2) | 23 | 23 |
| Tailings of metallurgical production | 11 | |
| Nickel plant cakes | 11 | |
| Dicyclopentadiene (% by mass sulfur) | 5 | 5 |
The influence of bitumen additives on the physical and mechanical properties of black compositions on fine-grained and coarse-grained aggregates on unmodified sulfur binder
| Sample number | B-1 | B-2 | B-3 | B-4 | B-5 | B-6 | B-7 | B-8 | B-9 | B-10 |
|---|---|---|---|---|---|---|---|---|---|---|
| Bitumen content. % (by weight of sulfur) | 0 | 0.5 | 1 | 2 | 3 | 5 | 10 | 20 | 30 | 50 |
| Compressive strength Rst. | ||||||||||
| Mpa | 22.6 | 21.3 | 20.7 | 17.6 | 11.8 | 8.7 | 6.3 | 5.3 | 4.2 | 3.0 |
Significance of temperature transitions in iron cakes
| Temperature, °C | J/g |
|---|---|
| 76 | 14.9 |
| 278 | 195 |
| 411 | 409 |
| 503 | 17.7 |
Sand based on granular slag
| Indicators | Value |
|---|---|
| True density, not more than kg/m3 | 2800 |
| Average density, kg/m3 | 1650–1950 |
| Size modulus mm | 2.5–3.6 |
| Granules 5–10 mm, % | <6 |
| Granules >10 mm, % | <4 |
| Natural background radiation, not more than, Bq/kg | 370 |
Dependence of the decrease in the strength of sulfur concrete on water absorption
| Compound | Filler | Rct, Mpa | W, % (30 days) | Water resistance coefficient | ||
|---|---|---|---|---|---|---|
| No | % | Before diving into the water | After immersion in water | |||
| 1 | 13 | “tailings” | 51.8 | 41.4 | 0.4 | 0.80 |
| 2 | 15 | “tailings” | 58.9 | 53.0 | 0.3 | 0.90 |
| 3 | 19 | “tailings” | 67.1 | 63.7 | 0.23 | 0.95 |
| cakes | 67.8 | 64.4 | 0.021 | 0.95 | ||
Chemical composition of mountain rocks
| Rock | Chemical composition | |||||||||||
|---|---|---|---|---|---|---|---|---|---|---|---|---|
| SiO2 | TiO2 | Al2O3 | Fe2O3 | Cl2O | FeO | MgO | MnO | CaO | Na2O | K2O | SO3 | |
| Dolerites | 51.61 | 1.64 | 14.98 | 3.57 | - | 5.92 | 0.65 | 0.18 | 9.15 | 3.26 | 1.1 | - |
| Gabbro-dolerites | 41.85 | 0.86 | 14.7 | 5.22 | 0.03 | 9.72 | 9.5 | 0.16 | 10.4 | 1.6 | 0.69 | 0.57 |
| Basalts | 51.63 | 0.83 | 15.32 | 4.21 | 0.01 | 4.72 | 6.09 | 0.15 | 8.32 | 3.0 | 1.9 | 0.01 |
| Gabbro | 34.62 | 0.8 | 9.27 | 14.21 | 0.43 | 6.1 | 2.34 | 0.11 | 12.3 | 0.44 | 0.19 | - |
| Andesitic basalt | 45.1 | 1.05 | 16.5 | 5.92 | 0.06 | 8.14 | 4.93 | 0.14 | 8.41 | 2.68 | 0.93 | 0.42 |
| Granite-porphyry | 67.2 | 0.42 | 14.63 | 1.25 | - | 2.24 | 1.91 | 0.04 | 2.14 | 3.24 | 4.98 | 0.04 |
| Silica-alumina corneas | 46.34 | 0.9 | 15.48 | 2.05 | 0.01 | 5.03 | 0.91 | 0.39 | 10.9 | 1.35 | 2.9 | 0.35 |
| Chalk-stone | 3.72 | - | 115 | - | - | 0.5 | 2.01 | - | 50.9 | 2.4 | 0.12 | |
Change in the strength of specimens during testing by the accelerated method
| No | Composition of sulfur concrete | Freezing temperature | Sample thawing environment | Water resistance coefficient after test cycles | |||
|---|---|---|---|---|---|---|---|
| 50 | 100 | 200 | 300 | ||||
| 1 | Compound A | −50°C | Water | 0.98 | 0.95 | 0.90 | 0.87 |
| 2 | Compound B | 0.98 | 0.96 | 0.91 | 0.86 | ||
| 3 | Compound B | 0.80 | 0.77 | 0.71 | 0.68 | ||
| 4 | Compound A | −50°C | Air | 0.98 | 0.97 | 0.83 | 0.89 |
| 5 | Compound B | 0.98 | 0.96 | 0.93 | 0.87 | ||