
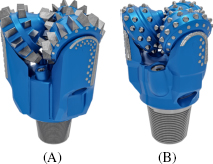
Fig. 1.
Types of roller cone bits: (a) milled-tooth bits, (b) insert-tooth bits – Glinik Drilling Tools product catalog [2]
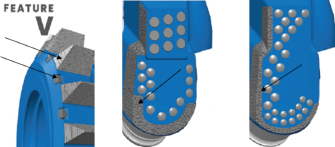
Fig. 2.
Different types of teeth and arms reinforcements [2]. The arrows mark the locations of the overlays
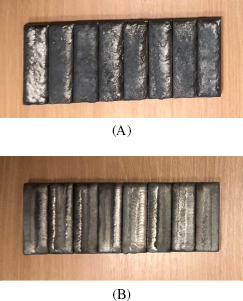
Fig. 3.
The samples submitted for testing by Glinik Drilling Tool: (a) gas welding; (b) plasma transferred arc welding
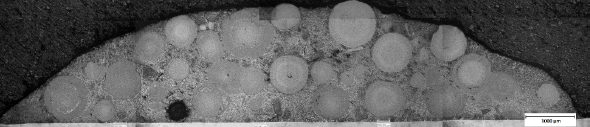
Fig. 4.
Cross-section of the coating made by the gas weld surfacing
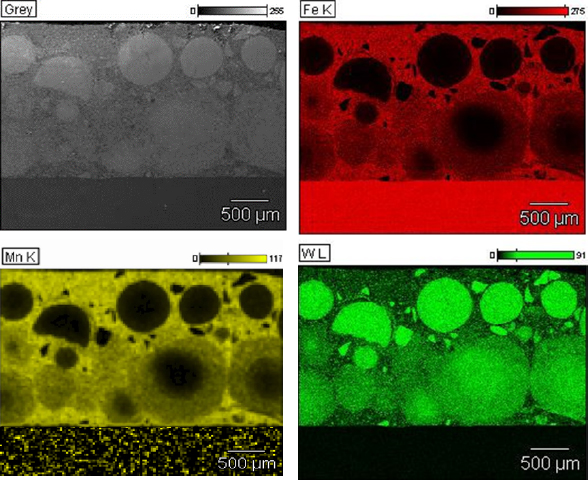
Fig. 5.
Mapping of key elements of the gas weld surfacing layer
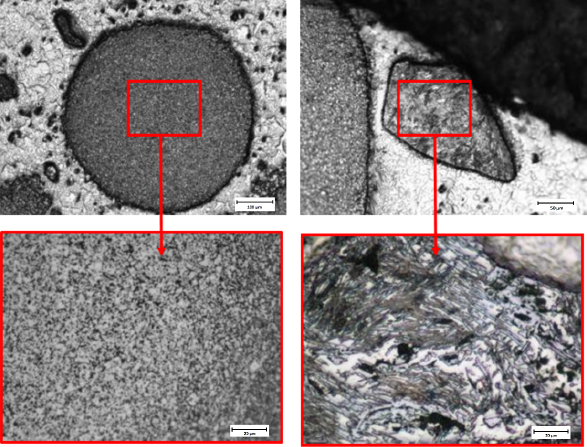
Fig. 6.
Spherical and polyhedral particles in the gas weld surfacing
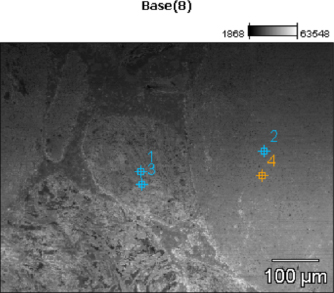
Fig. 7.
SEM micrographs of overlay made by gas welding surface with EDS spot analysis
Table 1.
EDS spot analysis of the areas in Figure 7 (weight %)
| C-K | Fe-K | Ni-K | Co-L | W-M | |
|---|---|---|---|---|---|
| Base(8)_pt1 | 2.2 | 2.6 | 0.8 | 94.4 | |
| Base(8)_pt2 | 3.5 | 1.6 | 0.2 | 94.7 | |
| Base(8)_pt3 | 1.8 | 3.5 | 0.3 | 94.4 | |
| Base(8)_pt4 | 2.9 | 2.2 | 0.6 | 94.3 |

Fig. 8.
Cross-section of the coating made by the PTA weld surfacing
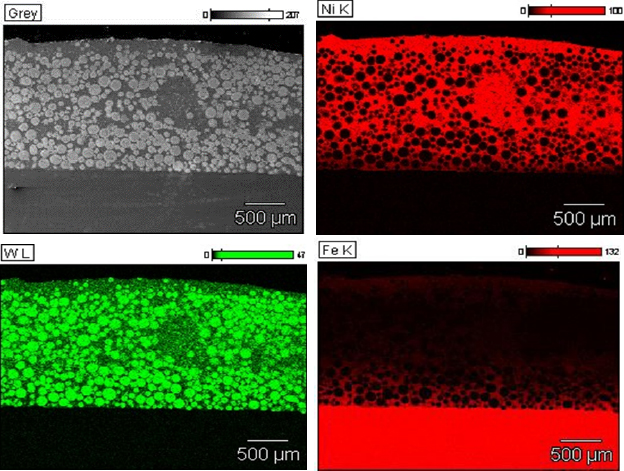
Fig. 9.
Mapping of key elements of the PTA weld surfacing layer
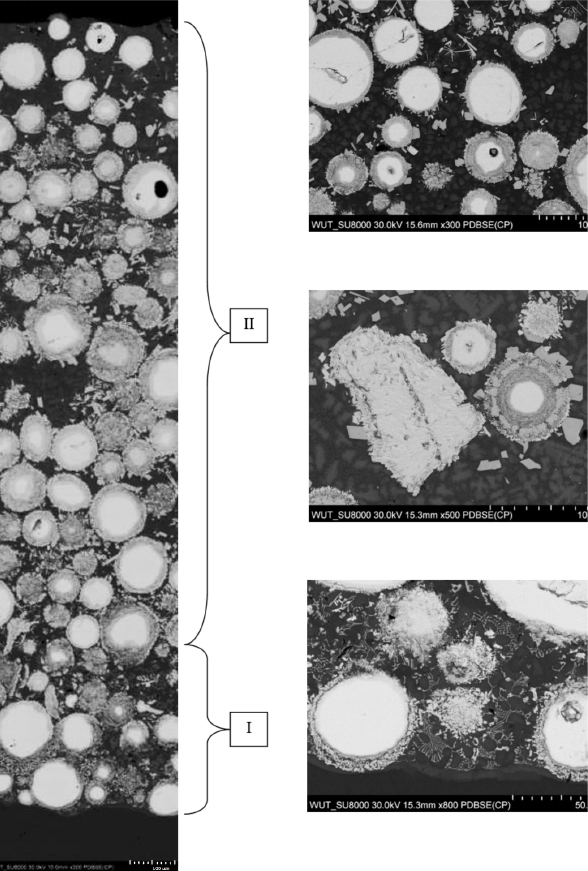
Fig. 10.
The microstructure of the coating is made by PTA weld surfacing with the distinction of three zones occurring in the layer
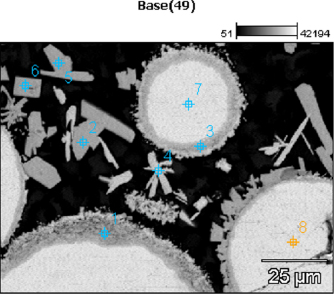
Fig. 11.
SEM micrographs of overlay made by PTA surface with EDS spot analysis
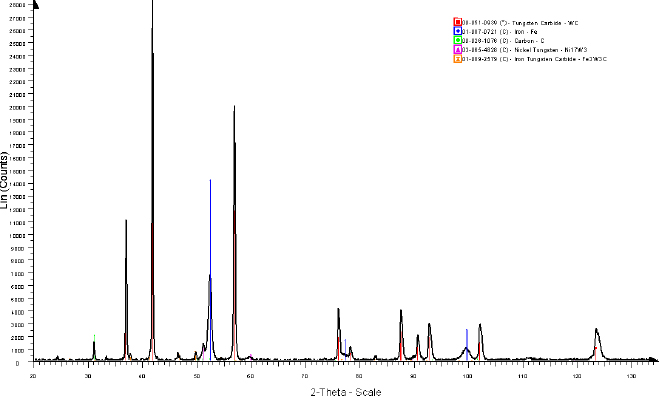
Fig. 12.
Results of XRD analyses on sample cross-section made by gas weld surfacing
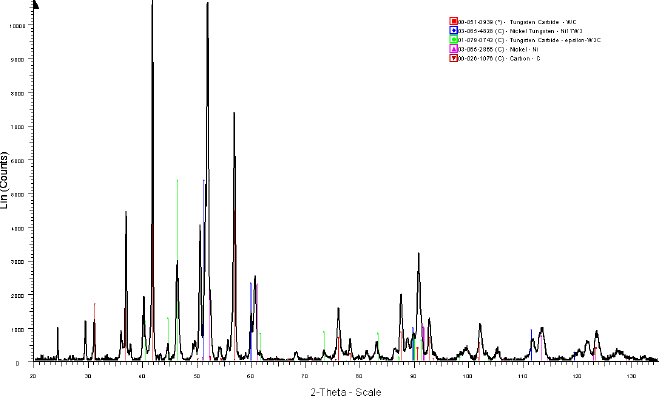
Fig. 13.
Results of XRD analyses on sample cross-section made by PTA
Table 2.
EDS spot analysis of the areas in Figure 11(weight %)
| C-K | Cr-K | Fe-K | Ni-K | W-L | |
|---|---|---|---|---|---|
| Base(49)pt1 | 6.6 | 0.3 | 1.5 | 18.4 | 73.2 |
| Base(49)_pt2 | 3.6 | 0.2 | 0.9 | 13.8 | 81.6 |
| Base(49)_pt3 | 5.9 | 0.2 | 0.7 | 8.8 | 84.5 |
| Base(49)_pt4 | 4.3 | 0.2 | 0.9 | 12.6 | 81.9 |
| Base(49)_pt5 | 3.8 | 0.3 | 1.1 | 14.9 | 79.9 |
| Base(49)_pt6 | 3.7 | 0.2 | 0.9 | 16.0 | 79.2 |
| Base(49)_pt7 | 5.4 | 0.1 | 94.3 | ||
| Base(49)_pt8 | 5.4 | 0.2 | 88.9 |
Table 3.
HV 0.1 microhardness measurements
| Basis (steel) | Matrix | Strengthening phase | |
|---|---|---|---|
| Gas Welding | |||
| average | 567.0 | 1028.2 | 1699.8 |
| SD | 23.6 | 60.6 | 245.4 |
| PTA | |||
| average | 352.6 | 714.2 | 3707.6 |
| SD | 26.7 | 162.4 | 237.2 |
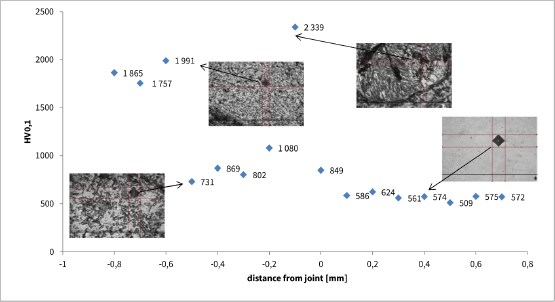
Fig. 14.
Microhardness distribution on sample cross-section made by gas weld surfacing (0mm-joint)
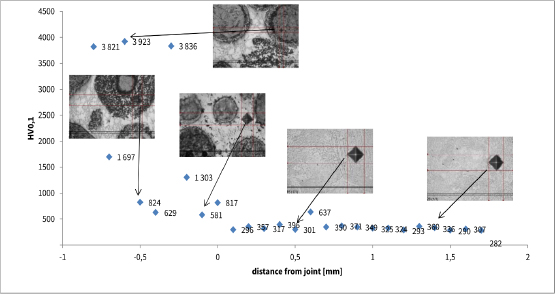
Fig. 15.
Microhardness distribution on sample cross-section made by PTA weld surfacing (0mm-joint)
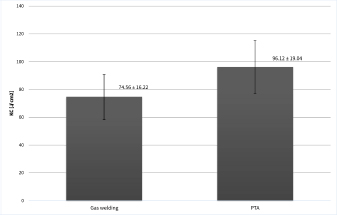
Fig. 16.
Comparison of the impact test results of samples made by Gas welding and PTA
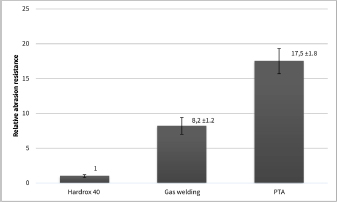
Fig. 17.
Comparison of the relative abrasion resistance of samples made by gas welding and PTA