
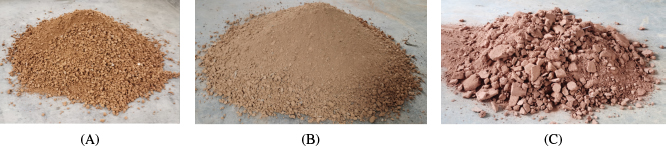
Fig. 1.
Appearance of different excavated soils
Table 1.
Physical characteristics of engineering excavated soil
| Type | Water content (%) | Density (g/cm3) | Liquid limit (%) | Plastic limit (%) | Plasticity index (%) |
|---|---|---|---|---|---|
| A | 28.8 | 1.94 | 39.9 | 21.7 | 18.2 |
| B | 23.2 | 1.98 | 38.9 | 20.9 | 18.0 |
| C | 26.6 | 1.95 | 35.3 | 20.6 | 14.7 |
Table 2.
Chemical composition of cement (wt%)
| Materials | CaO | SiO2 | Al2O3 | Fe2O3 | MgO | SO3 | Alkali content | Loss |
|---|---|---|---|---|---|---|---|---|
| Cement | 59.09 | 22.82 | 6.98 | 2.25 | 2.33 | 2.27 | 0.70 | 3.08 |
Table 3.
Basic properties of fly ash
| Fineness (%) | Chloride ion content (%) | Water demand ratio (%) | Loss on ignition (%) | Sulfur trioxide (%) | Water content (%) |
|---|---|---|---|---|---|
| 19.8 | 0.014 | 102 | 2.38 | 0.79 | 0.11 |
Table 4.
Mixing ratio of the fluidized solidified soil
| Number | Type of soil | Soil (kg) | Cement (kg) | Fly ash (kg) | Quicklime (kg) | Water (kg) | Slump (kg) |
|---|---|---|---|---|---|---|---|
| A-1 | A | 800 | 60 | 60 | 0 | 736 | 240 |
| A-2 | A | 800 | 60 | 45 | 15 | 736 | 235 |
| A-3 | A | 800 | 60 | 30 | 30 | 736 | 220 |
| A-4 | A | 800 | 60 | 15 | 45 | 736 | 190 |
| A-5 | A | 800 | 60 | 0 | 60 | 736 | 180 |
| B-1 | B | 800 | 60 | 20 | 30 | 400 | 220 |
| C-1 | C | 800 | 60 | 30 | 30 | 294 | 220 |
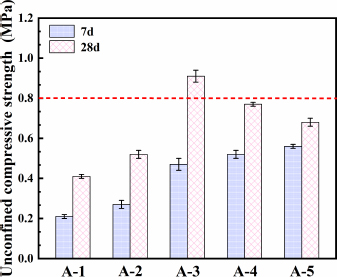
Fig. 2.
Variation diagram of strength of fluidized solidified soil with composition ratio of curing agent
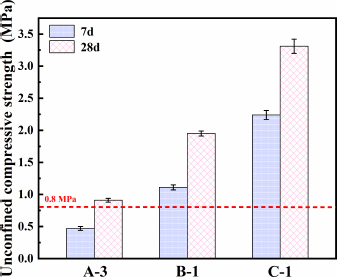
Fig. 3.
Unconfined compressive strength of fluidized solidified soil with different sand ratio
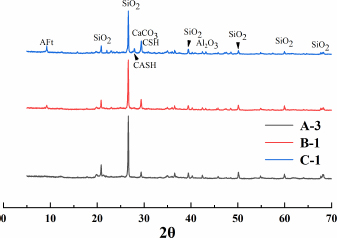
Fig. 4.
X-ray diffraction patterns of fluidized solidified soil with different sand ratio after 28 days of curing. (AFt: ettringite (3CaO·Al2O3·3CaSO4·32H2O); CSH: calcium silicate hydrate (Ca5Si6O16(OH)*4H2O); CASH: calcium silicoaluminate hydrate (Ca2Al2 SiO7(OH)*4nH2O))
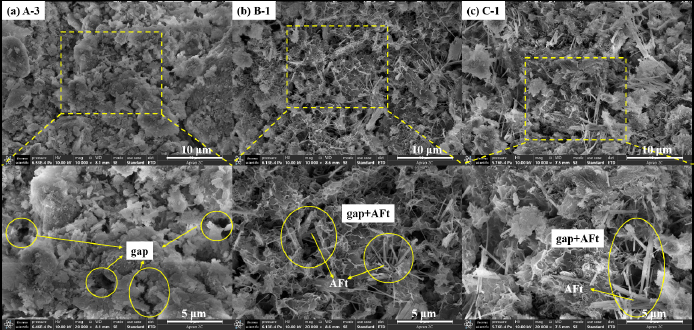
Fig. 5.
Micrograph of fluidized solidified soil with different sand ratio after 28 days of curing (AFt: ettringite (3CaO·Al2O3·3CaSO4 ·32H2O))
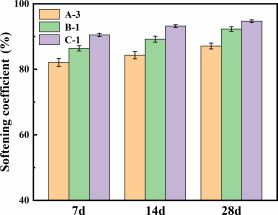
Fig. 6.
Variation of softening coefficient of fluidized solidified soil with different sand ratio with curing age before soaking
Table 5.
Mass ratio (kg) and corresponding raw material carbon emission factor used in carbon emission calculation of different backfill materials [28–32]
| Backfill materials | Clay | Quicklime | Cement | Fly ash | Sand | Aggregate | Water | Water reducer | Foaming agent | Excavated soil |
|---|---|---|---|---|---|---|---|---|---|---|
| Lime-soil | 1120 | 360 | ||||||||
| C15 plain concrete | 168 | 82 | 840 | 1170 | 160 | 2.5 | ||||
| Foamed concrete | 332 | 812 | 358 | 0.23 | ||||||
| Fluidized solidified soil | 48 | 72 | 24 | 598 | 958 | |||||
| Carbon emission factor (kg CO2e/t) | 2.69 | 1190 | 735 | 8 | 2.51 | 2.18 | 0.168 | 28 | 1950 | 1.0 |
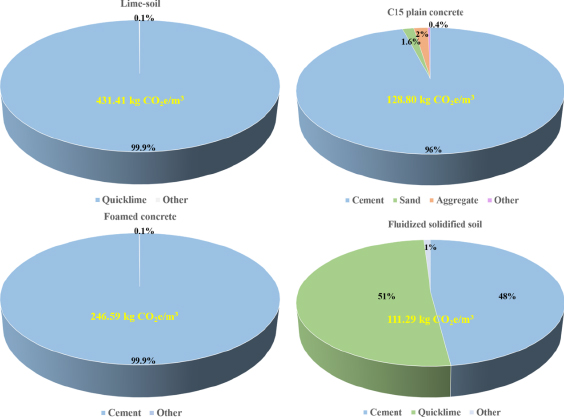
Fig. 7.
Comparison diagram of carbon emissions of fluidized solidified soil and traditional backfill materials
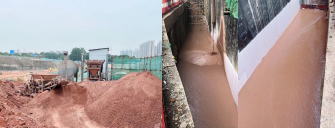
Fig. 8.
Field application of the fluidized solidified soil prepared in this paper
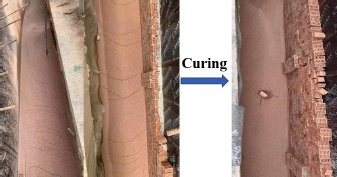
Fig. 9.
Surface morphology of uncured and cured solidified soil