
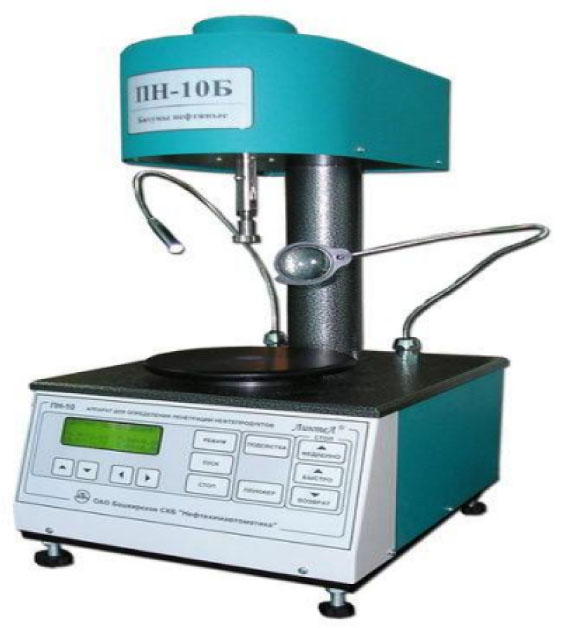
Fig. 1
Penetrometer “Lintel PN-10B”
Table 1
Data on the hardness of the original bitumen
| Needle penetration depth, 0.1 mm | Test method | Norm for DSTU 4044 | Actual value |
|---|---|---|---|
| At 25°C | GOST 11501 | 91–130mm | 108mm |
| At 0°C | Not <28mm | 33mm |
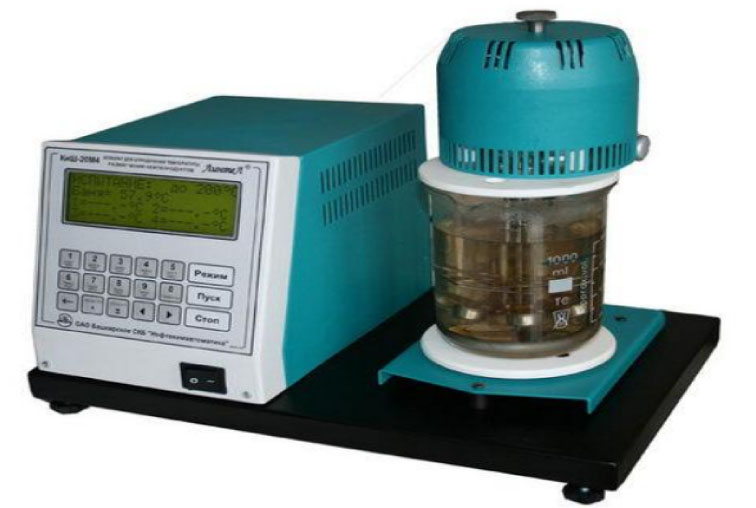
Fig. 2
Apparatus Lintel KiSh-20m-4
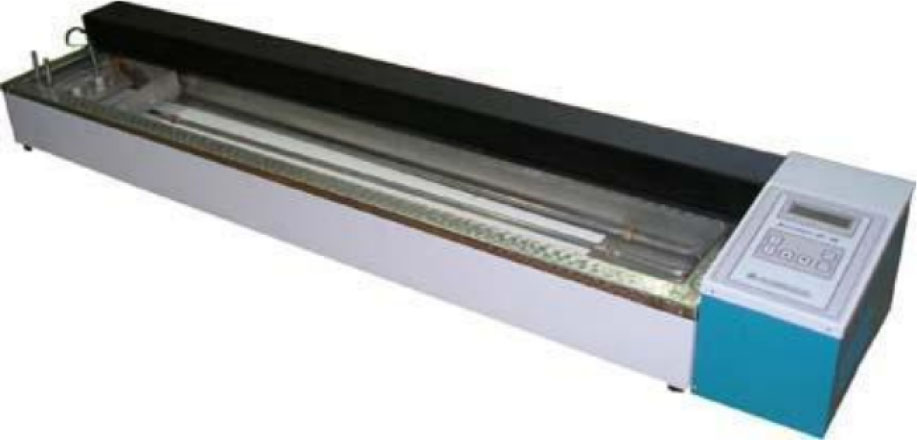
Fig. 3
Ductilometer DB-2M
Table 2
Data on the elasticity of original bitumen
| Extensibility of bitumen, cm | Test method | Standard according to DSTU 4044 | Actual value |
|---|---|---|---|
| At 25°C | GOST 11501 | 6.5 | 88 |
| At 0°C | 4.0 | 5.6 |
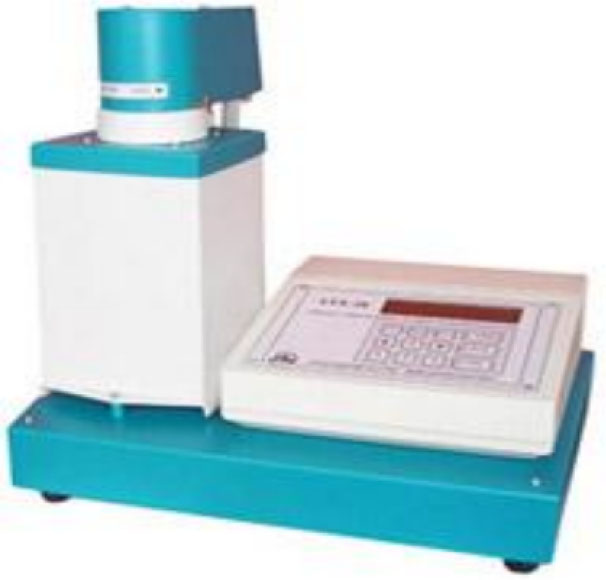
Fig. 4
Apparatus for determining the brittleness temperature of petroleum bitumen ATX-20
Table 3
Basic indicators of bitumen BND 90/130
| No. | Indicator name | Norm of DSTU 4044 | Actual value |
|---|---|---|---|
| 1 | Flash point, °C, not lower | 230 | 265 |
| 2 | Change in softening temperature after heating, °C, no more | 5 | 5 |
| 3 | Penetration index | From +1 to −1 | −0.8 |
| 4 | Bonding bitumen to marble or sand | Pass the test against the control sample | Withstands the marble test |
Table 4
Composition of crushed stone according to the requirements of DSTU B V.2.7-119
| Indicators | Sieve openings, mm | |||||
|---|---|---|---|---|---|---|
| 25 | 20 | 12.5 | 10 | 5 | 2.5 | |
| Private balances | 0 | 0.76 | 54.04 | 6.4 | 36.6 | 1.9 |
| Full balances | 0 | 0.76 | 54.8 | 61.2 | 97.8 | 99.7 |
| Full passes | 0 | 99.24 | 45.2 | 38.8 | 2.2 | 0.7 |
| DSTU requirements | Up to 0.5 | Up to 10 | 30–60 | – | 90–100 | 95–100 |
Table 5
Basic properties of crushed stone of 5–20 mm fraction
| No. | The name of indicators | DSTU B V.2.7-30 requirements | Actual indicator |
|---|---|---|---|
| 1 | Crushed stone moisture, % | Not normalized | 0.15 |
| 2 | Bulk density at natural humidity, t/m3 | Not normalized | 1.47 |
| 3 | Content of flaky and needle-shaped grains, % | From 15 to 25, III group | 22.01 |
| 4 | Content of dust and clay particles, % by weight | Not >1 | 0.37 |
| 5 | Clay content in lumps, % by weight | Not >0.25 | 0 |
| 6 | Crushed stone crushing (grade), % by weight | To 12, including Grade 1400 | 3.9 |
| 7 | Crushed stone abrasion grade, % | To 25, including Grade I1 | 7.4 (I1) |
| 8 | Grain content of weak rocks, % by weight | Not >5 | 2.4 |
| 9 | Crushed stone frost resistance, cycles, weight loss in % | 15, not >2 (F300) | 1.7 (F300) |
| 10 | Specific effective activity of natural radionuclides, Bq/kg | Not >370 | 15.8 |
| 11 | Stability of the structure against decay (loss of mass), % | 0.65–0.9 |
Table 6
Grain size of sand
| Sieve size, mm | Actual results | ||
|---|---|---|---|
| Private balances, % | Total balances, % | Full passes, % | |
| 2.5 | 33.65 | 33.65 | 66.35 |
| 1.25 | 21.664 | 55.29 | 44.71 |
| 0.63 | 18.63 | 73.29 | 26.08 |
| 0.315 | 11.52 | 85.44 | 14.56 |
| 0.16 | 9.29 | 94.73 | 5.27 |
| 0.071 | 3.12 | 97.85 | 2.15 |
| <0.071 | 2.15 | 100 | 0 |
Table 7
Physical and mechanical properties of sand
| No. | Name of indicators | DSTU B V.2.7-30 requirements | Actual indicator |
|---|---|---|---|
| 1 | Bulk density, kg/m3 | – | 1,510 |
| 2 | True density, kg/m3 | – | |
| 3 | Content of dust and clay particles, % | Not >10.0 | 1.46 |
| 4 | Size module | 3.0–3.5mm | 3.34mm |
| 5 | Sand group | – | Increased size |
| 6 | Clay content in lumps, % | Not >2.0 | Does not have clay |
| 7 | Content of grains with size >10 mm, % | Not >5 | 0 |
| 8 | Content of grains with size >5 mm, % | Not >15 | 0 |
| 9 | Content of grains with size >0.63 mm, % | 65–75 | 73.92 |
| 10 | Content of grains with size >0.16 mm, % | Not >10 | 5.27 |
| 11 | Total specific effective activity of natural radionuclides, Bq/kg | Not >370 | 296.6 |
Table 8
Basic properties of mineral powder
| No. | Indicator name | Factual data |
|---|---|---|
| 1 | Grain composition, % sieve 1.25 mm | 100 |
| 2 | Grain composition, % sieve 0.315 mm | 98.8 |
| 3 | Grain composition, % sieve | 74.3 |
| 4 | Swelling by volume, % | 2.40 |
| 5 | Porosity by volume, % | 29.9 |
| 6 | Humidity, % | 0.45 |
| 7 | Specific gravity, g/cm3 | 2.83 |
| 8 | Content of sesquioxides (Al+Fe), % | 1.17 |
| 9 | Water-soluble fraction, % | 2.41 |
| 10 | Active CaO + MgO, % | 2.08 |
| 11 | Loss on ignition, % | 17 |
| 12 | Total specific efficiency of natural radionuclides, Bq/kg | 1,348 |
Table 9
Fly ash fiber characteristics
| Name of indicators | Physical and mechanical properties |
|---|---|
| Fly ash fiber | |
| Average fiber diameter, μm | 160.0 |
| The amount of nonfibrous additives, % | 2–3 |
| Density, g/cm3 | 2.65 |
| Temperature range of use, °C | −269 to +700 |
| Water resistance, % | 99.6 |
| Chemical resistance, % | 93.4 |
| 0.5H NaOH | 77.3 |
| 2H NaOH | 98.5 |
| 2H H2SO4 | to 1.0 |
| Hygroscopicity, % | 4,100 |
| Mechanical strength, MPa | 120 |
| Elastic modulus, MPa | 3.1 |
Table 10
Types of CEMM by grain size
| Sieve diameter, mm | Full pass through the sieve, % by weight, for mixtures of the type | ||
|---|---|---|---|
| Type 1 | Type 2 | Type 3 | |
| 15 | 100 | 100 | 100 |
| 10 | 100 | 100 | 80–94 |
| 5 | 100 | 91–100 | 71–90 |
| 2.5 | 90–100 | 65–90 | 45–70 |
| 1.25 | 67–91 | 46–71 | 29–51 |
| 0.63 | 41–66 | 31–51 | 20–35 |
| 0.315 | 24–41 | 17–29 | 12–24 |
| 0.14 | 14–28 | 9–20 | 7–18 |
| 0.071 | 10–20 | 5–15 | 5–15 |
Table 11
Grain composition of mineral filler
| Mix component name | Content by weight, in %, of mineral grains smaller than a given size, mm | ||
|---|---|---|---|
| 0.315 | 0.140 | 0.071 | |
| Mineral filler | 90–100 | 75–100 | 67–100 |
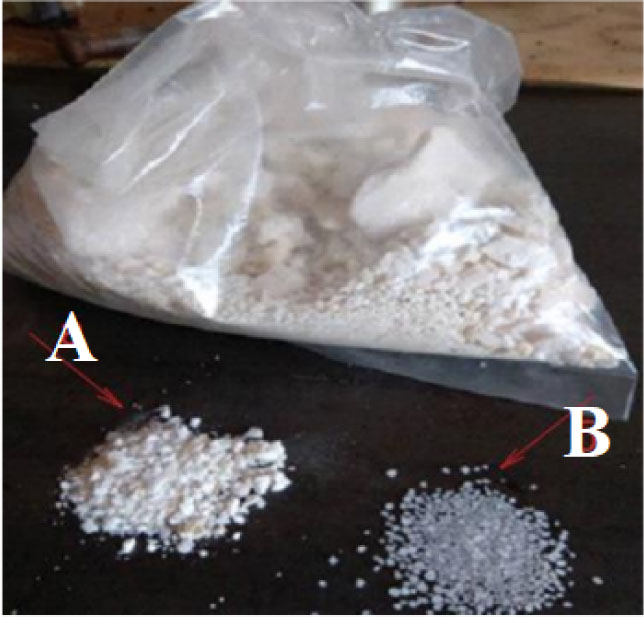
Fig. 5
Aluminum sulfate: sample A – first grade; sample B – top grade
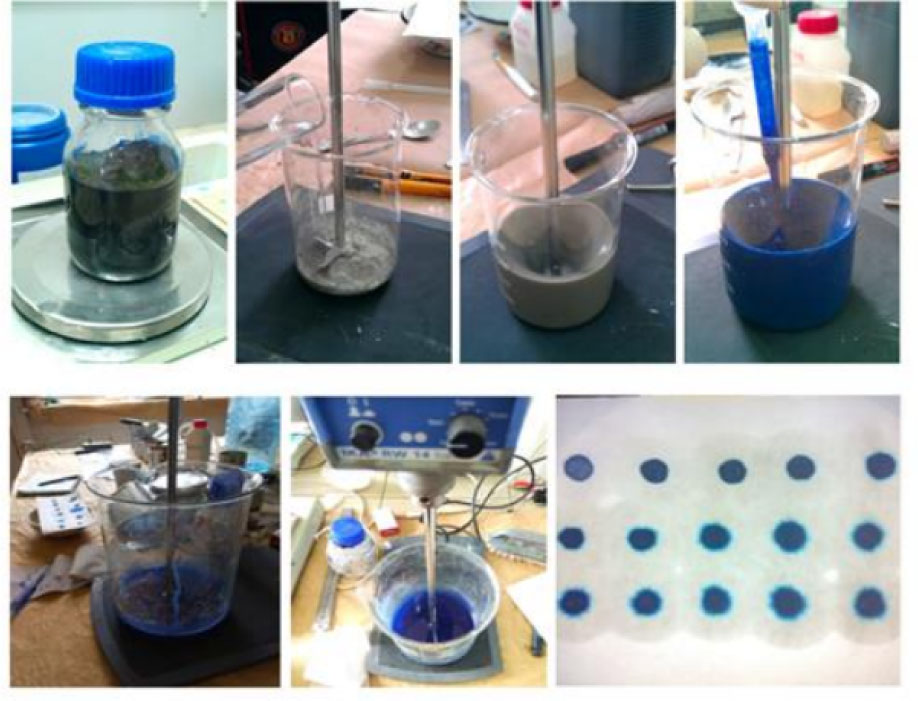
Fig. 6
Test procedure for determining adsorption of methylene blue
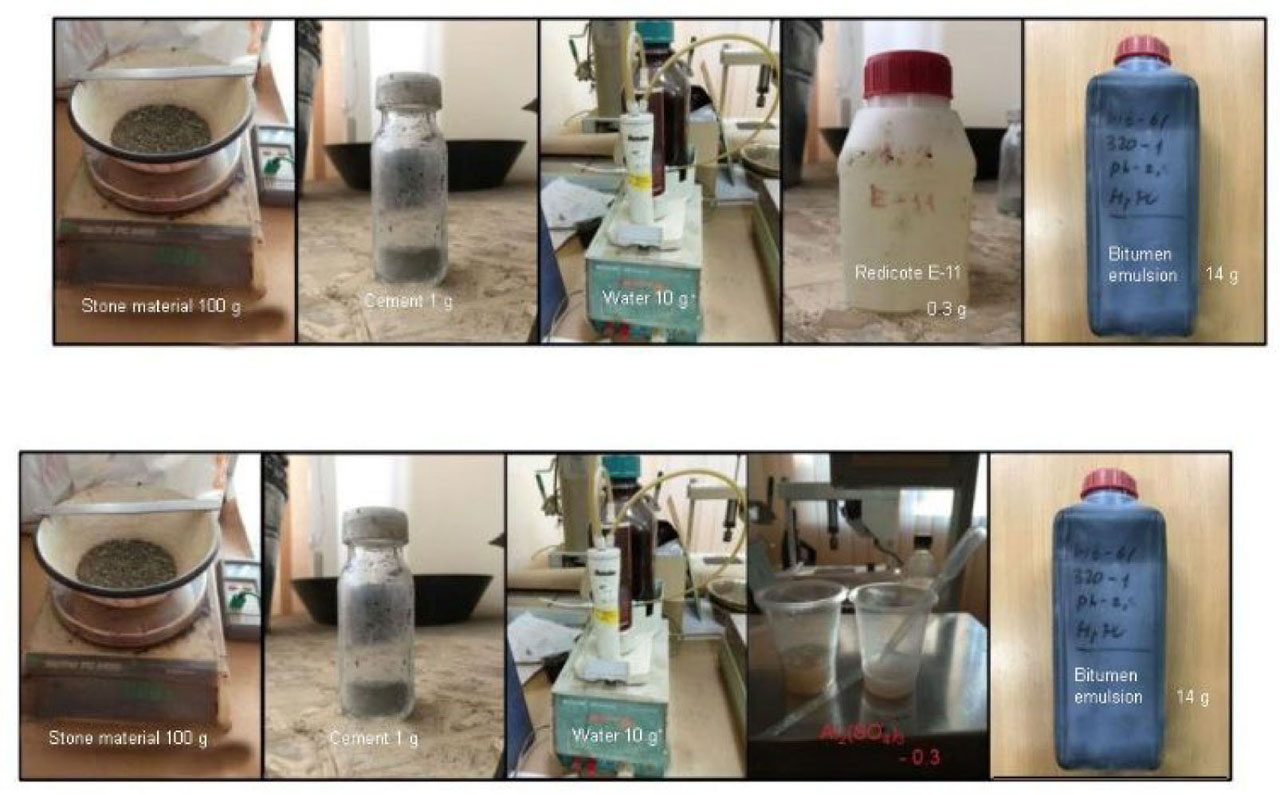
Fig. 7
Components in cast emulsion–mineral mixtures
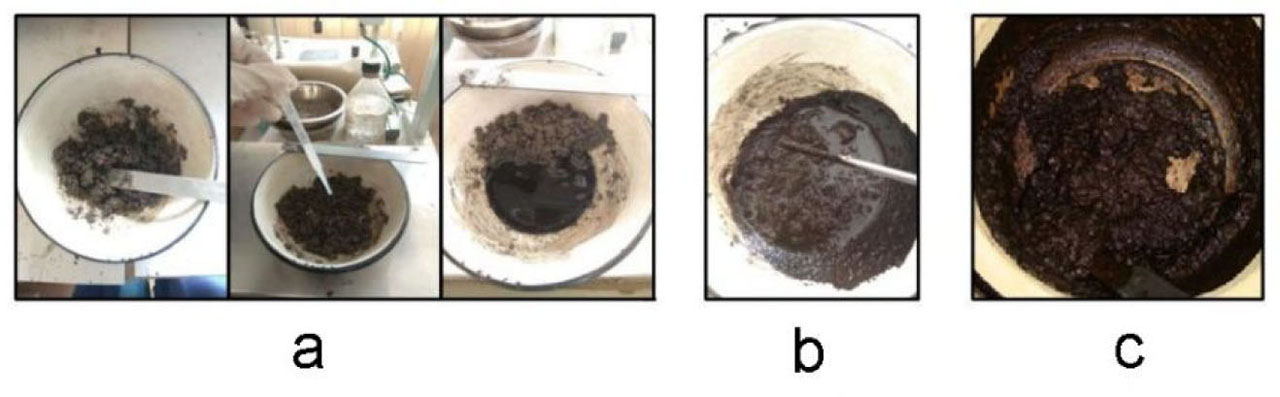
Fig. 8
Determination of CEMM decay
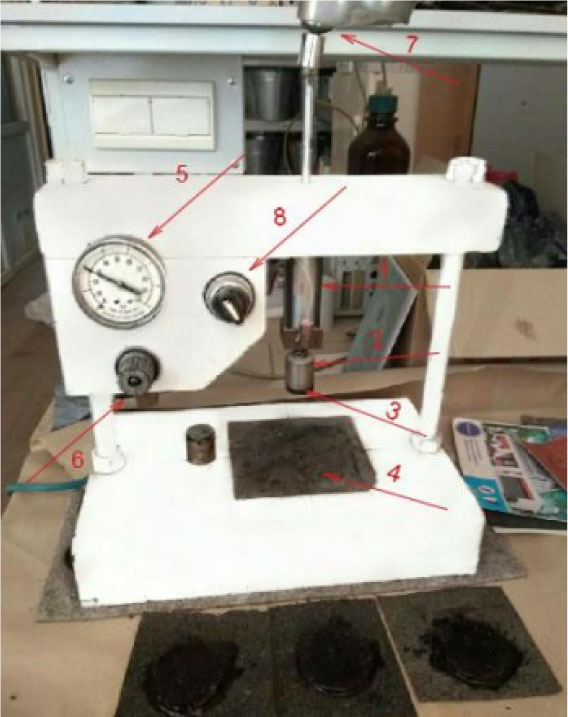
Fig. 9
Modified cohesive device: 1 - air cylinder; 2 -cylinder rod; 3 - rubber tip; 4 - a plate of roofing felt(s); 5 - pressure gauge for measuring the pressure in the cylinder; 6 - air pressure regulator; 7 - torque wrench; 8 - regulator for lowering the cylinder rod
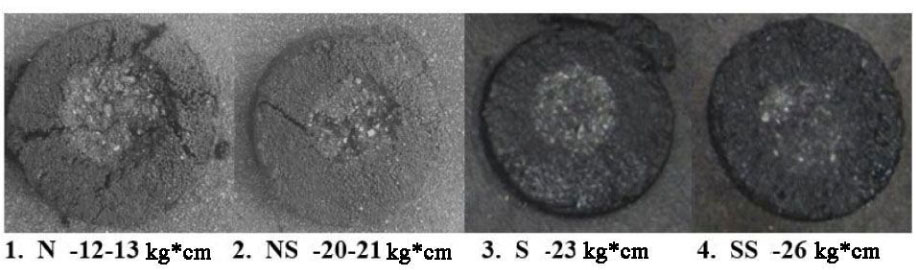
Fig. 10
Destruction of cast emulsion–mineral mixture specimens by type. N, normal; NS, normal spin; S, spin; SS, solid spin
Table 12
Determination of the road surface formation stages from cast emulsion–mineral mixtures
| Strength characteristics | Stages of forming road surfaces from cast emulsion-mineral mixtures | |
|---|---|---|
| The nature of the destruction | Torque value, kg*cm | |
| “N” – Normal | 12–13 | Grasping |
| “NS” – Normal spin | 20–21 | Self-sealing (opening movement with a speed limit of up to 40 km/hr) |
| “S” – Spin | 23 | Sealing |
| “SS” – Solid spin | 26 | Hardening (opening movement without speed limit)† |
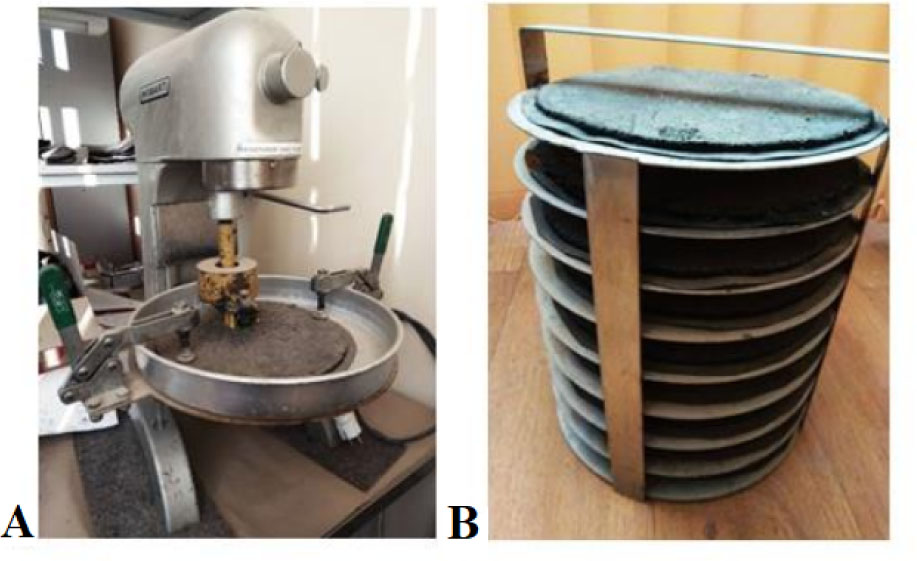
Fig. 11
A - planetary mixer “Hobar C-100”; B - finished samples
Table 13
Structural type according to the HCS criterion
| No. | Bitumen brand | Group chemical composition, wt.% | Ratio, *100% | C-th type according to HCS | |||||
|---|---|---|---|---|---|---|---|---|---|
| Manufacturer | Production technology | Asphaltenes (A) | Resins (C) | Oils (olives) (M) | A/A+C | A/C+M | |||
| 1 | Nynas 100/150 | Nynas | Distillation | 12.1 | 29.5 | 58.4 | 29.1 | 13.8 | 2 |
| 2 | Nybit E85 | Nynas | Distillation | 15.9 | 38.1 | 46.0 | 29.4 | 19.8 | 2 |
| 3 | BND 60/90 | Ukrtatnafta | Oxidation | 25.3 | 24.7 | 50.0 | 50.6 | 33.9 | 3 |
| 4 | BND 60/90 with ICR | Ukrnafta | Oxidation | 22.0 | 36.0 | 42.0 | 37.9 | 28.2 | 3 |
[i] ICR, indene–coumarone resin
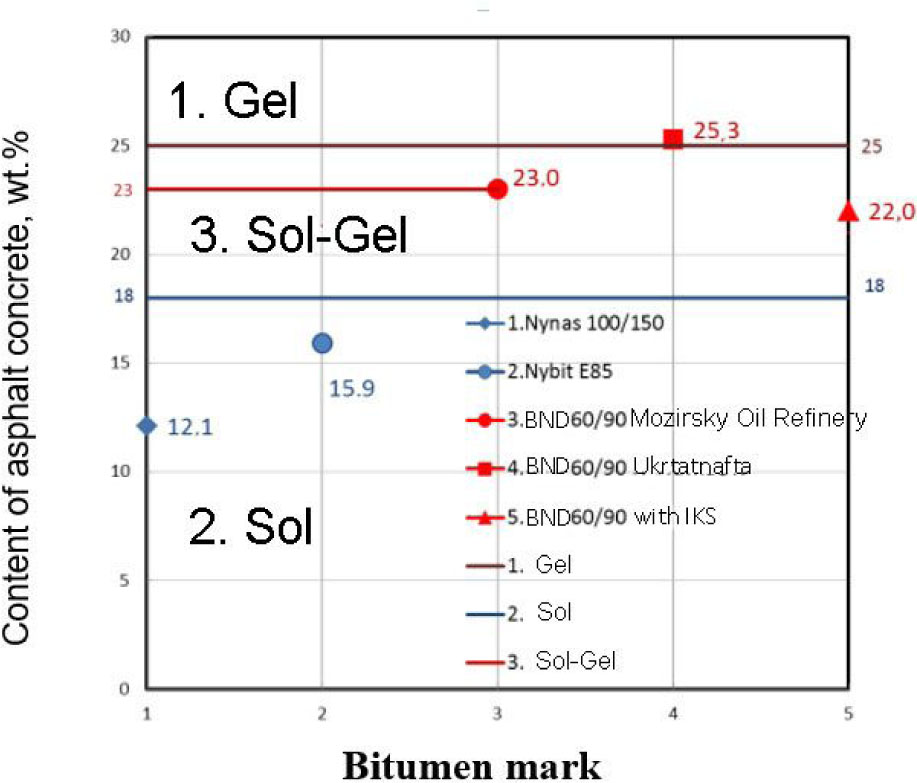
Fig. 12
Quantitative content of asphaltene depending on the bitumen brand
Table 14
Physical and mechanical properties of bitumen
| No. | Bitumen brand | Name and meaning of indicators | |||||||
|---|---|---|---|---|---|---|---|---|---|
| Ttimes, °C | P25, 0.1 mm | L25, cm | Txp, °C | IP, °C | IR | Paraffin contents, wt.% | Glass adhesion | ||
| 1 | Nynas 100/150 | 43 | 107 | >100 | −15 | 58 | −1.25 | 0.5 | 20 |
| 2 | Nybit E85 | 47 | 80 | >100 | −11 | 58 | −0.8 | 0.5 | 24 |
| 3 | BND 60/90 | 49 | 72 | 84 | −18 | 67 | 0.6 | 5.4 | 32 |
| 4 | BND 60/90 with IKS | 52 | 62 | 26 | −16 | 68 | −0.21 | 4.0 | 93 |
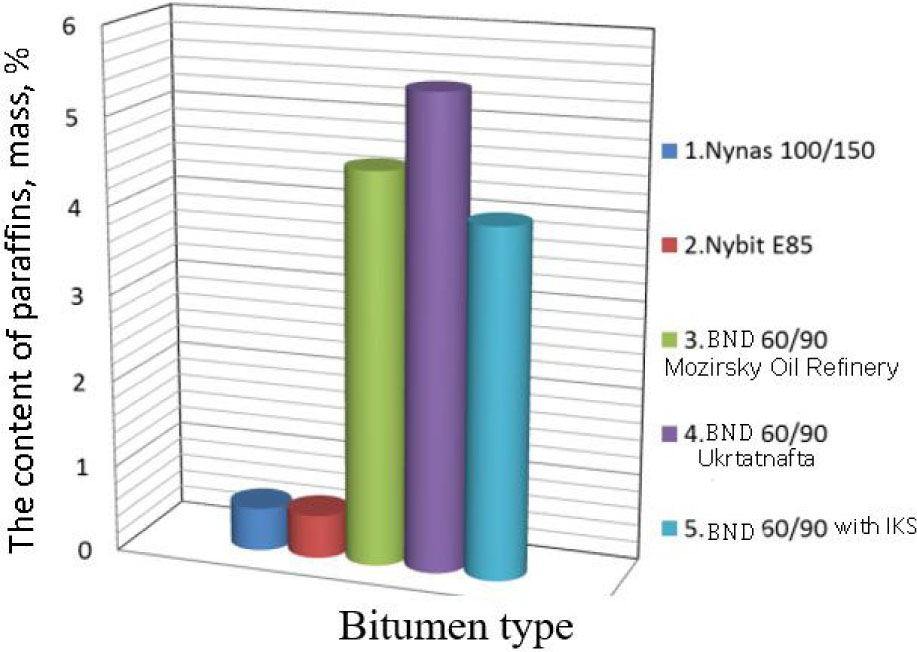
Fig. 13
The content of paraffin in bitumen of different types
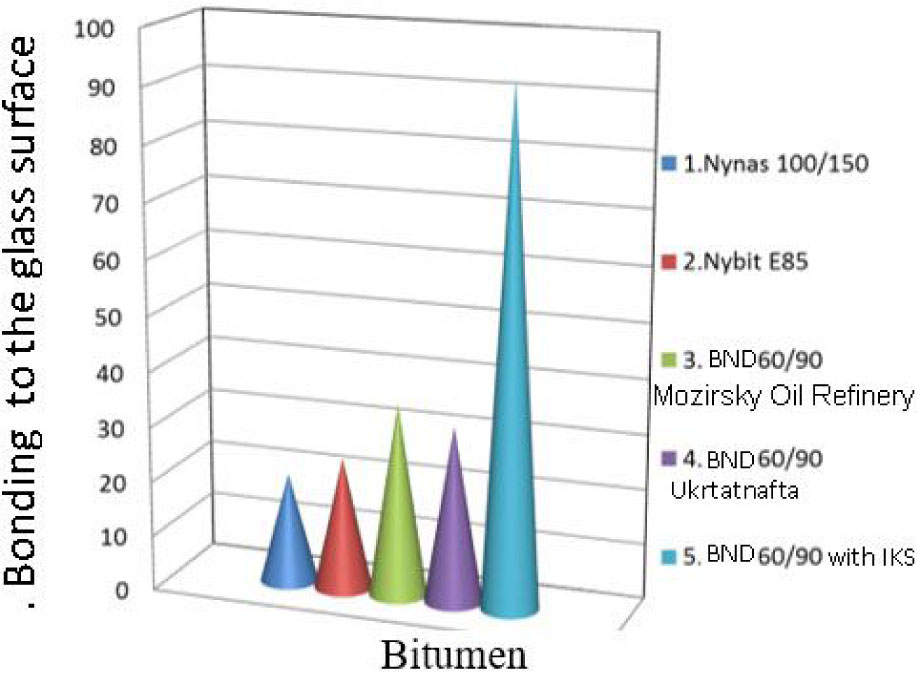
Fig. 14
Adhesion of different types of bitumen to the glass surface
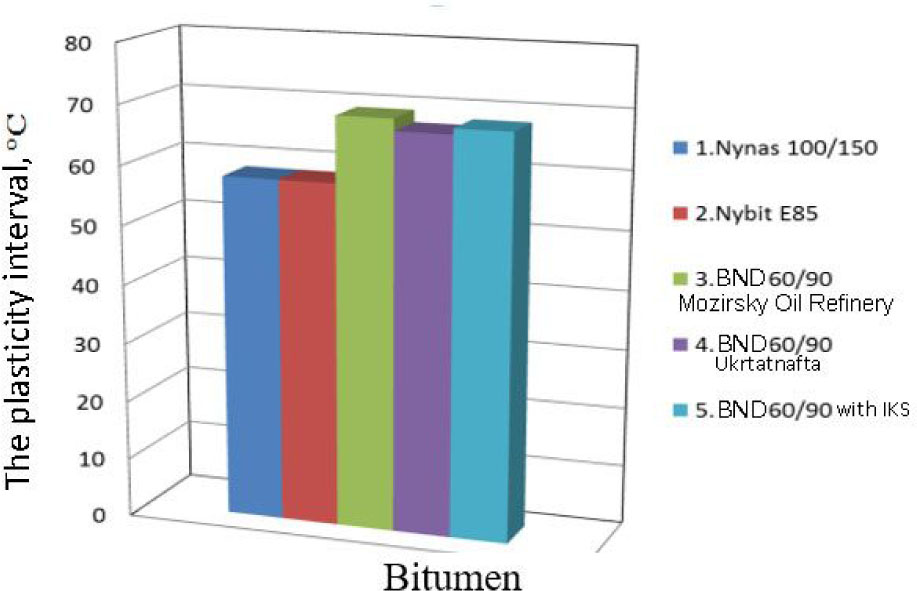
Fig. 15
The plasticity interval of different types of bitumen
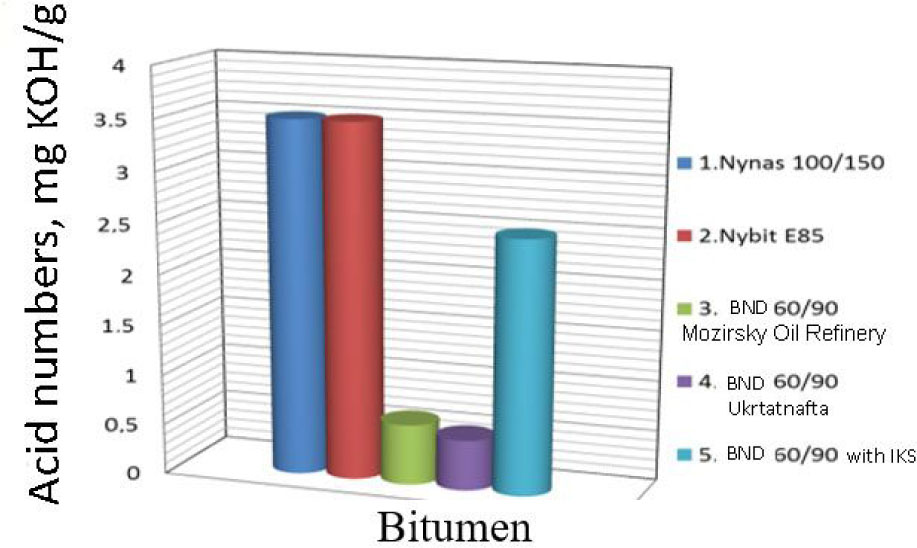
Fig. 16
Acid quantity in different types of bitumen
Table 15
Structural types of bitumen according to the HCS criterion and design criteria
| No. | Bitumen brand | The structural type by criteria | ||||||
|---|---|---|---|---|---|---|---|---|
| HCS | Plastic interval | Penetration index | Indicator V.A. Zolotareva (Ksta) | |||||
| PI, °C | C-type | PI | C-type | Ksta | C-type | |||
| 1 | Nynas 100/150 | 2 | 58 | 3 | −1.25 | 2 | 0.07 | 2 |
| 2 | Nybit E85 | 2 | 58 | 3 | −0.8 | 3 | 0.07 | 2 |
| 3 | BND 60/90 | 3 | 69 | 3 | −0.7 | 3 | 0.083 | 3 |
| 4 | BND 60/90 with IKS | 3 | 67 | 3 | −0.6 | 3 | 0.096 | 3 |
Table 16
Calculated selection of the composition of the asphalt concrete mixture
| No. | Name of materials | Mixture composition (bitumen >100%) | The composition of the mixture (bitumen 100%) |
|---|---|---|---|
| 1 | Crushed granite fraction, 10–20 mm | 29.98 | 28.34 |
| 2 | Crushed granite fraction, 5–10 mm | 13.73 | 12.98 |
| 3 | Sand from crushing screenings | 48.29 | 45.64 |
| 4 | Nonactivated mineral powder MP-1 | 4.00 | 3.78 |
| 5 | Fiber from the fly ash of thermal power plants made in China | 4.00 | 11.14 |
| 6 | Bitumen BND 90/130 | 11.80 | – |
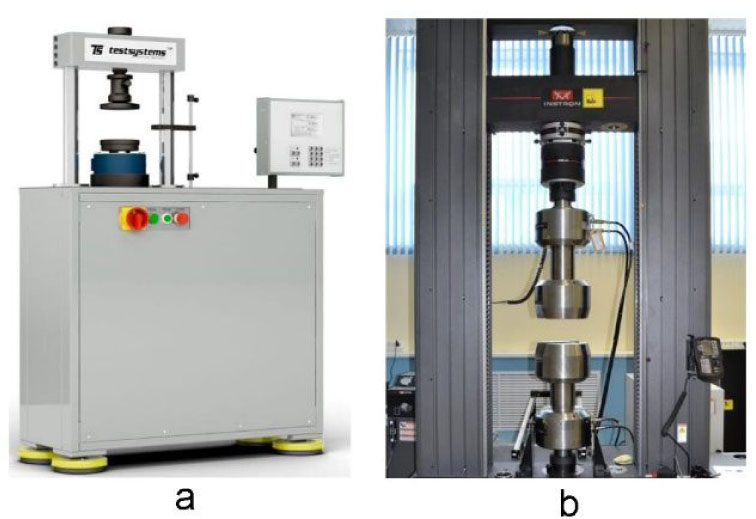
Fig. 17
Equipment for determining the strength and deformation characteristics of asphalt concrete: A – DTS 06-50-50 press; B – a universal machine Instron 6637 (USA)
Table 17
Physical and mechanical properties of asphalt concrete
| Binder composition, compressive strength | Traditional composition | Composition with the addition of fiber, % | |||
|---|---|---|---|---|---|
| 1.0 | 2.0 | 3.0 | 4.0 | ||
| At t=50°C, MPa | 1.62 | 1.24 | 1.47 | 1.58 | 1.55 |
| At t=20°C, MPa | 3.31 | 2.74 | 3.02 | 3.07 | 2.74 |
| At t=0°C, MPa | 8.12 | 7.26 | 7.66 | 9.21 | 9.84 |
| Coefficient of temperature sensitivity, R50/R0 | 0.20 | 0.17 | 0.19 | 0.17 | 0.16 |
| Coefficient of temperature sensitivity, R50/R20 | 0.49 | 0.45 | 0.48 | 0.51 | 0.57 |
| Water resistance after prolonged water saturation | 0.94 | 0.92 | 0.91 | 0.91 | 0.90 |
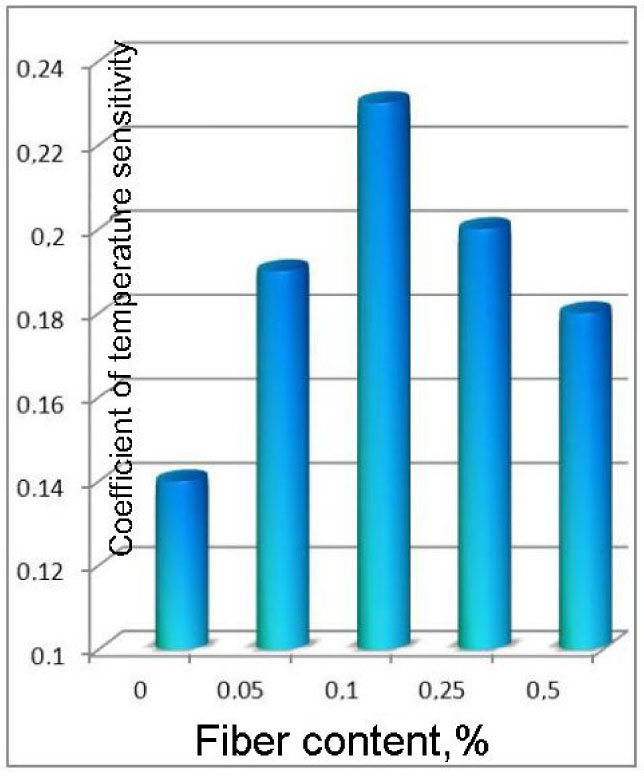
Fig. 18
Coefficient of temperature sensitivity depending on the amount of fiber in the mixture
Table 18
Deformation of cast asphalt concrete during its compression at maximum load at low temperatures, obtained on Instron 6637 (USA)
| Binder composition for asphalt concrete | Displacement at maximum load, at temperatures, mm/mm | |||
|---|---|---|---|---|
| 5°C | 0°C | 5°C | ||
| BND 90/130 | 0.750 | 0.734 | 0.728 | |
| Fly ash fiber | 1.0 wt.% | 1.022 | 0.812 | 0.789 |
| 2.0 wt.% | 1.025 | 0.983 | 0.774 | |
| 3.0 wt.% | 0.712 | 0.914 | 0.766 | |
| 4.0 wt.% | 0.892 | 0.861 | 0.720 | |
Table 19
Requirements for cohesive strength set speed of cast emulsion–mineral mixtures
| Time necessary to achieve required cohesive strength, hr | Durability properties | Stages of formation of cast emulsion-mineral mixtures | ||
|---|---|---|---|---|
| Nature of destruction | Torque value, kg*cm | Ultimate shear strength, mPa, not more | ||
| Not more than 0.5 | “N” – Normal | 12–13 | 0.26 | Grasping |
| Not more than 1.0 | “NS” – Normal Spin | 20–21 | 0.42 | Self-sealing (the opening of traffic with a speed limit of 40 km/hr) |
| - | “S” – Spin | 23 | 0.48 | Sealing |
| Not more than 4.0 | “SS” – Solid Spin | 26 | 0.55 | †Hardening (the opening of traffic without speed limits) |