
Fig. 1
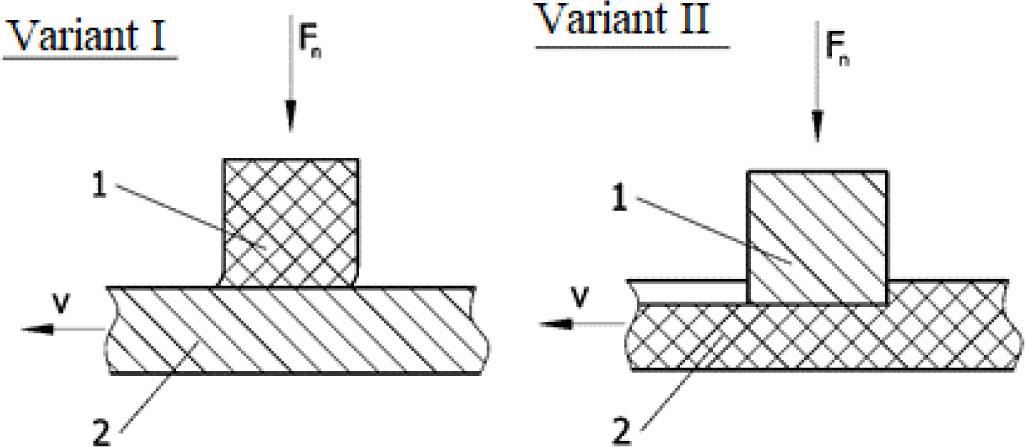
Fig. 2
Fig. 3
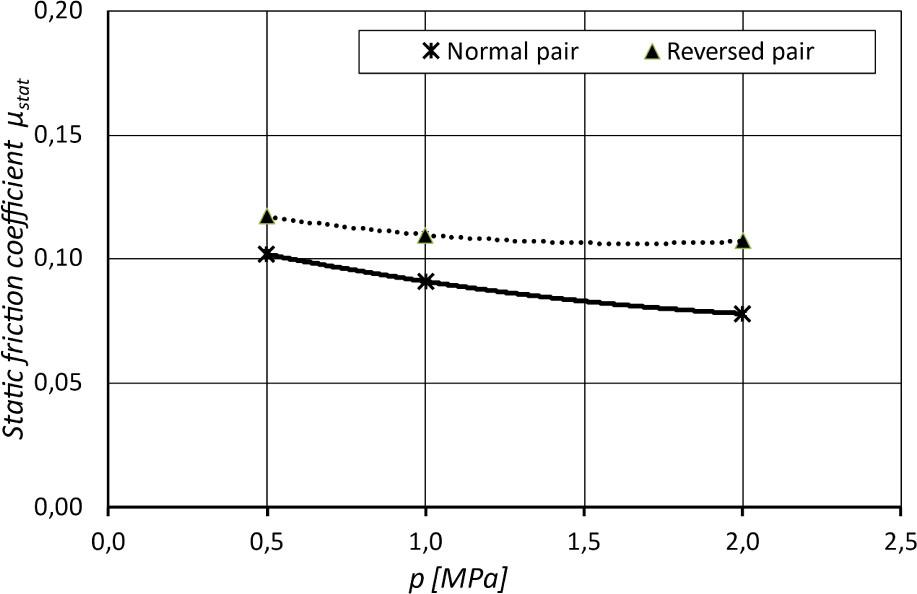
Fig. 4
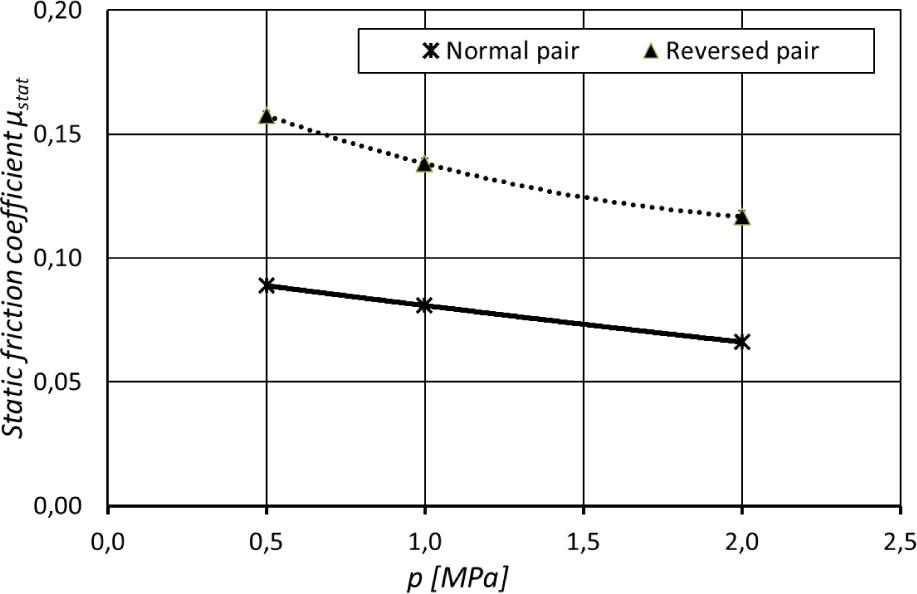
Fig. 5
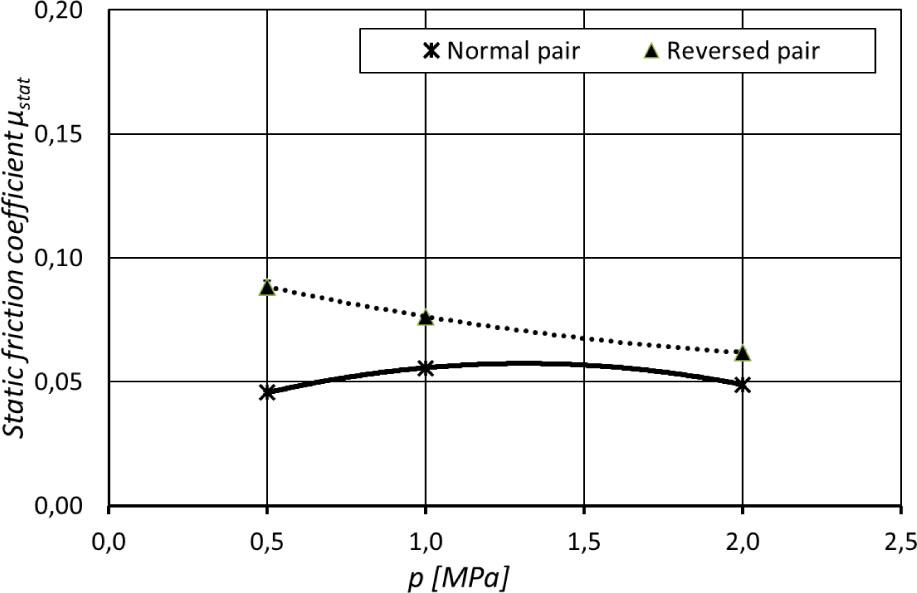
Fig. 6
Fig. 7
The static friction coefficient of tested polymer–steel friction pairs as a function of unit pressure p_ Normal sliding pairs
| Sample material | Unit pressure p [MPa] | ||
|---|---|---|---|
| 0.5 | 1.0 | 2.0 | |
| PE-UHMW | 0.10 ± 0.002 | 0.09 ± 0.001 | 0.08 ± 0.001 |
| POM | 0.09 ± 0.001 | 0.08 ± 0.001 | 0.07 ± 0.001 |
| PTFE | 0.05 ± 0.001 | 0.06 ± 0.001 | 0.05 ± 0.001 |
Percentage changes in static friction coefficient values for normal sliding pair in comparison with reversed pair
| Unit pressure p [MPa] | ||||
|---|---|---|---|---|
| 0.5 | 1 | 2 | Average | |
| PE-UHMW (%) | −16.7 | −18.2 | −27.3 | −20.7 |
| POM (%) | −43.7 | −42.8 | −41.7 | −42.7 |
| PTFE (%) | −44.4 | −25.0 | −16.7 | −28.7 |
The static friction coefficient of tested steel-polymer friction pairs as a function of unit pressure p_ Reversed sliding pairs
| Counterbody material | Unit pressure p [MPa] | ||
|---|---|---|---|
| 0.5 | 1.0 | 2.0 | |
| PE-UHMW | 0.12 ± 0.001 | 0.11 ± 0.001 | 0.11 ± 0.001 |
| POM | 0.16 ± 0.002 | 0.14 ± 0.002 | 0.12 ± 0.002 |
| PTFE | 0.09 ± 0.002 | 0.08 ± 0.001 | 0.06 ± 0.001 |
Mechanical parameters of polymers selected for tests [18]
| Density [g/cm3] | E-modulus [MPa] | Glass transition temperature [°C] | Melting point [°C] | Softening point [°C] | |
|---|---|---|---|---|---|
| PE-UHMW | 0.93 | 730 | −100 | 135 | 80 |
| POM | 1.41 | 2400 | −240 to 180 | 167 | 150 |
| PTFE | 2.6 | 750 | −97 | 327 | - |