
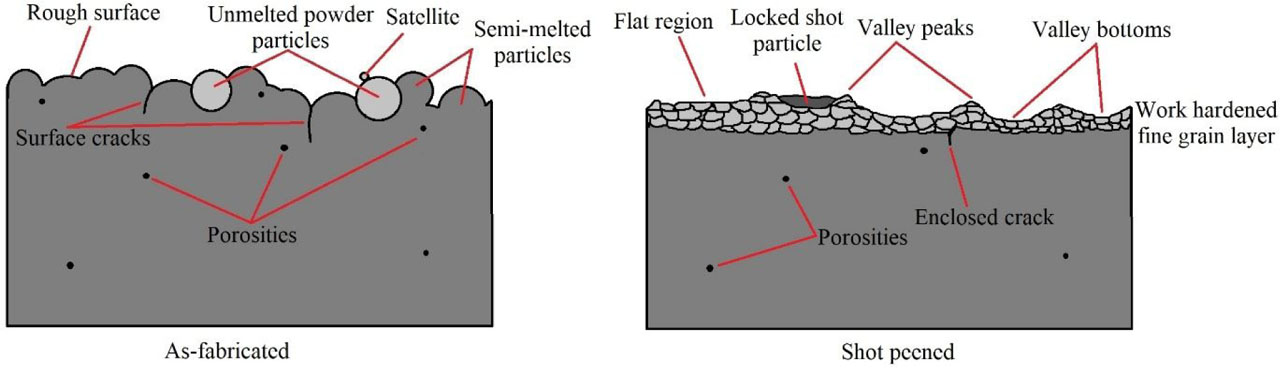
Fig. 1
Schematic of changes within the surface layer of the material following fabrication and after peening, compiled on the basis of [13]
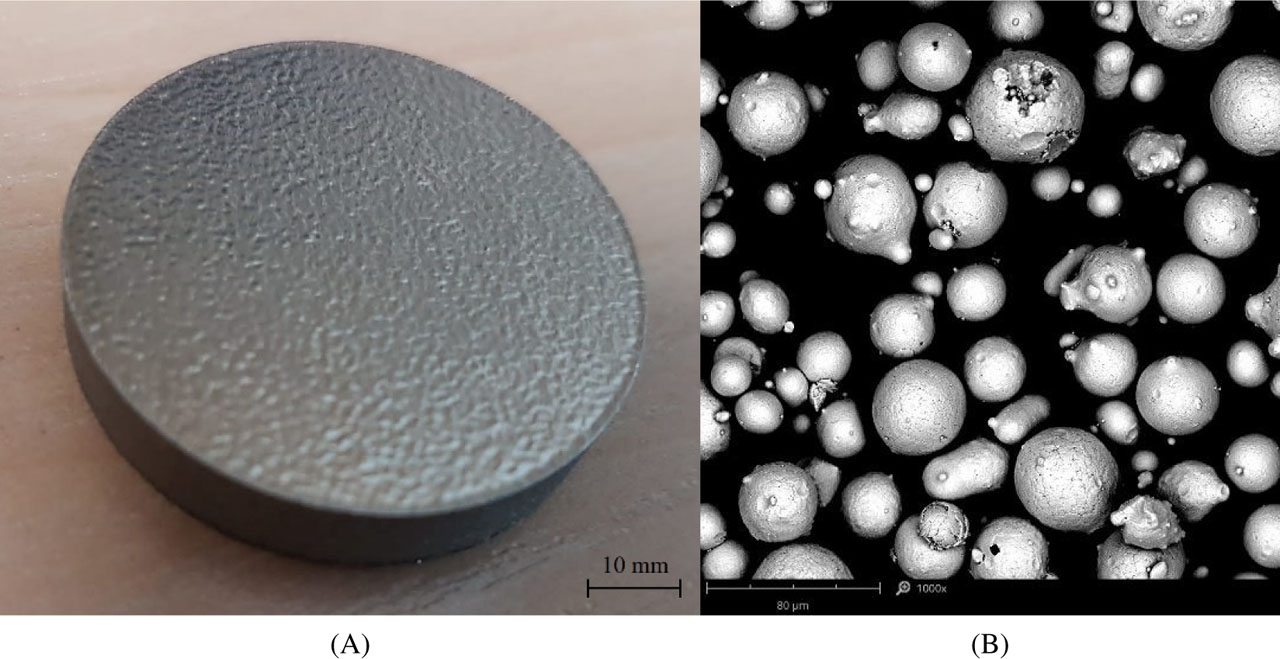
Fig. 2
17-PH: (A) DMLS printed specimen's texture after SP; (B) EOS GP1. DMLS, direct metal laser sintering; SP, shot peening
Table 1
Specimen's designations and peening characteristics
| Peening medium | Size of particles [μm] | Time [min] | Peening pressure [MPa] | Chemical composition |
|---|---|---|---|---|
| Reference | – | – | – | – |
| Ceramic | ∅125–250 | 1 | 0.3 | ZrO2 60%–70%, SiO2 28%–33% Al2O3 < 10% |
| Glass beads | ∅100–200 | 1 | 0.3 | 70% SiO2, 10% CaO, 15% Na2O + K2O, 5% MgO |
| Steel shots | ∅400–900 | 1 | 0.3 | Cr 16%–20%, Ni 7%–9%, Si 1.8%–2.2%, Mn 0.7%–1.2%, C 0.05%–0.02%, Fe-Bal. |
Table 2
Chemical composition in accordance with manufacturer data and ASTM A564
| C | Cr | Ni | Cu | Mn | Si | Mo | Nb | Fe | ||
|---|---|---|---|---|---|---|---|---|---|---|
| 17-4PH as-fabricated | 0.04 | 15.85 | 4.92 | 4.79 | 0.67 | 0.71 | 0.12 | 0.27 | Bal. | |
| GP1 | Wt. [%] | 0.01 | 15.8 | 4.02 | 3.9 | 0.7 | 0.7 | 0.4 | 0.29 | Bal. |
| GP1 powder (EOS declaration) | <0.07 | 15–17.5 | 3–5 | 3–5 | <1 | <1 | <0.5 | 0.15–0.45 | Bal. | |
| EN10088-1 | <0.07 | 15–17 | 3–5 | 3–5 | <1.5 | <0.7 | <0.6 | 5*C–0.45 | Bal. | |
| ASTM A564 | <0.07 | 15–17.5 | 3–5 | 3–5 | <1 | 1 | <0.5 | 0.15–0.45 | Bal. | |
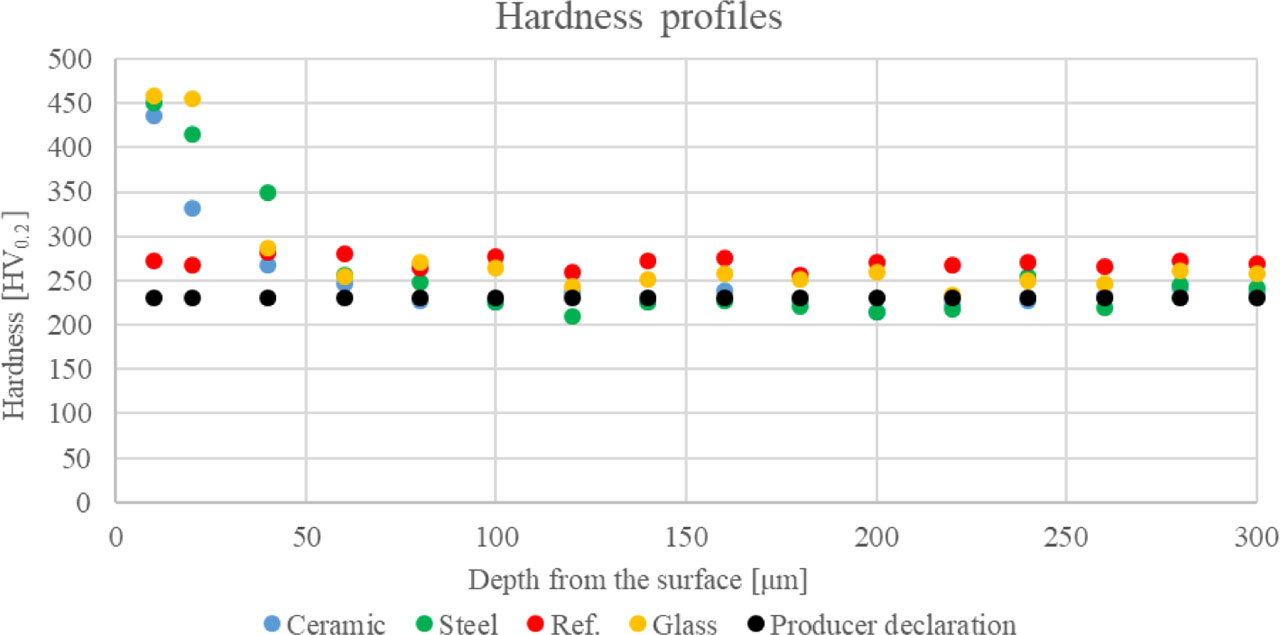
Fig. 3
Hardness profiles of SP specimens. SP, shot peening
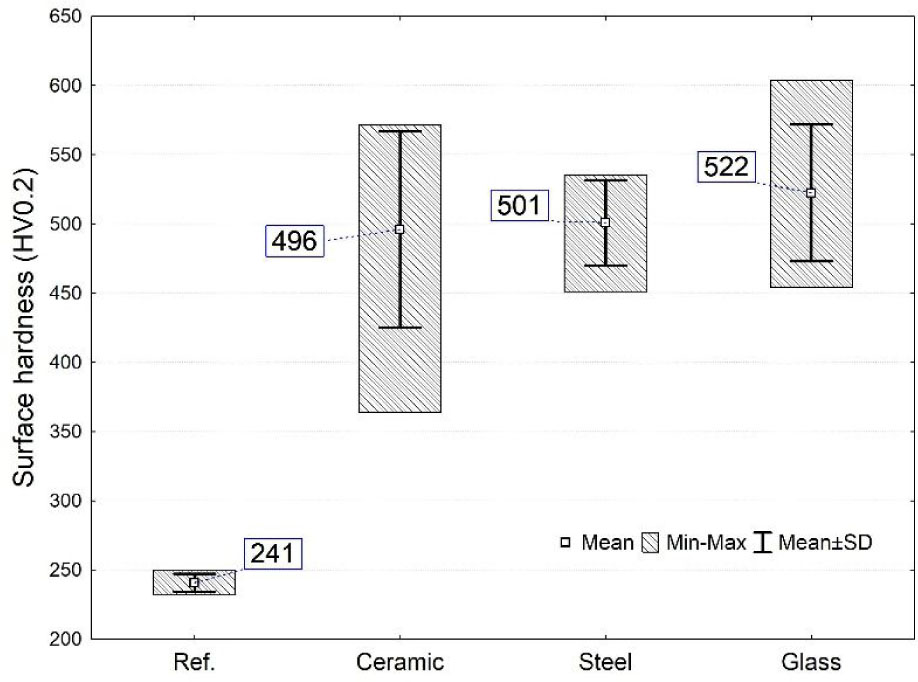
Fig. 4
Surface hardness of un-peened and shot peened 17-4PH
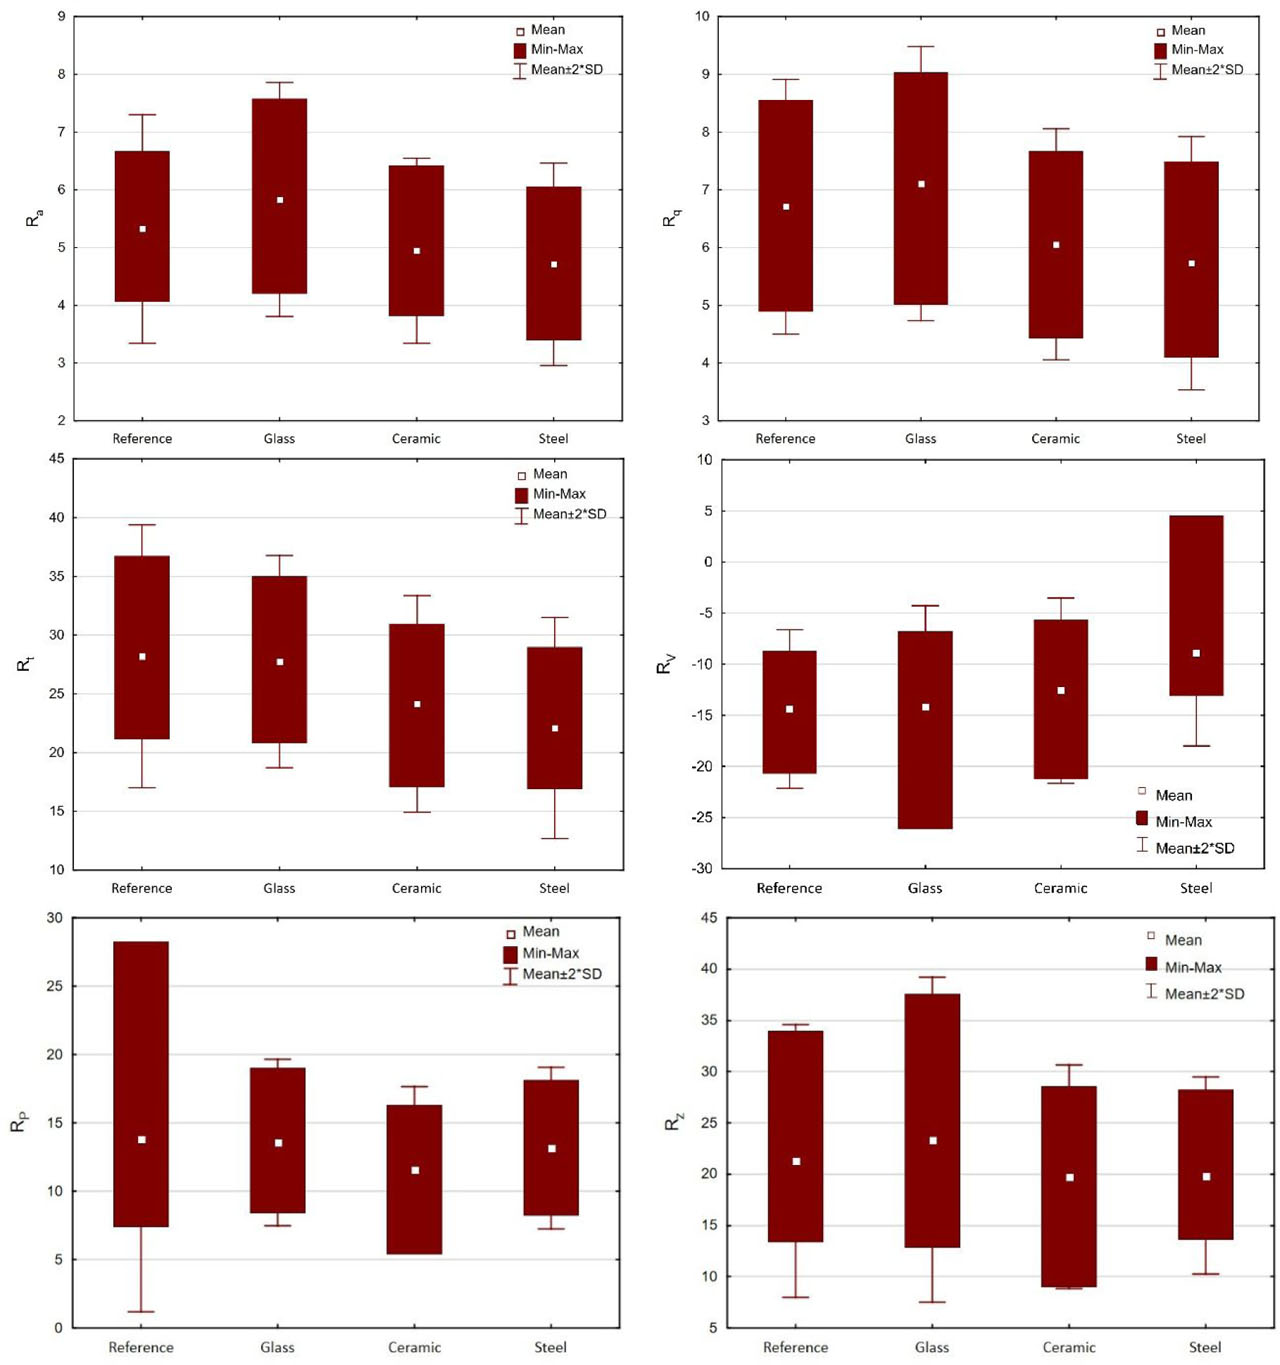
Fig. 5
Roughness parameters (A) Ra, (B) Rq, (C) Rt, (D) Rv, (E) Rp, and (F) Rz
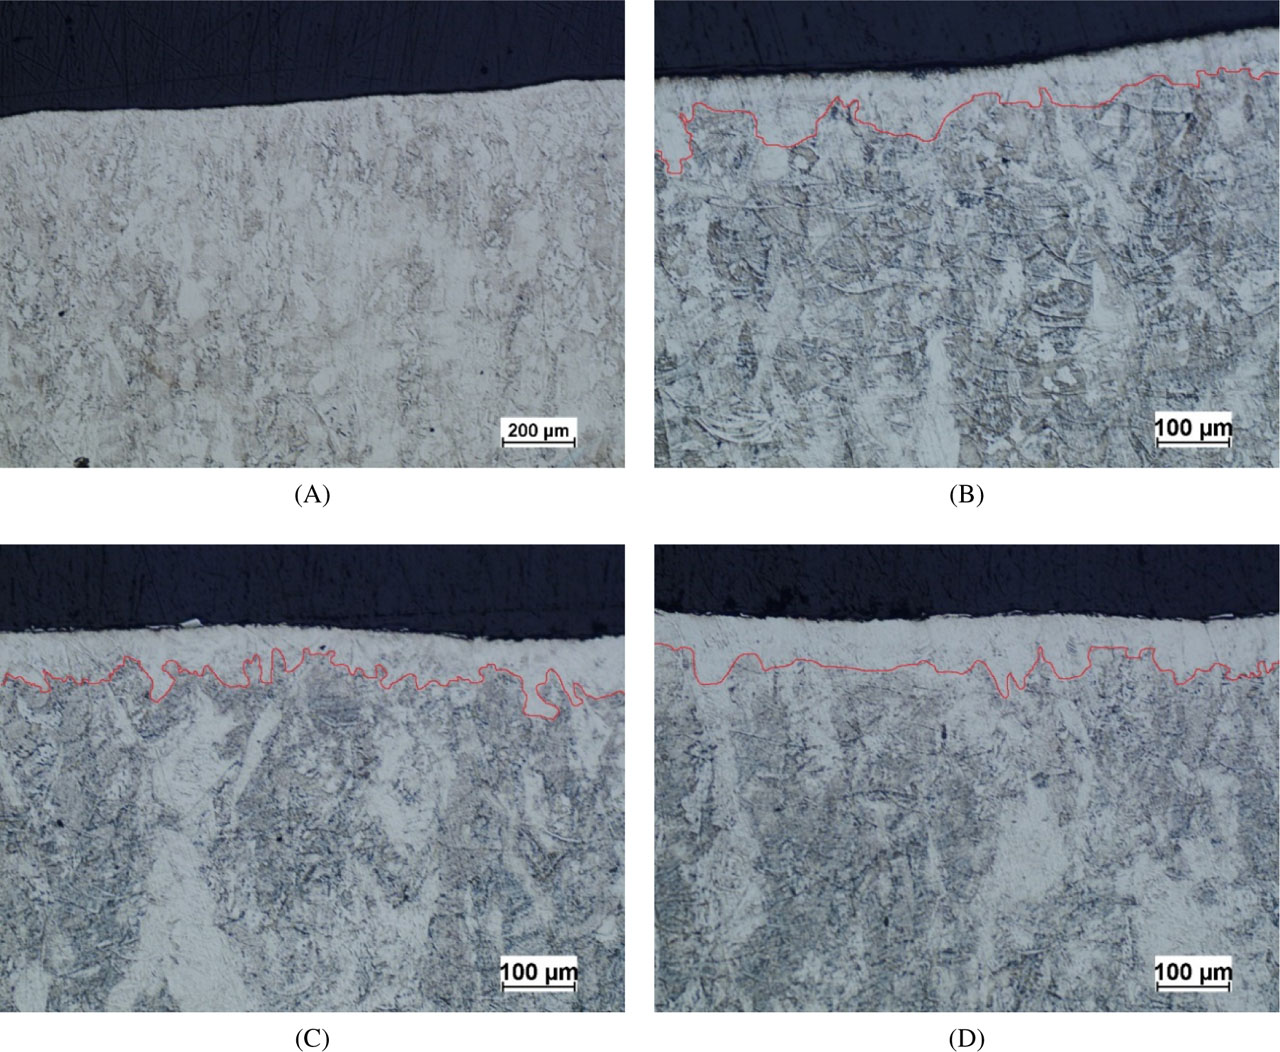
Fig. 6
The cross section of specimens showing modified surface layer after SP: (A) reference; (B) ceramic; (C) glass; (D) steel. SP, shot peening
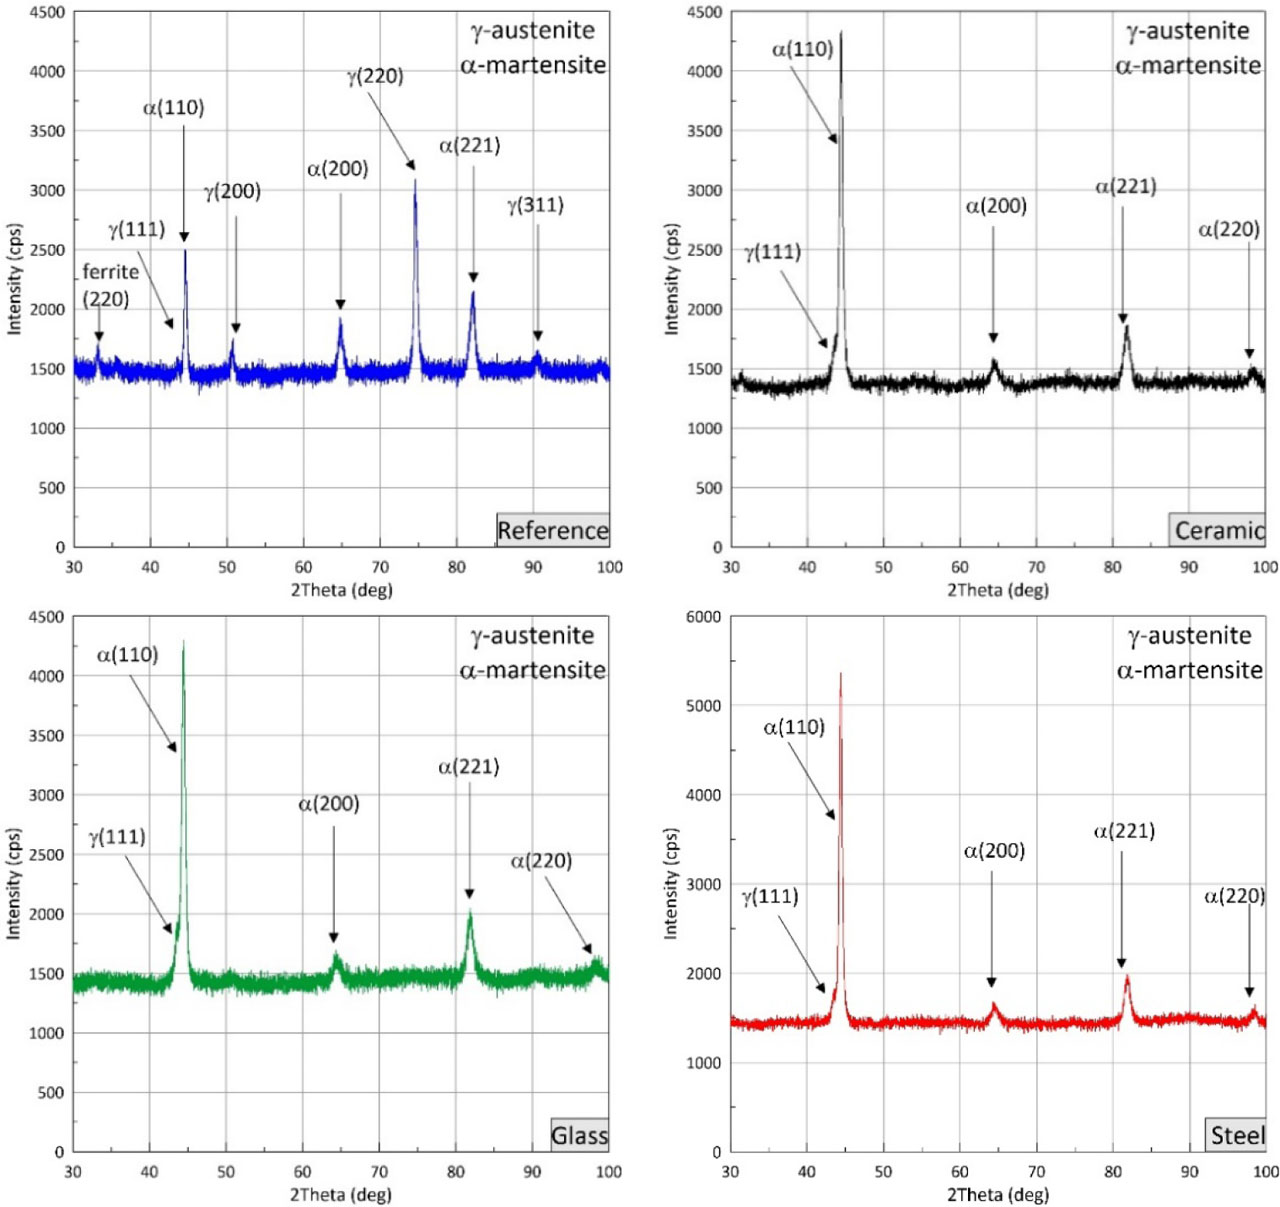
Fig. 7
Phase compositions of as-printed and shot peened samples, XRD. XRD, X-ray diffractometer
Table 3
Results of α-martensite crystallite size of un-penned and shoot penned 17-4PH steel using the ceramic, glass, and steel peening beads
| Specimen | Position, [°2Th.] | Crystallite size [nm] |
|---|---|---|
| Ref. | 44.53 (3) | 25 |
| Ceramic | 44.36 (2) | 16 |
| Glass | 44.40 (2) | 15 |
| Steel | 44.37 (2) | 19 |
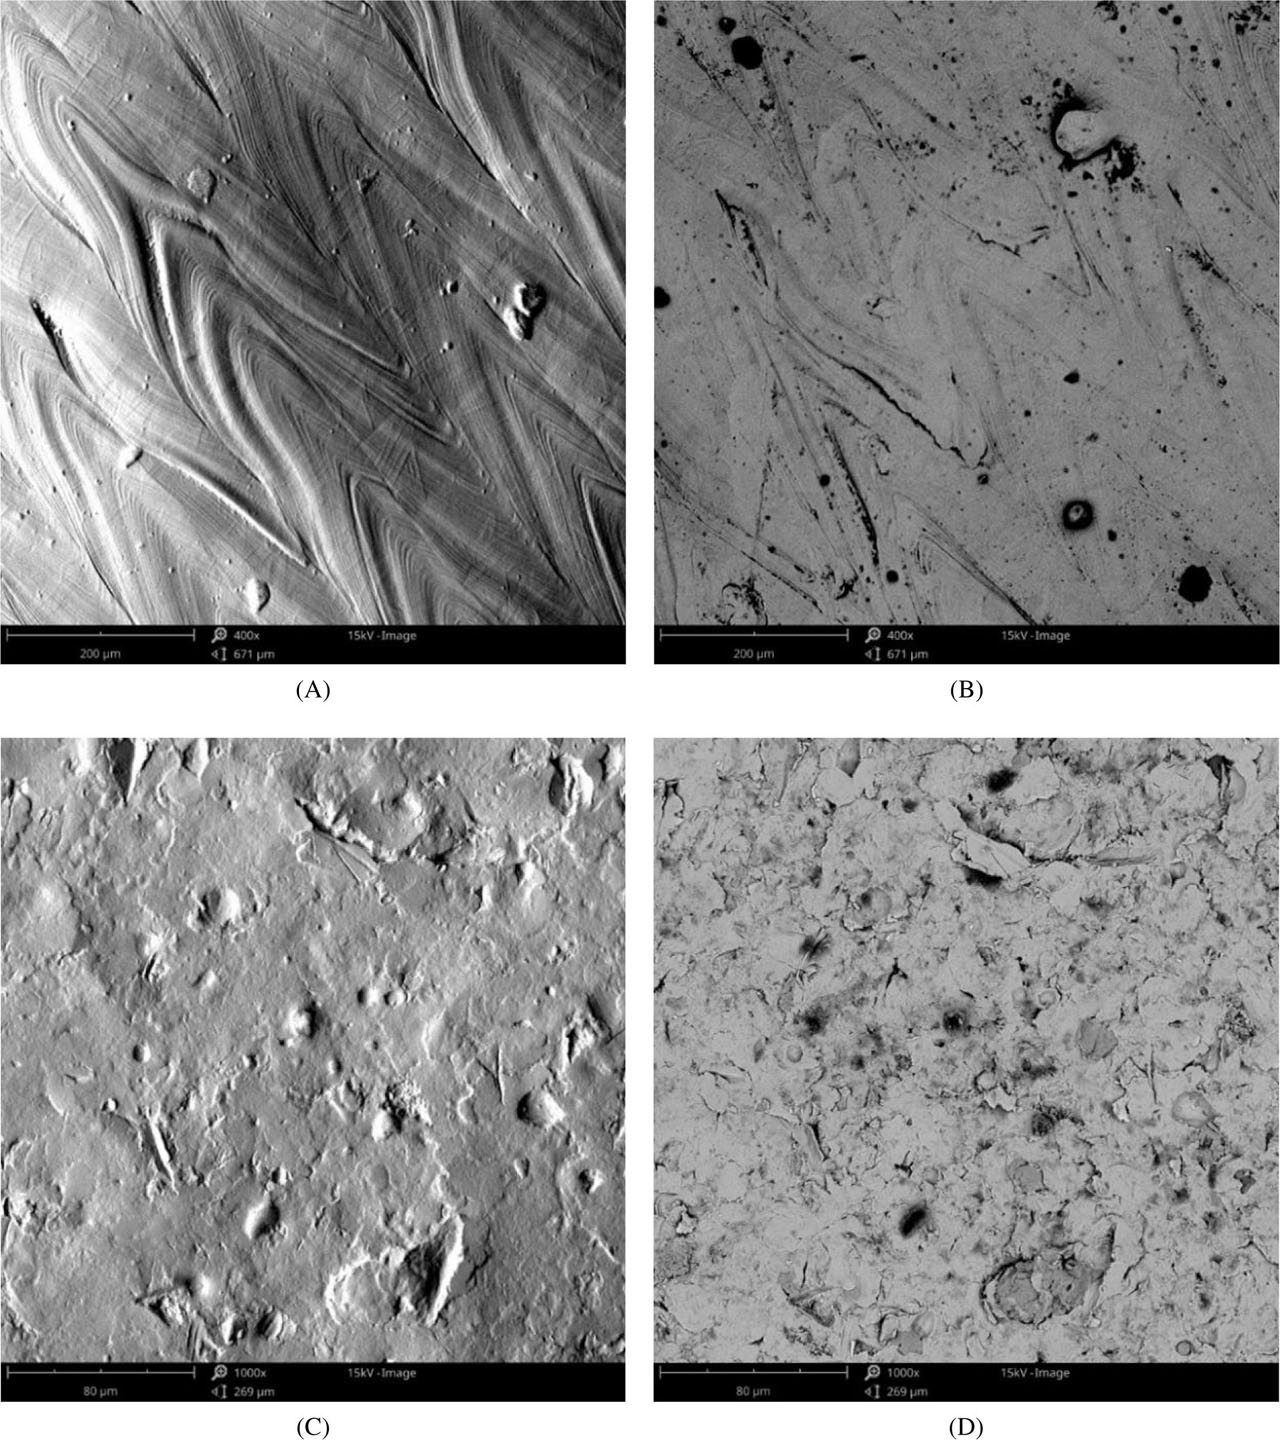
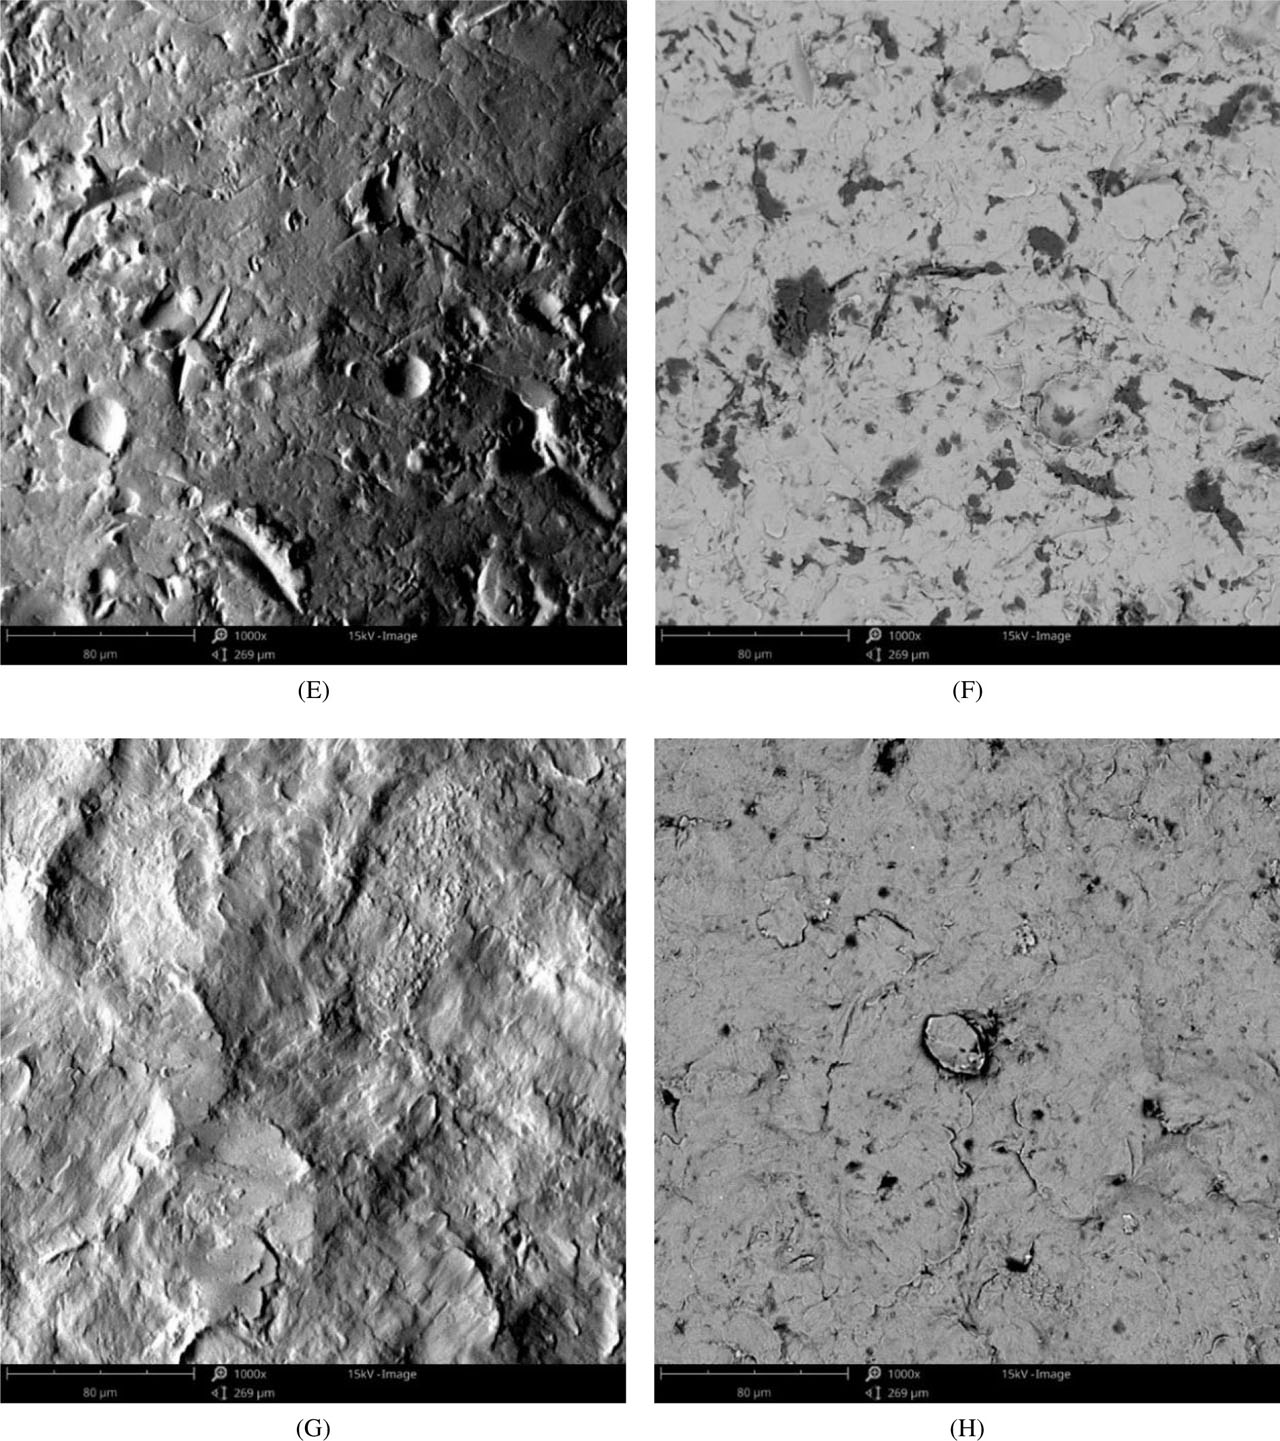
Fig. 8
Surface morphology of 17-4PH steel: (A) reference sample, SEM-topo mode; (B) reference, SEM-BSD mode; (C) ceramic, SEM-topo; (D) ceramic, BSD mode; (E) glass, SEM-topo; (F) glass, BSD mode; (G) steel SEM-topo; (H) steel, BSD mode. BSD, backscattered electrons; SEM, scanning electron microscopy
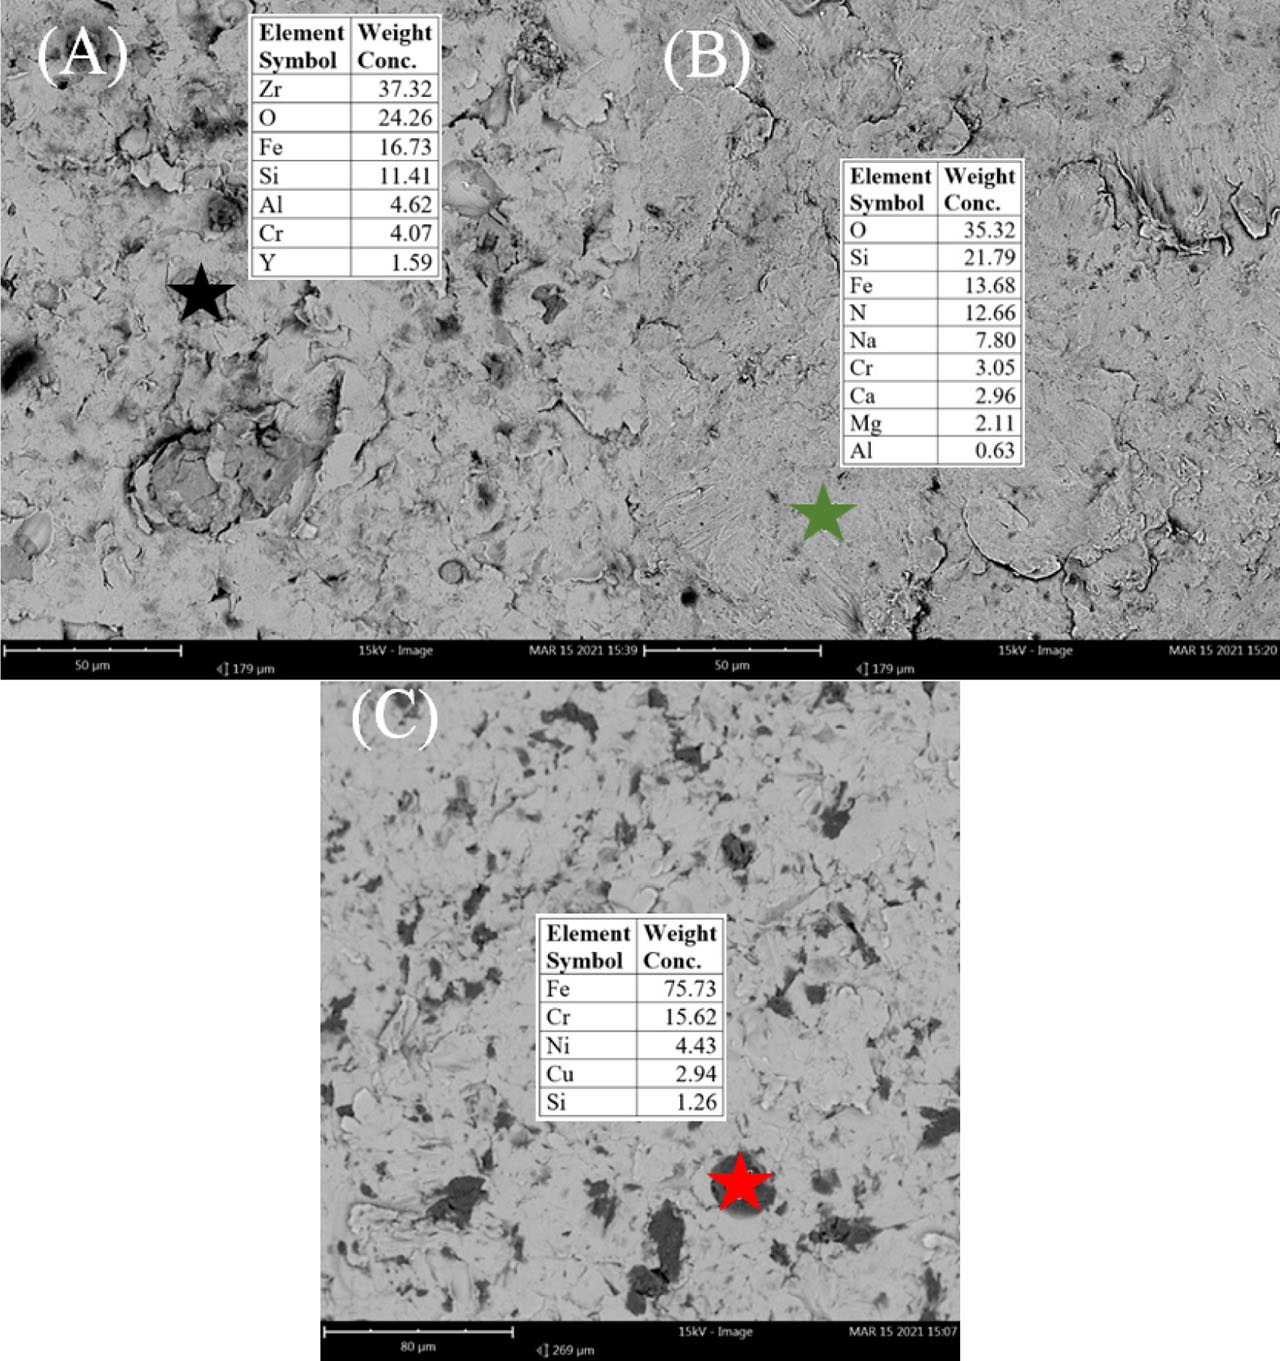
Fig. 9
Chemical composition spot analysis: (A) ceramic, (B) glass, (C) steel, SEM-EDS. EDS, energy dispersive X-ray spectroscopy; SEM, scanning electron microscopy
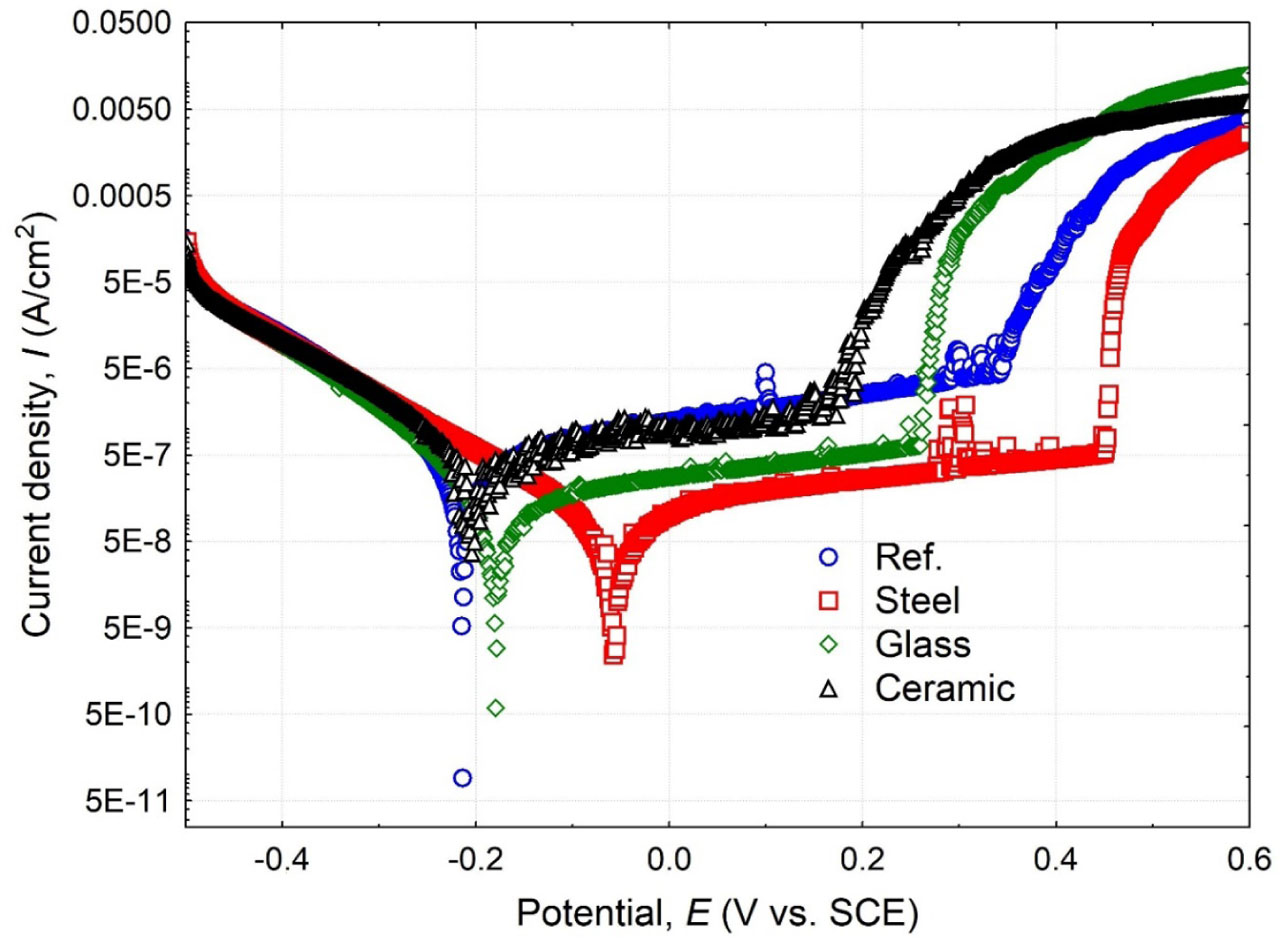
Fig. 10
Potentiodynamic polarization curves in 3.5% NaCl solution
Table 4
Electrochemical parameters of 17-4PH at different surface conditions in the 3.5 wt% NaCl solution
| Sample | Icorr (μA/cm2) | Ecorr (VSCE) | Epit (VSCE) |
|---|---|---|---|
| Ref. | 0.799 ± 0.011 | −0.214 ± 0.015 | 0.343 ± 0.018 |
| Ceramic | 0.660 ± 0.009 | −0.207 ± 0.012 | 0.165 ± 0.015 |
| Glass | 0.227 ± 0.007 | −0.180 ± 0.011 | 0.259 ± 0.021 |
| Steel | 0.019 ± 0.008 | −0.054 ± 0.012 | 0.462 ± 0.014 |
[i] SCE, saturated calomel electrode