
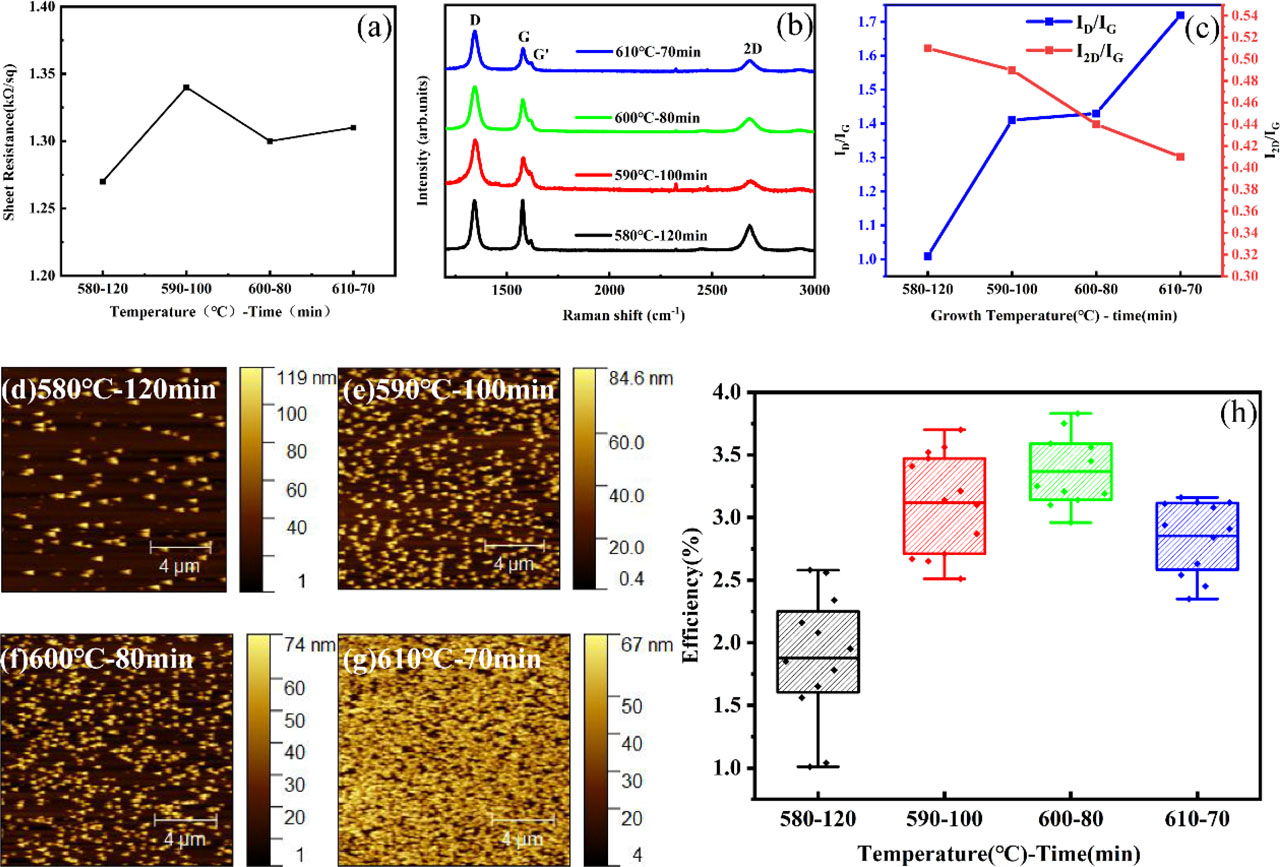
Fig. 1
The characterization is obtained when GNWs are grown at different growth temperatures and growth times. (A) Sheet resistance of the GNWs. (B) Raman spectra of the GNWs. (C) ID/IG ratio (blue curve) and I2D/IG ratio (red curve). (D–G) AFM image of the GNWs. (H) the efficiency distribution of the GNWs/Si solar cells. AFM, atomic force microscope; GNWs, growth graphene nanowalls
Table 1
A comparison of the present results with those of previous studies
| Device structure | Active area (cm2) | Sheet resistance (kΩ/sq) | Voc (V) | Jsc (mA/cm2) | FF (%) | PCE (%) |
|---|---|---|---|---|---|---|
| Gr-Uncertain silicon surface [15] | 0.09 | 0.9 | 0.35 | 28 | 36 | 3.5 |
| Gr-micropyramidal silicon [23] | - | 1.28 | 0.351 | 28.7 | 38 | 3.8 |
| Gr-polished silicon [17] | 0.3 | 0.8 | 0.4 | 21.99 | 34.79 | 3.5 |
| Gr-polished silicon [7] | 0.3 | 1.64 | 0.391 | 25.17 | 56.03 | 5.51 |
| Gr-polished silicon [20] | 0.9 | 3.38 | 0.395 | 18.91 | 42.7 | 3.19 |
| Present work | 0.45 | 1.3 | 0.399 | 23.1 | 41.52 | 3.83 |
[i] PCE, power conversion efficiency
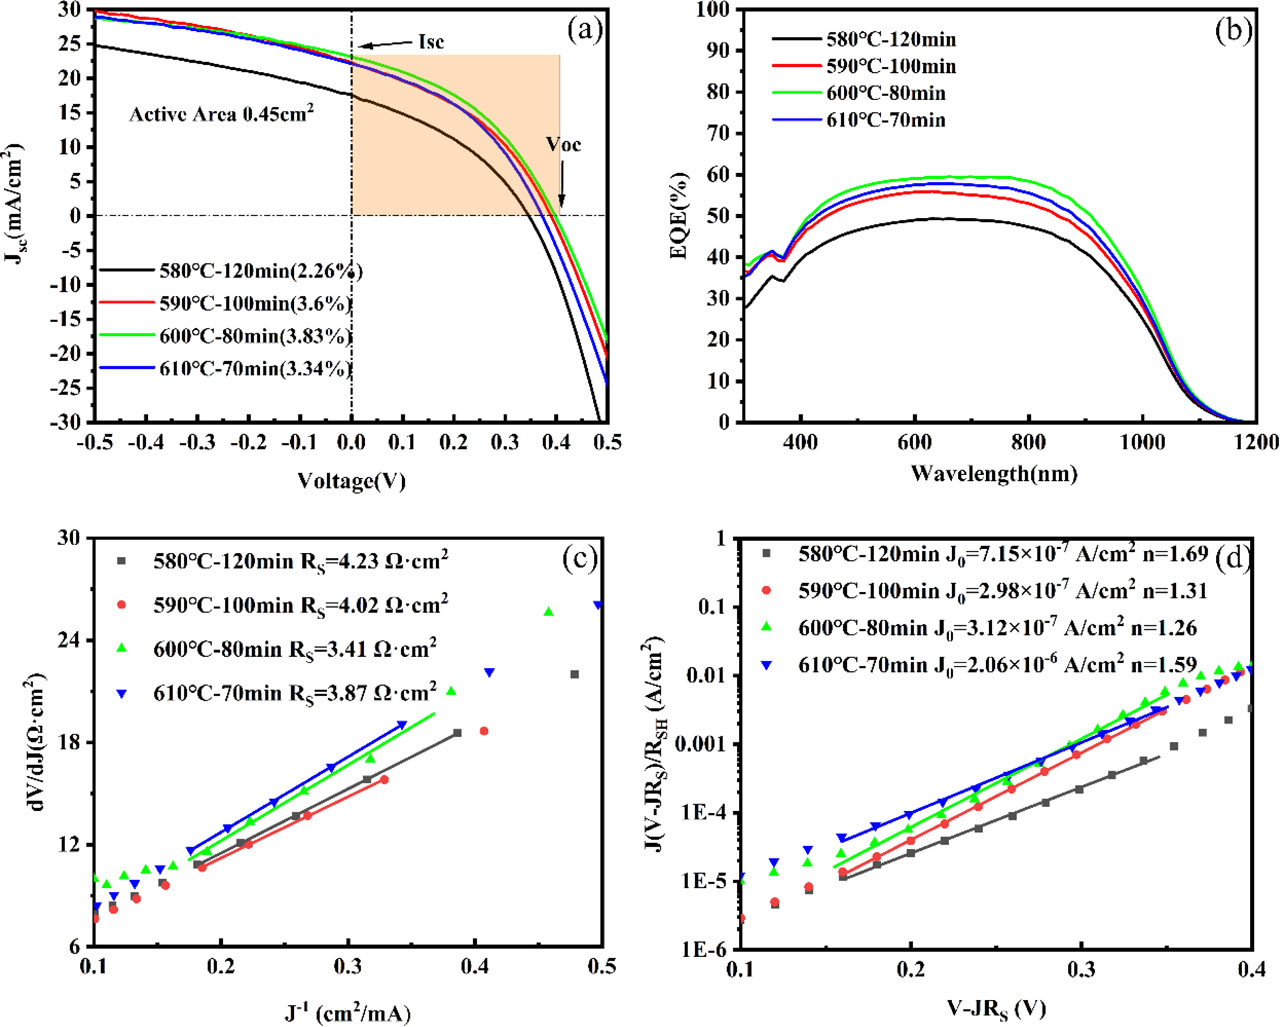
Fig. 2
Comparison of photovoltaic characteristics and performance parameters under different growth temperatures and growth times of direct-grown GNWs on bare silicon. (A) Light J–V characteristics of GNWs/Si solar cells. (B) EQE spectra of GNWs/Si solar cells. (C) The extraction of series resistance by plotting dV/dJ vs. J−1 in forward bias region. (D) The extraction of ideality factor n and reverse saturation current density J0 by plotting log[J + (J–VRS)/RSH] vs. (V-JRS) near forward bias region
Table 2
Parameters and photovoltaic properties of GNWs/Si solar cells under different growth temperatures and growth times
| Temperature (°C) – time (min) | Voc (V) | Jsc (mA/cm2) | FF (%) | PCE (%) |
|---|---|---|---|---|
| 580 – 120 | 0.346 | 17.51 | 37.28 | 2.26 |
| 590 – 100 | 0.391 | 22.25 | 41.39 | 3.6 |
| 600 – 80 | 0.399 | 23.1 | 41.52 | 3.83 |
| 610 – 70 | 0.37 | 22.1 | 40.9 | 3.34 |
[i] GNWs, growth graphene nanowalls,
[ii] PCE, power conversion efficiency
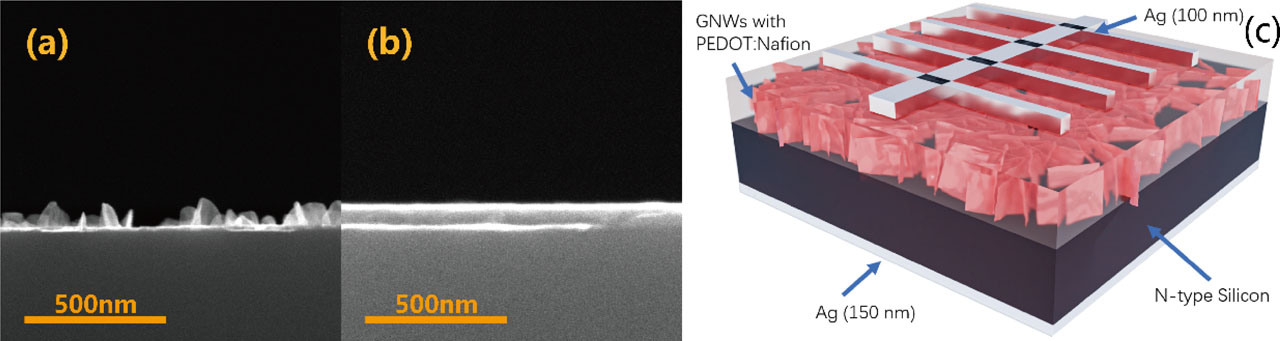
Fig. 3
SEM images of devices. (A) The cross-section of GNWs. (B) The cross-section of GNWs with PEDOT:Nafion coatings. (C) Device schematic to illustrate the structure of directly grown GNWs silicon Schottky junction solar cell after adding PEDOT: Nafion coating. GNWs, growth graphene nanowalls; SEM, scanning electron microscopy
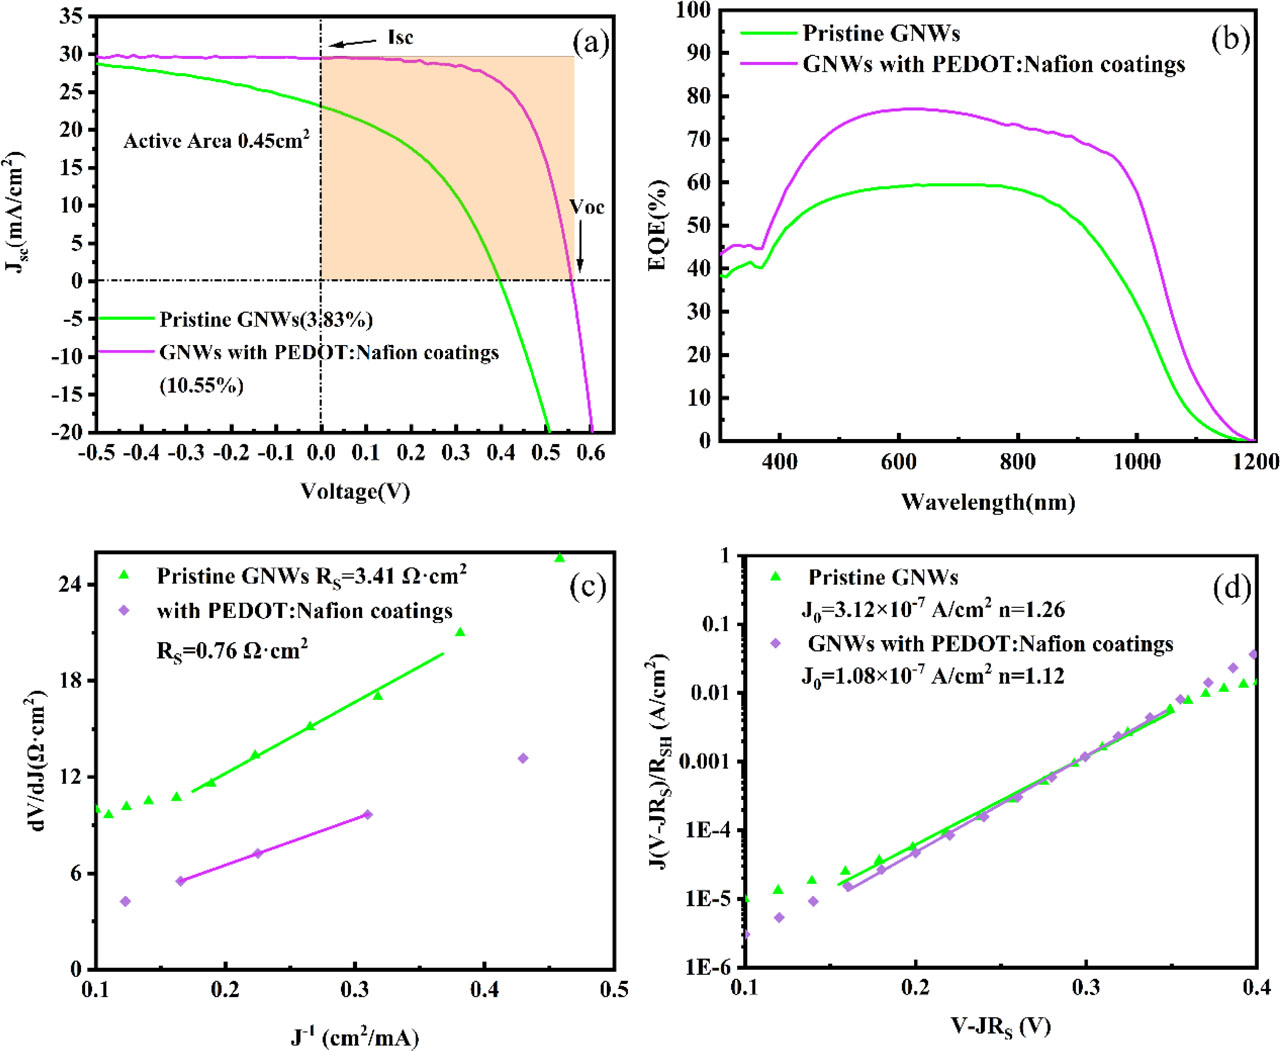
Fig. 4
(A) Light J–V characteristics (B) and EQE characterization of solar cells with PEDOT:Nafion coating and pristine GNWs. Dark state measurements of the GNWs/Si solar cells with and without PEDOT:Nafion coatings. (C) The extraction of series resistance by plotting dV/dJ vs. J−1 in forward bias region. (D) The extraction of ideality factor n and reverse saturation current density J0 by plotting log[J + (J–VRS)/RSH] vs. (V–JRS) near forward bias region. EQE, external quantum efficiency; GNWs, growth graphene nanowalls
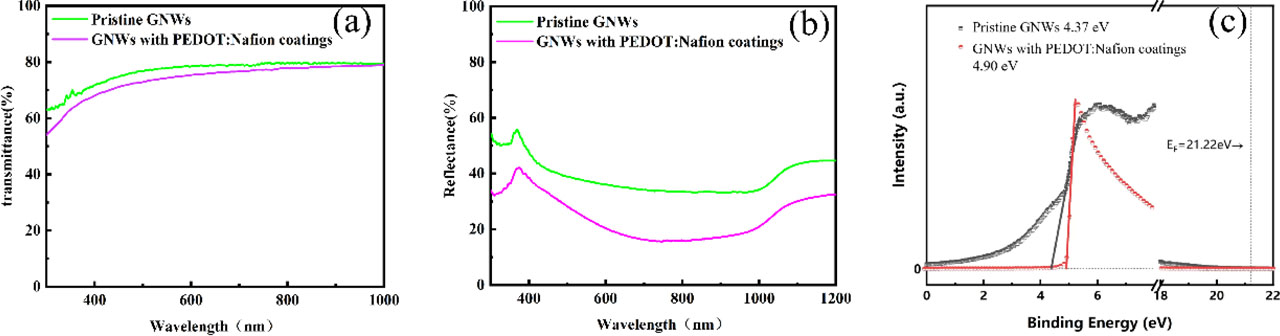
Fig. 5
(A) Transmittance and (B) reflection comparison of direct growth of GNWs and GNWs with PEDOT:Nafion coatings. (C) UPS results of GNWs with and without PEDOT:Nafion coatings. GNWs, growth graphene nanowalls; UPS, ultraviolet photoelectron spectroscopy