Fig. 1
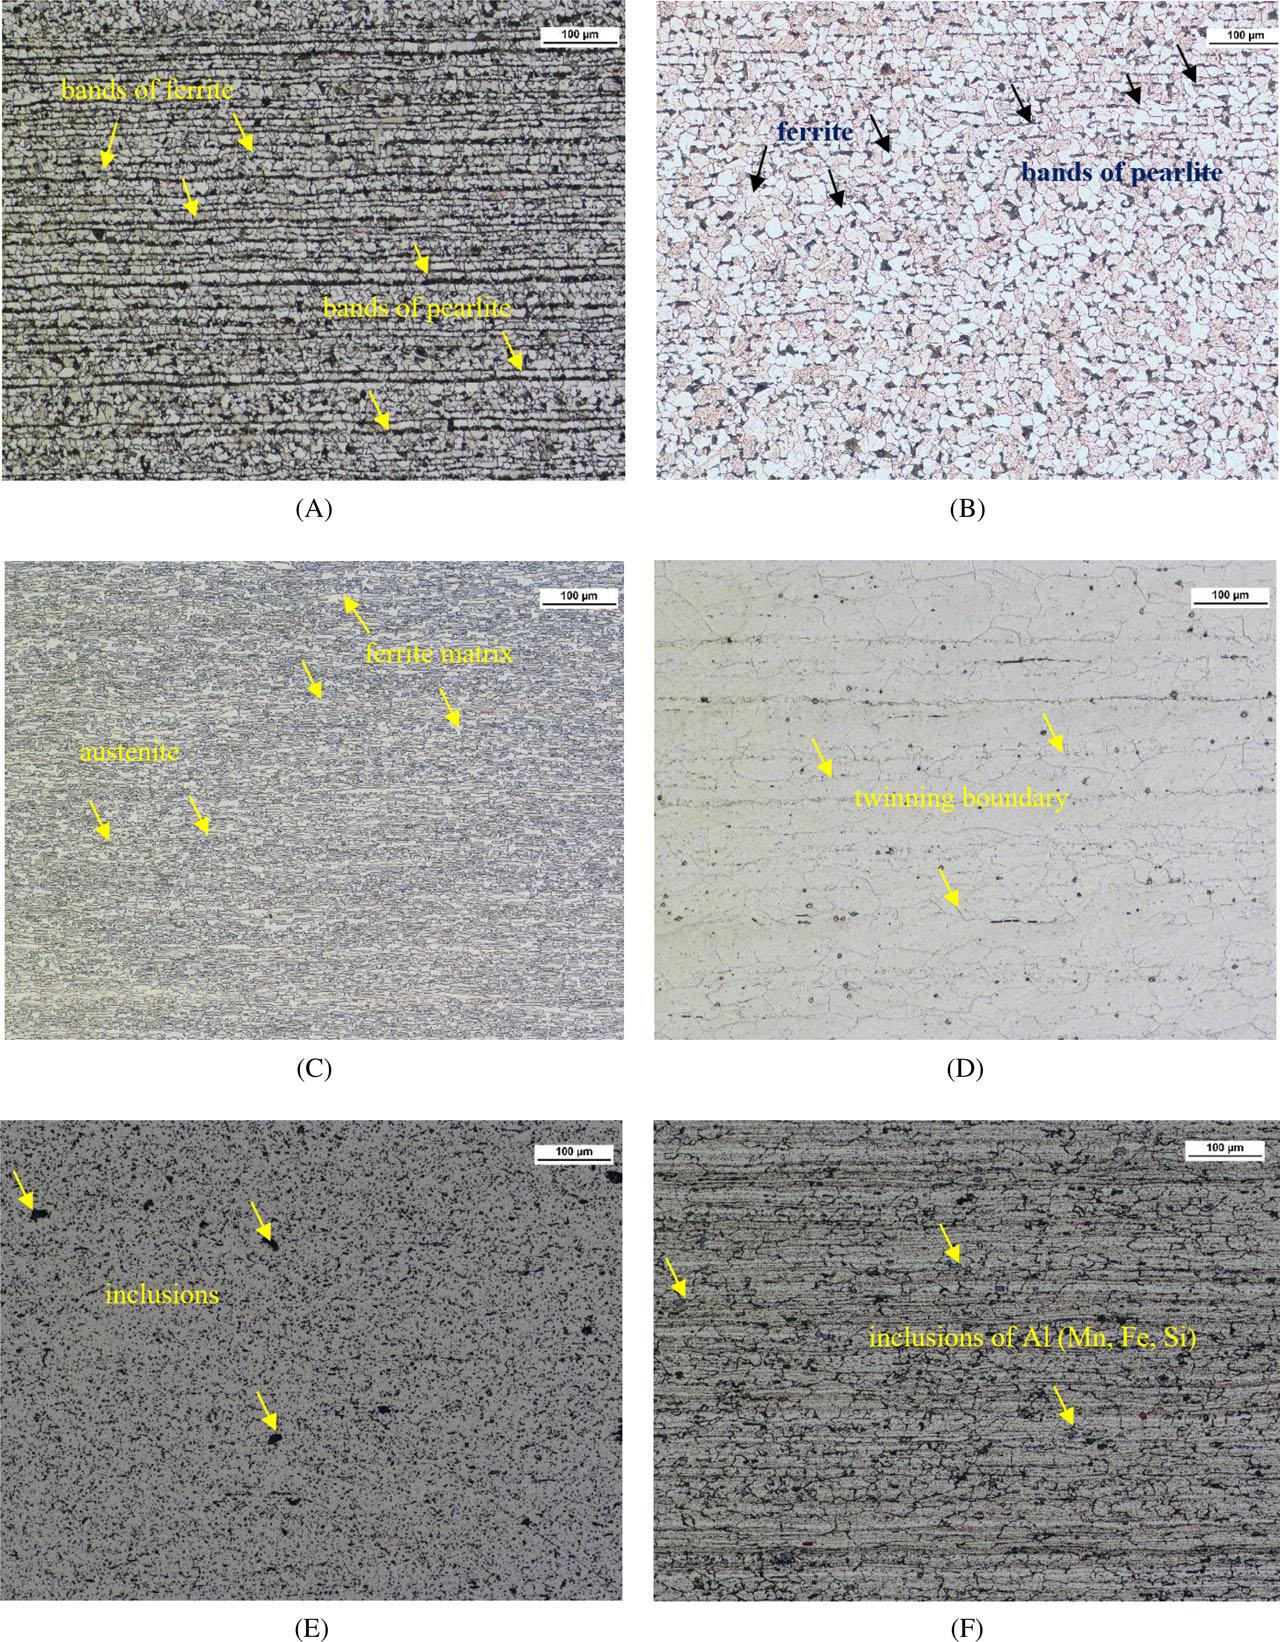
Fig. 2
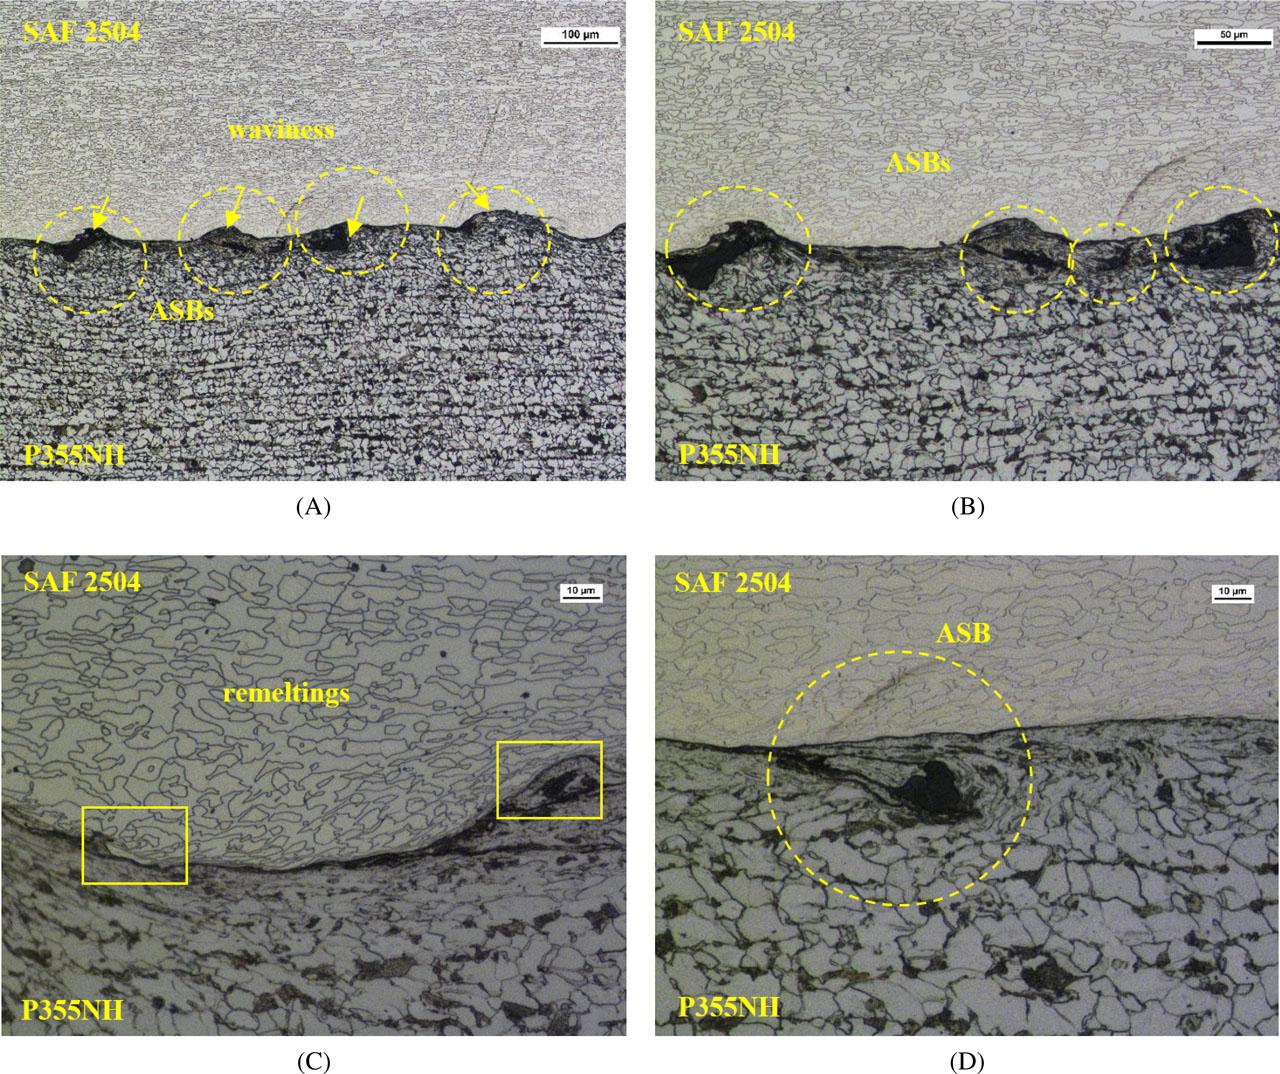
Fig. 3
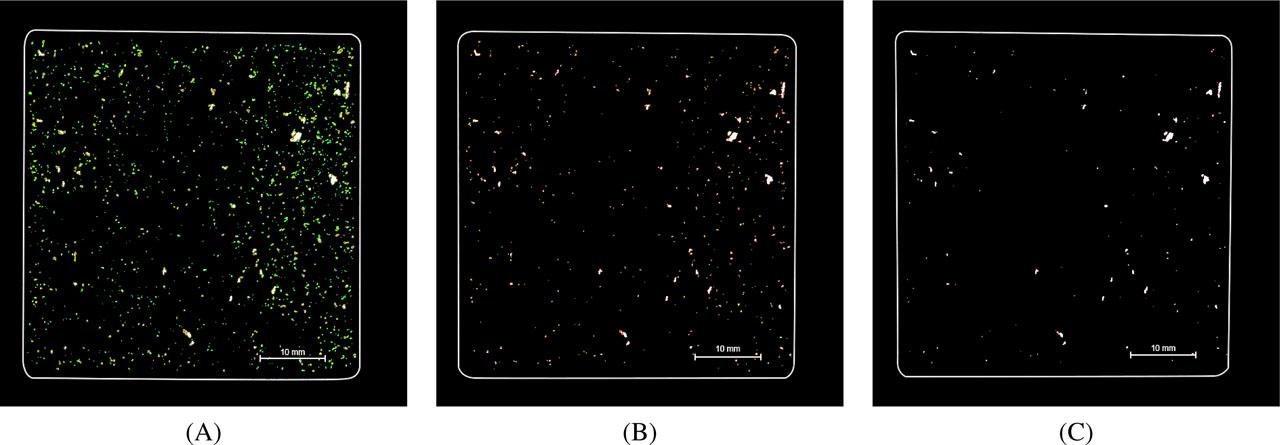
Fig. 4
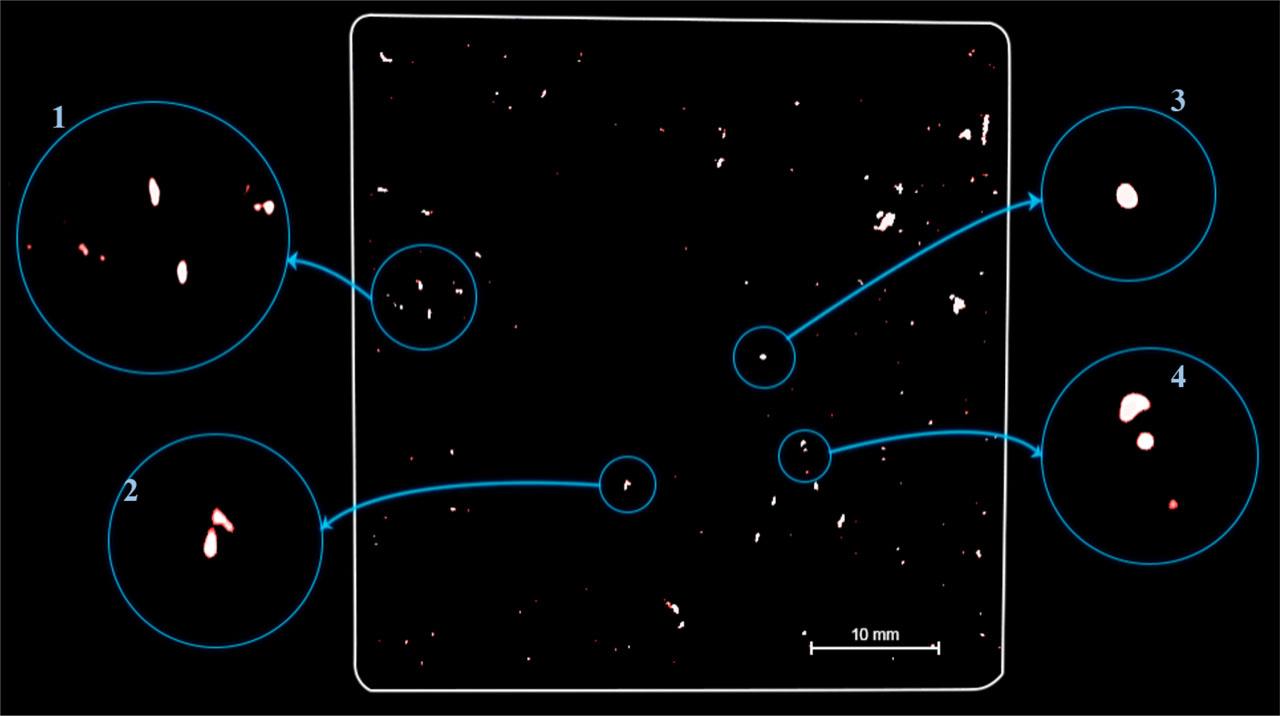
Fig. 5
Fig. 6
Fig. 7
Fig. 8
Fig. 9

Fig. 10

Fig. 11

Fig. 12
Fig. 13

Fig. 14

© 2022 Marcin Korzeniowski, Beata Białobrzeska, Anna Lewandowska, published by Wroclaw University of Science and Technology
This work is licensed under the Creative Commons Attribution-NonCommercial-NoDerivatives 4.0 License.