
Fig. 1
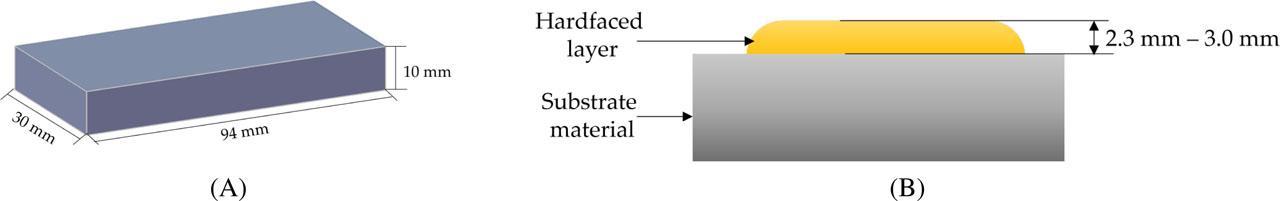
Fig. 2

Fig. 3

Fig. 4
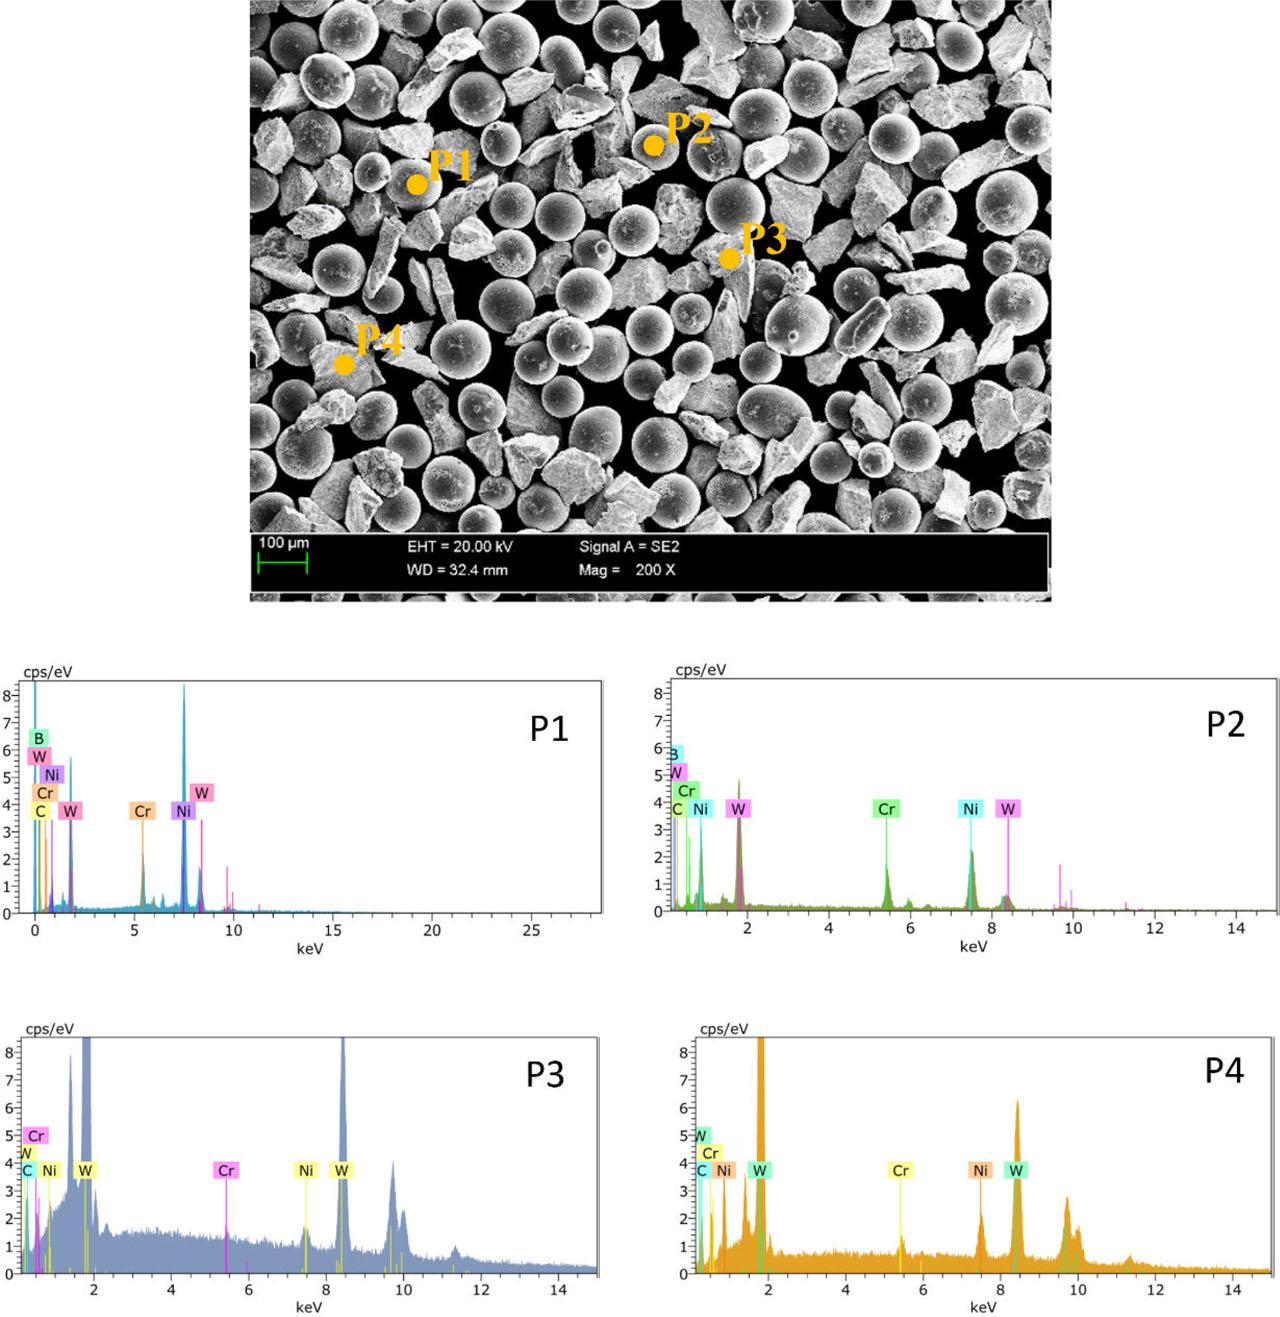
Fig. 5

Fig. 6
Fig. 7
Fig. 8

Fig. 9

Fig. 10
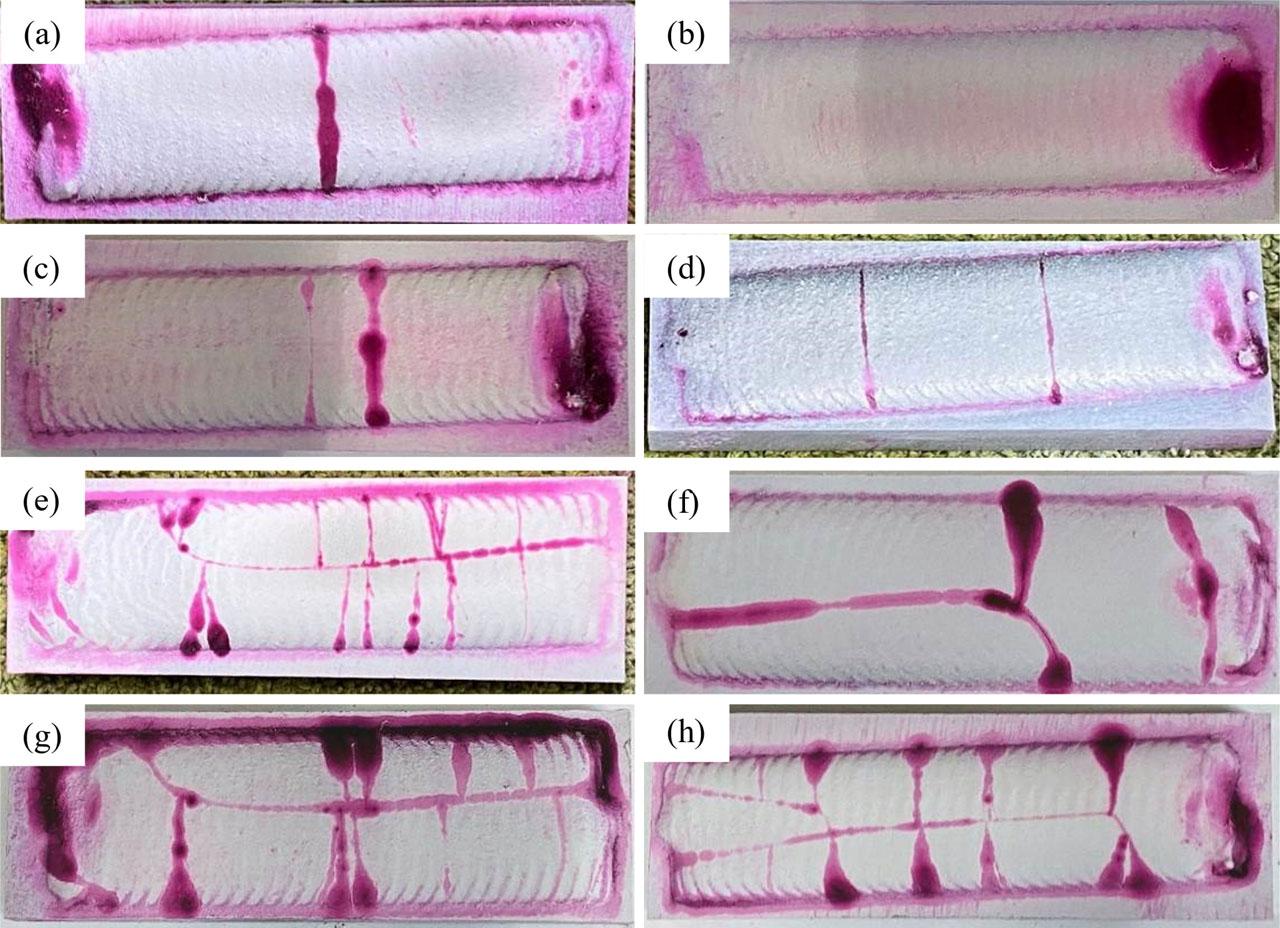
Fig. 11
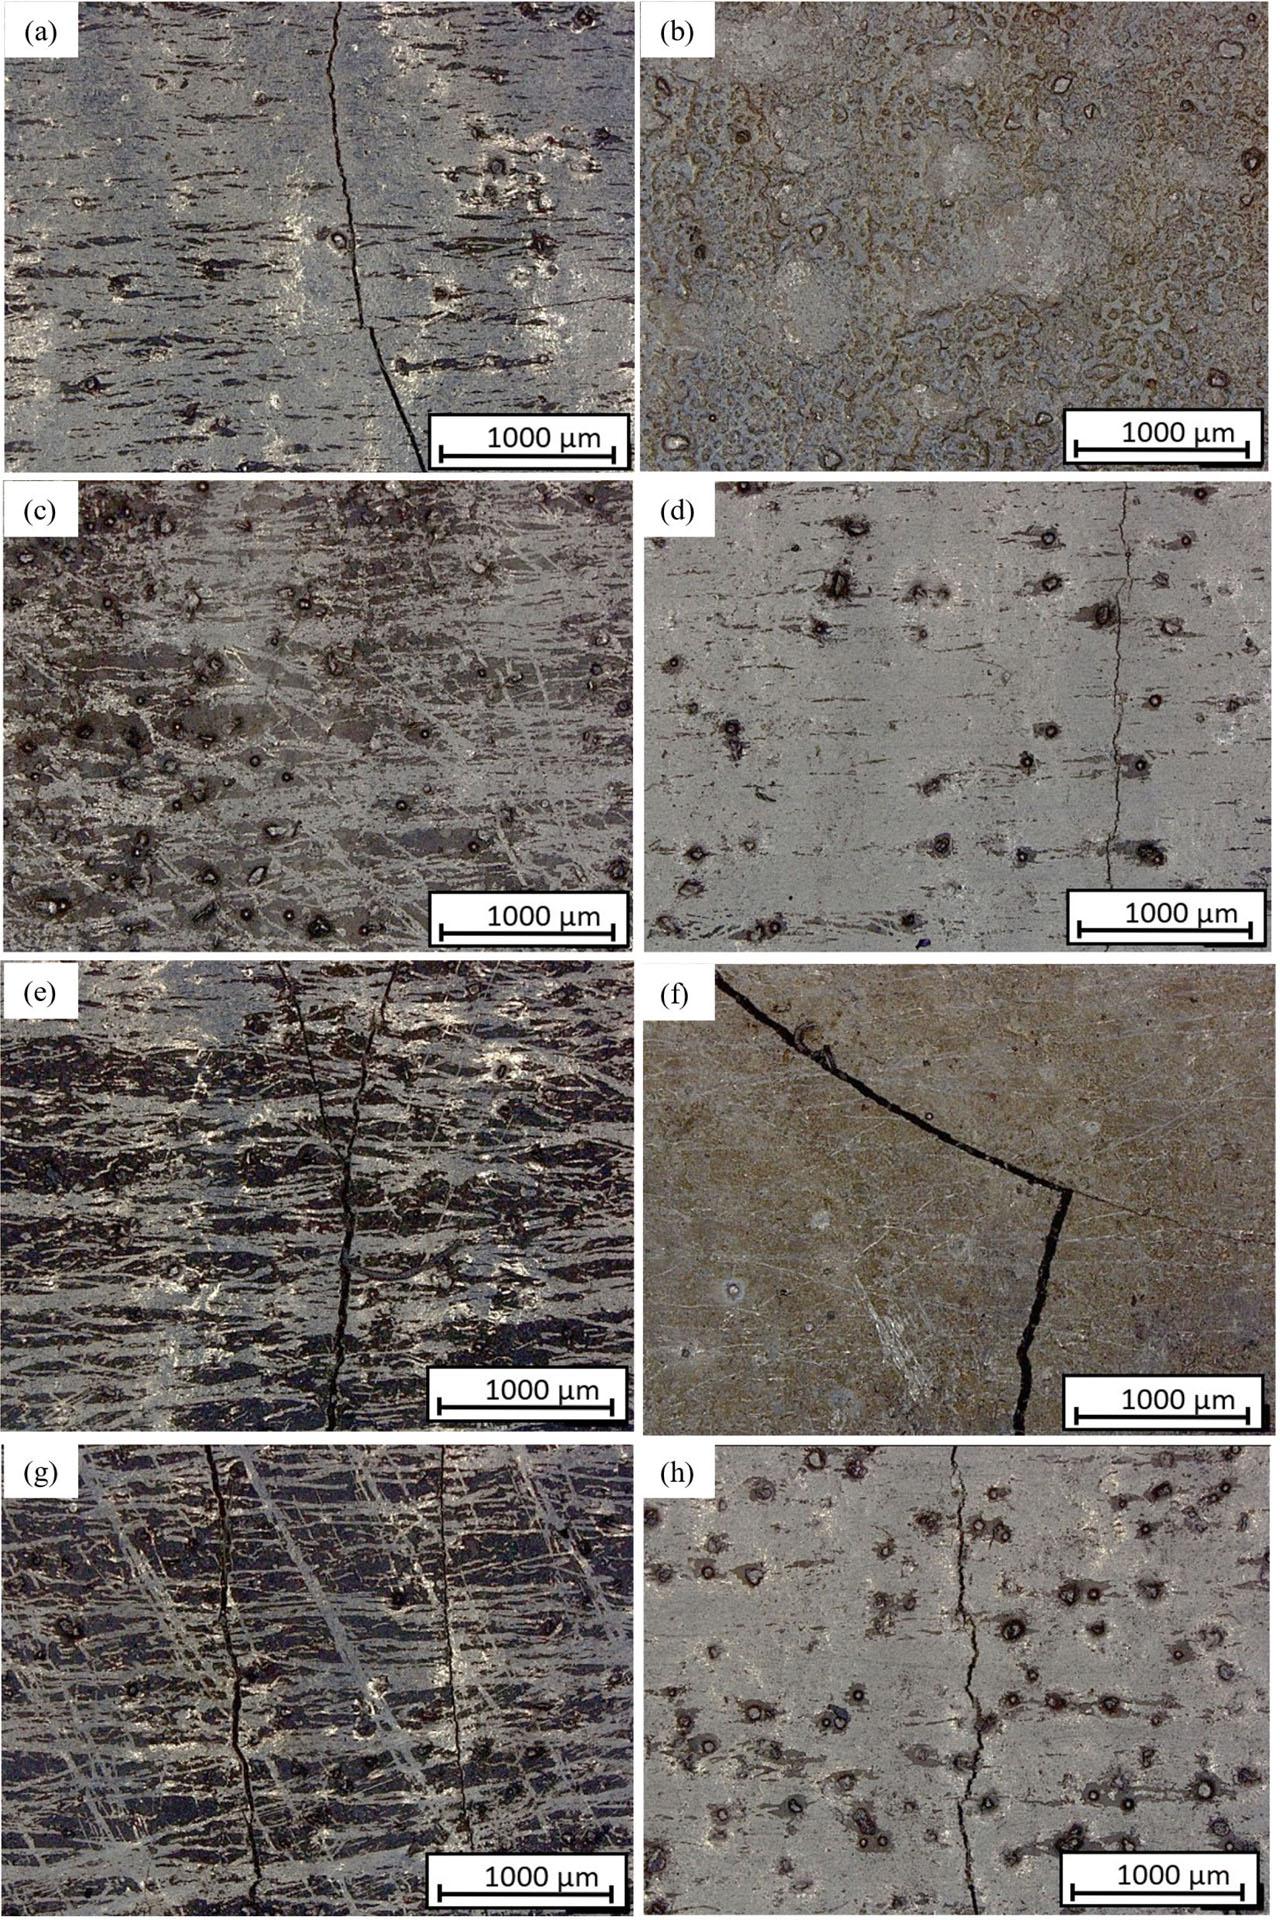
Fig. 12

Fig. 13
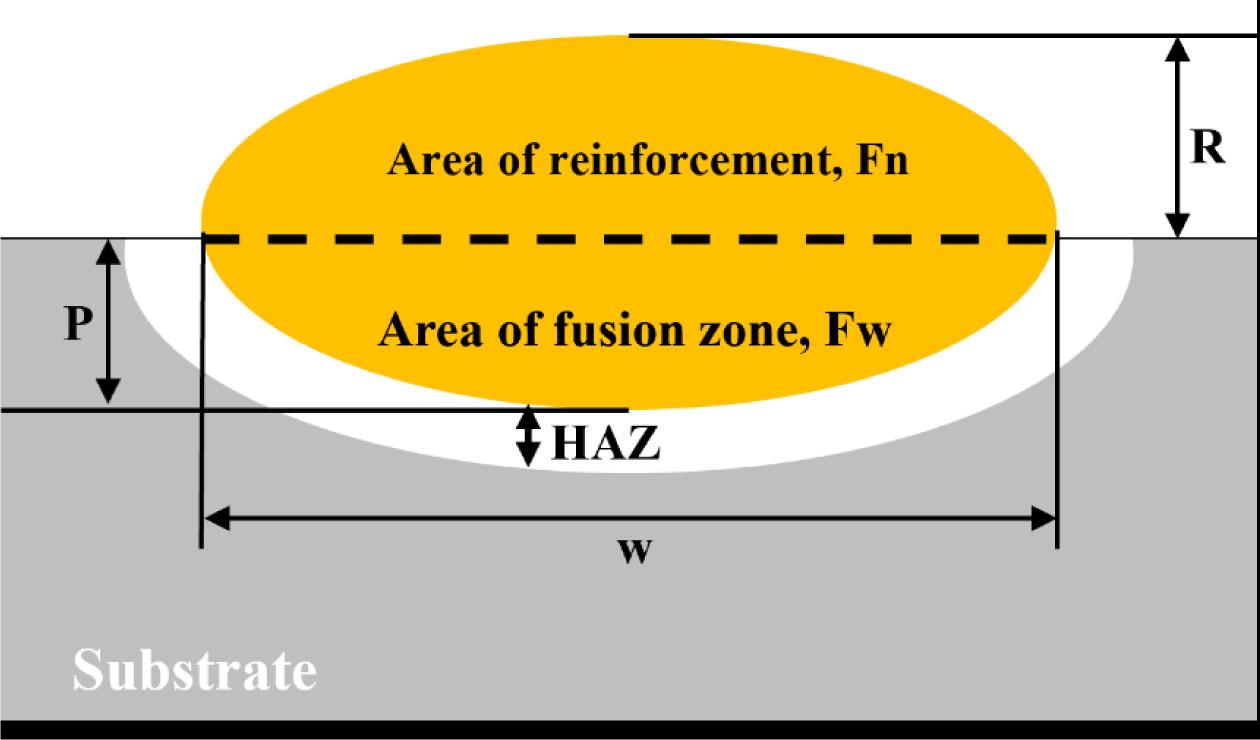
Fig. 14

Chemical composition of PE 8214 MMC powder
| Measured Point | Ni | Cr | B | W | C | |
|---|---|---|---|---|---|---|
| P1 | Weight% | 61 | 5 | 1 | 30 | 3 |
| Atom% | 64 | 6 | 7 | 10 | 13 | |
| P2 | Weight% | 42 | 9 | 2 | 44 | 3 |
| Atom% | 45 | 10 | 13 | 15 | 17 | |
| P3 | Weight% | 1 | - | - | 96 | 3 |
| Atom% | 2 | - | - | 69 | 29 | |
| P4 | Weight% | 4 | - | - | 92 | 3 |
| Atom% | 9 | 2 | - | 62 | 27 | |
Chemical composition of PG 6503 MMC powder
| Measured point | Ni | B | W | C | |
|---|---|---|---|---|---|
| P1 | Weight% | 76 | 1 | 22 | 1 |
| Atom% | 85 | 4 | 8 | 3 | |
| P2 | Weight% | 75 | 1 | 23 | 1 |
| Atom% | 81 | 6 | 8 | 6 | |
| P3 | Weight% | 1 | - | 96 | 3 |
| Atom% | 1 | - | 66 | 32 | |
| P4 | Weight% | 1 | - | 97 | 2 |
| Atom% | 2 | - | 74 | 24 | |
Geometrical properties and dilution ratio of prepared hardfaced layers
| Sample ID | Layer height, R (mm) | Penetration depth, P (mm) | Layer width, w (mm) | Dilution, D (%) |
|---|---|---|---|---|
| PG-1 | 2.9 | 0.2 | 23 | 1.1 |
| PG-2 | 2.7 | 0.5 | 24 | 4.5 |
| PG-3 | 1.7 | 0.3 | 23 | 3.7 |
| PG-4 | 2.2 | 0.4 | 24 | 4.3 |
| PE-5 | 2.2 | 0.2 | 24 | 0.9 |
| PE-6 | 2.6 | 0.4 | 23 | 2.1 |
| PE-7 | 2.8 | 1.4 | 25 | 7.8 |
| PE-8 | 3.0 | 1.0 | 25 | 6.6 |
Results of the metal-mineral abrasive wear resistance tests concerning the surface layer PPTAW deposition of NiSiB + 60% WC and NiCrSiB + 45% WC composite powders on mild steel in comparison with the abrasive wear resistance of abrasion-resistant steel AR400
| Sample ID | Test No. | Mass before test (g) | Mass after test (g) | Mass loss (g) | Average mass loss (g) | Material density (g/cm3) | Average volume loss (mm3) | Relative abrasive wear resistance* |
|---|---|---|---|---|---|---|---|---|
| PTAW hardfaced layer (NiSiB + 60% WC) | ||||||||
| PG-1 | 1 | 197.9632 | 197.6236 | 0.3396 | 0.3154 | 11.1935 | 28.1771 | 4.7 |
| 2 | 193.3204 | 193.0292 | 0.2912 | |||||
| PG-2 | 1 | 206.7898 | 206.5573 | 0.2325 | 0.2567 | 11.1935 | 22.9329 | 5.7 |
| 2 | 211.2178 | 210.9369 | 0.2809 | |||||
| PG-3 | 1 | 198.3808 | 197.9687 | 0.4121 | 0.3689 | 11.1935 | 32.9566 | 4.0 |
| 2 | 193.7380 | 193.4123 | 0.3257 | |||||
| PG-4 | 1 | 225.5144 | 225.2207 | 0.2937 | 0.3179 | 11.1935 | 28.4004 | 4.7 |
| 2 | 230.1572 | 229.8151 | 0.3421 | |||||
| PTAW hardfaced layer (NiCrSiB + 45% WC) | ||||||||
| PE-5 | 1 | 228.8165 | 228.4868 | 0.3297 | 0.3539 | 9.8274 | 36.0116 | 3.7 |
| 2 | 224.1737 | 223.7956 | 0.3781 | |||||
| PE-6 | 1 | 226.3483 | 226.0148 | 0.3335 | 0.3093 | 9.8274 | 31.4732 | 4.2 |
| 2 | 230.9911 | 230.7060 | 0.2851 | |||||
| PE-7 | 1 | 229.3361 | 228.4298 | 0.9063 | 0.7821 | 9.8274 | 79.5836 | 1.7 |
| 2 | 233.9789 | 233.321 | 0.6579 | |||||
| PE-8 | 1 | 224.0304 | 223.6803 | 0.3501 | 0.3742 | 9.8274 | 38.0772 | 3.5 |
| 2 | 219.3876 | 218.9893 | 0.3983 | |||||
| Reference material – AR400 steel 4 | ||||||||
| H1 | 104.6219 | 103.4971 | 1.1248 | 1.0318 | 7.7836 | 132.5607 | 1.0 | |
| H2 | 111.7377 | 110.7989 | 0.9388 | |||||
Microhardness across the cross-section of hardfaced layers
| Sample ID | Microhardness of matrix, HV | Microhardness of carbides, HV | ||
|---|---|---|---|---|
| Mean | Standard deviation | Mean | Standard deviation | |
| PG-1 | 591 | 5.2 | 2,413 | 62.9 |
| PG-2 | 573 | 10.2 | 2,129 | 33.3 |
| PG-3 | 687 | 2.4 | 2,163 | 76.1 |
| PG-4 | 673 | 18.5 | 2,275 | 49.5 |
| PE-5 | 889 | 18.0 | 2,349 | 38.7 |
| PE-6 | 845 | 23.2 | 2,436 | 24.1 |
| PE-7 | 889 | 23.8 | 2,343 | 61.6 |
| PE-8 | 893 | 16.1 | 2,391 | 80.5 |
Surface hardness of hardfaced layers
| Specimen | Rockwell hardness (HRC) | |
|---|---|---|
| Mean | Standard deviation | |
| PG-1 | 46.3 | 0.5 |
| PG-2 | 47.3 | 2.6 |
| PG-3 | 47.7 | 2.5 |
| PG-4 | 48.3 | 1.2 |
| PE-5 | 58.3 | 3.7 |
| PE-6 | 52.7 | 3.3 |
| PE-7 | 55.3 | 2.9 |
| PE-8 | 55.7 | 1.2 |
PTAW parameters for sample preparation
| Coating/sample ID | Powder used | Current (A) | Travel speed, V (mm/s) | PGFR (l/min) |
|---|---|---|---|---|
| PG-1 | PG 6503 | 110 | 1.3 | 1.0 |
| PG-2 | PG 6503 | 110 | 1.3 | 1.2 |
| PG-3 | PG 6503 | 150 | 1.3 | 1.2 |
| PG-4 | PG 6503 | 110 | 1.3 | 1.5 |
| PE-5 | PE 8214 | 110 | 1.3 | 1.0 |
| PE-6 | PE 8214 | 110 | 1.3 | 1.2 |
| PE-7 | PE 8214 | 150 | 1.3 | 1.2 |
| PE-8 | PE 8214 | 110 | 1.3 | 1.5 |