
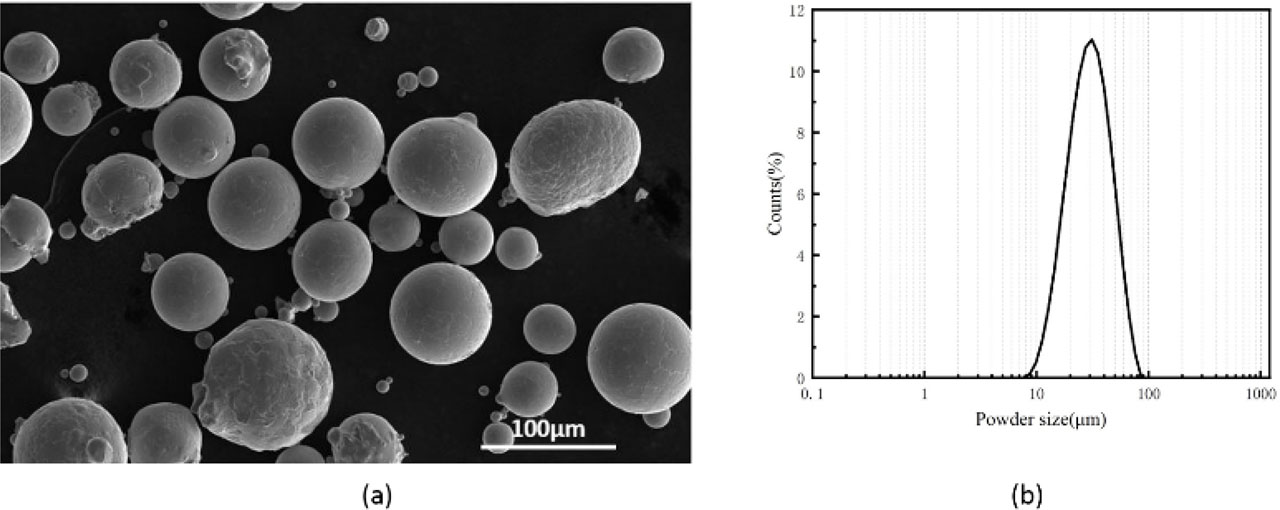
Fig. 1
SEM (A) and particle size distribution (B) of 18Ni300 powder
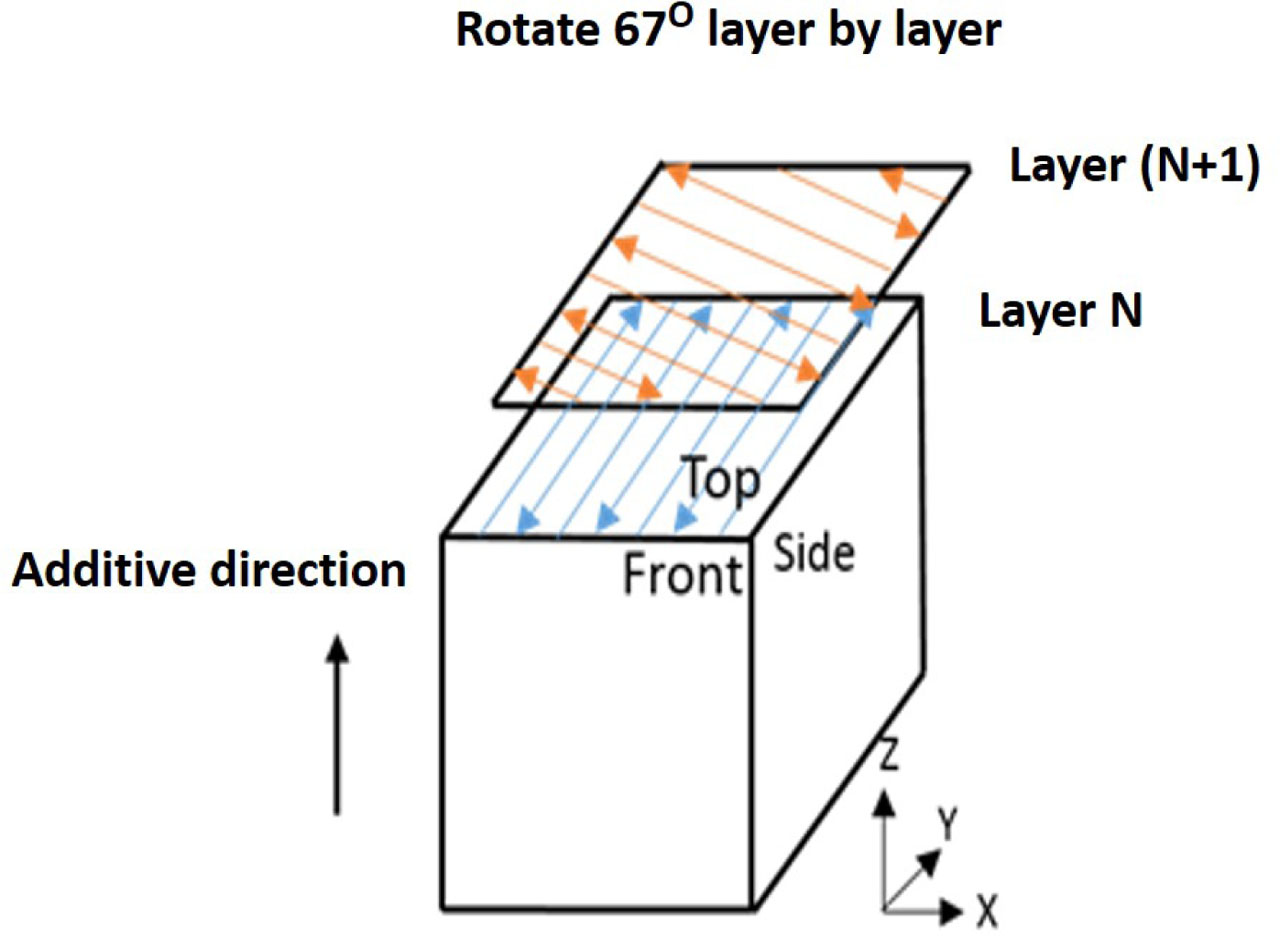
Fig. 2
Illustration of the laser scanning strategy
Table 1
Comparison of the chemical composition of declared, powder, and as-fabricated 18Ni300
| Element, wt.% | Ni | Mo | Co | Ti | Cr | C | Si | Mn |
|---|---|---|---|---|---|---|---|---|
| Powder | 17.8 | 4.5 | 8.6 | 1 | 0.11 | <0.01 | <0.032 | 0.002 |
Table 2
Formation process parameters of the 18Ni300 powder
| Laser power (W) | Scanning speed (mm/s) | Path spacing (mm) | Layer thickness (μm) |
|---|---|---|---|
| 270 | 1,000 | 0.11 | 50 |
| 300 | 1,000 | 0.11 | 50 |
| 330 | 1,000 | 0.11 | 50 |
| 360 | 1,000 | 0.11 | 50 |
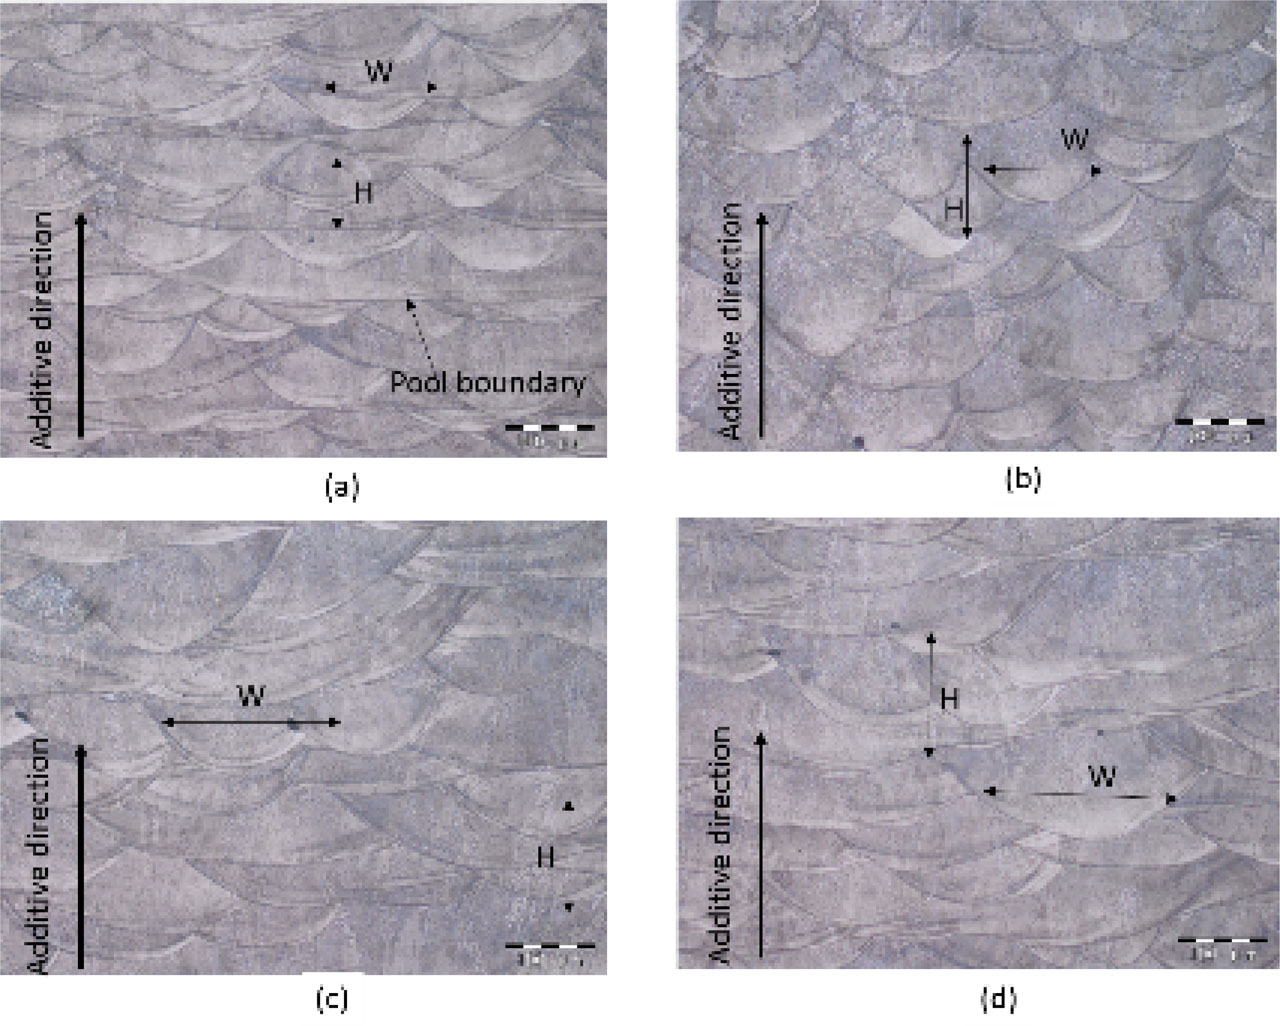
Fig. 3
Microstructure of the longitudinal section under different laser powers: (A): 270 W, (B) 300 W, (C) 320 W, and (D) 360 W
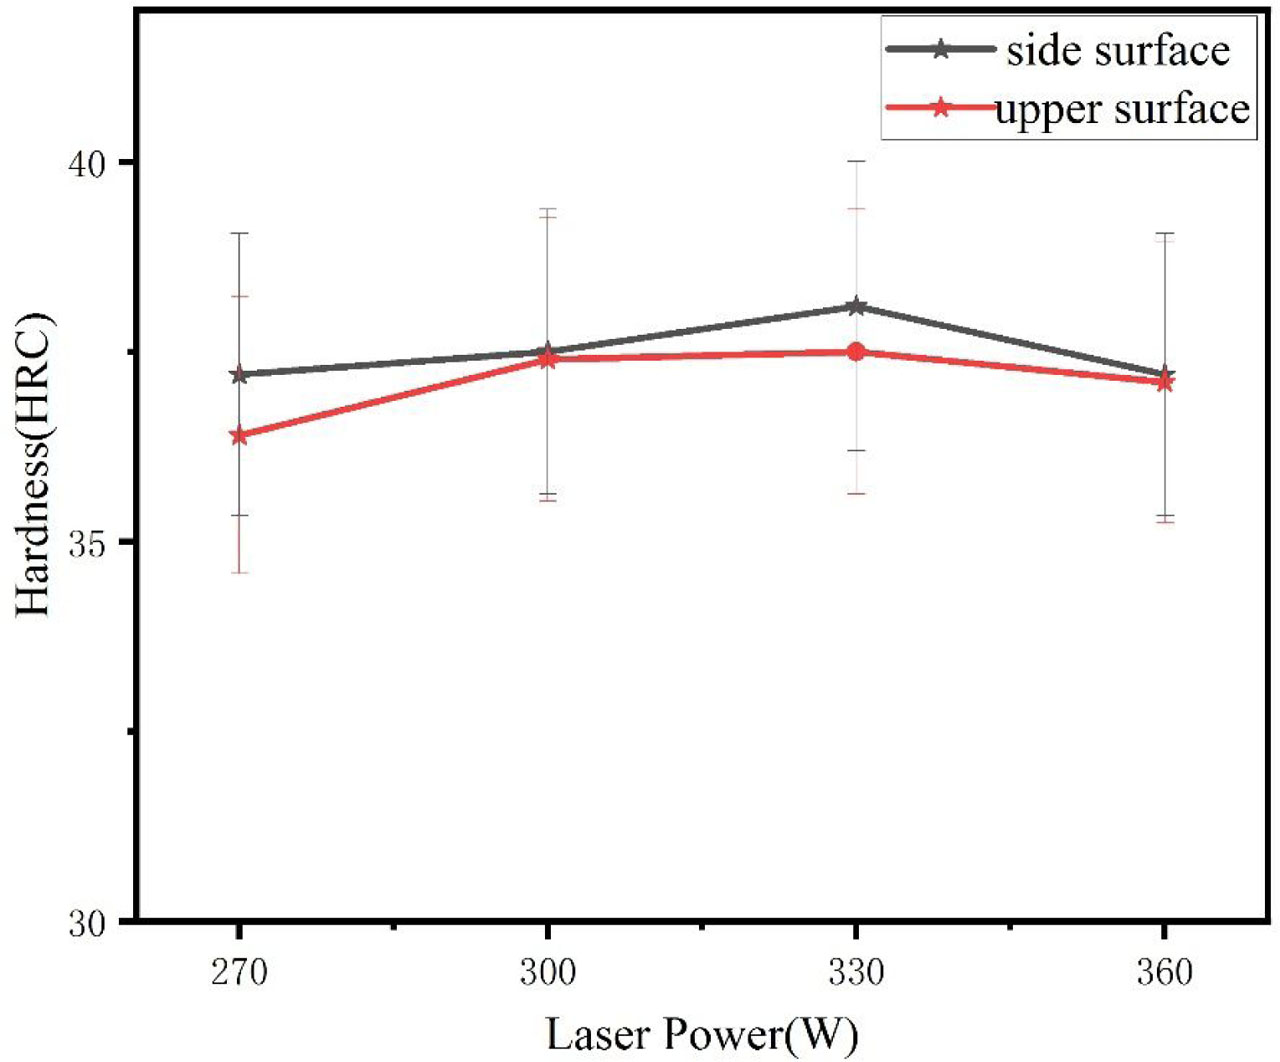
Fig. 4
Effect of laser power on surface hardness
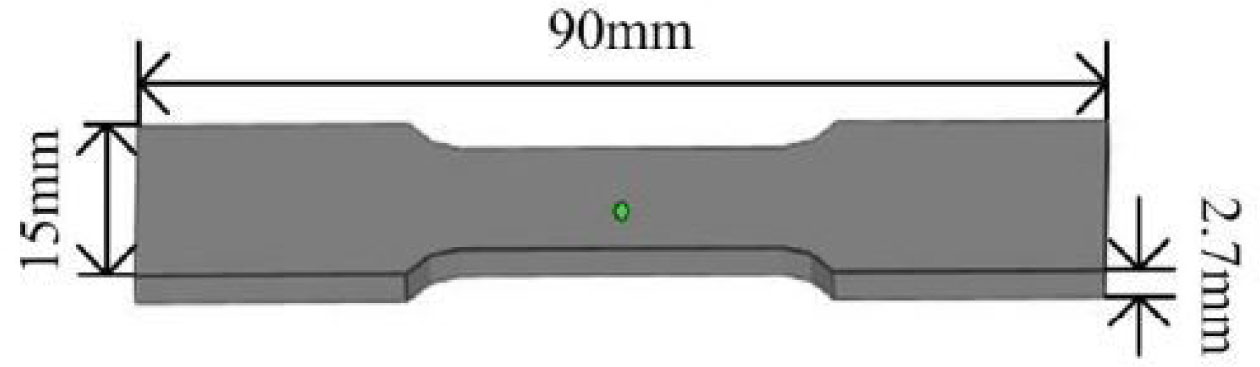
Fig. 5
Standard stretch piece
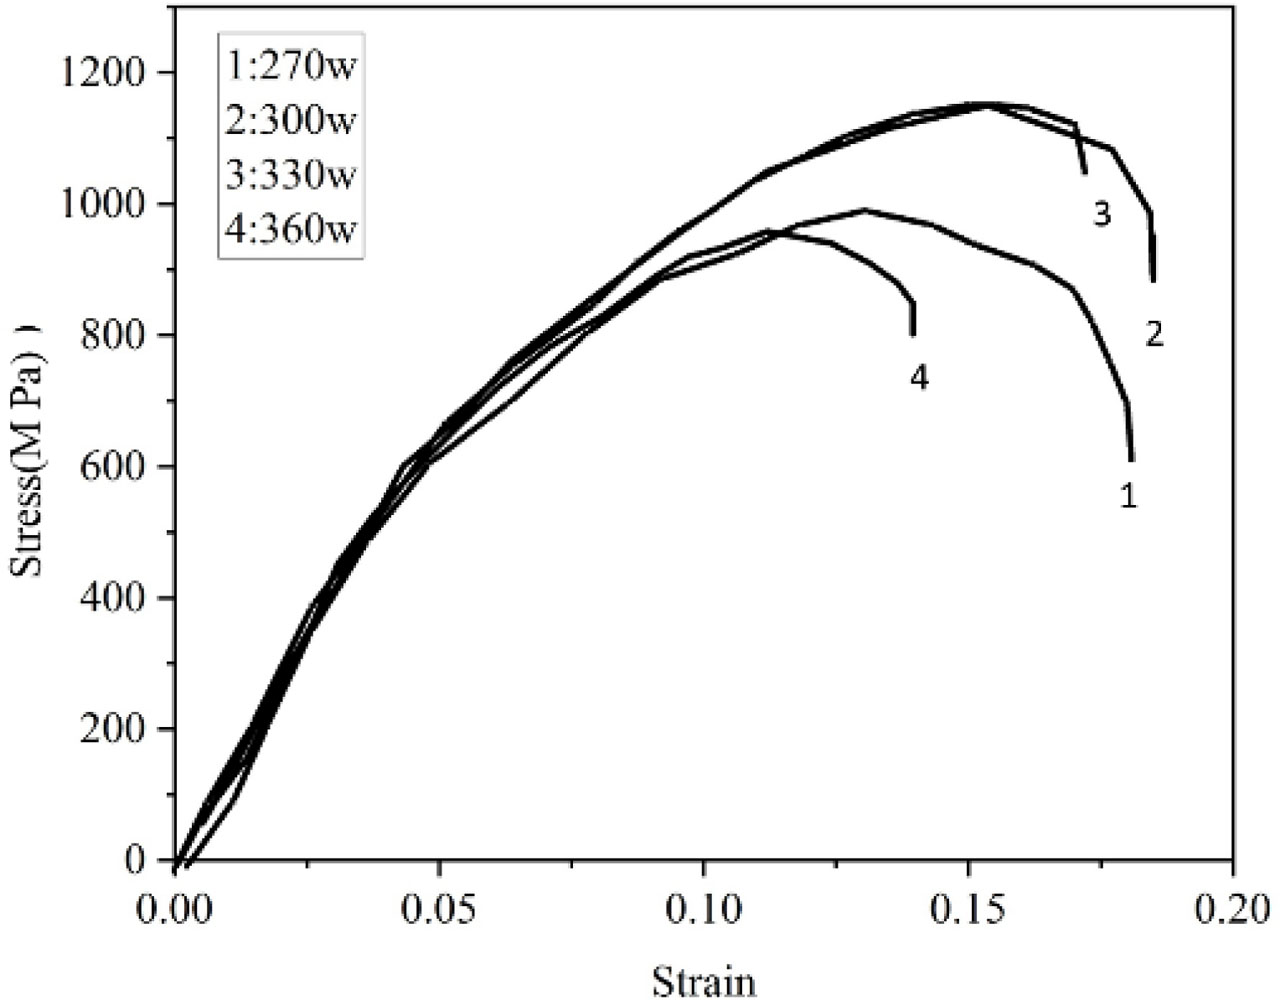
Fig. 6
Stress–strain curves under different laser powers
Table 3
Performance comparison under different laser powers
| Laser power (W) | Rm (MPa) | Rp0.2 (MPa) | ɛPa 2 |
|---|---|---|---|
| 270 | 1,104 | 1,158 | 15.1 |
| 300 | 1,106 | 1,060 | 17.6 |
| 330 | 990 | 883 | 16.2 |
| 360 | 959 | 866 | 14.7 |
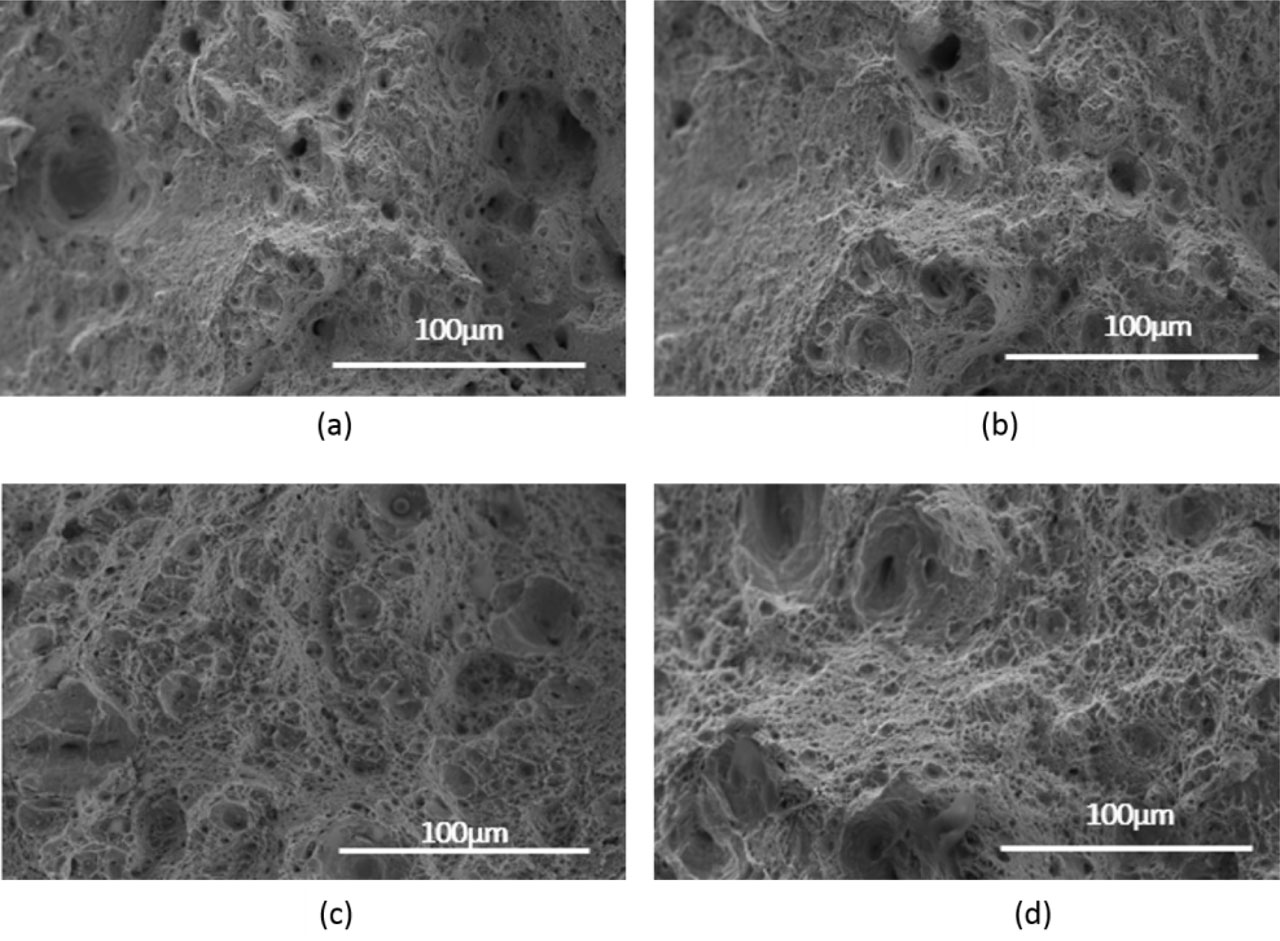
Fig. 7
Tensile fracture morphology of printed samples under different laser powers: (A) 270 W, (B) 300 W, (C) 320 W, and (D) 360 W
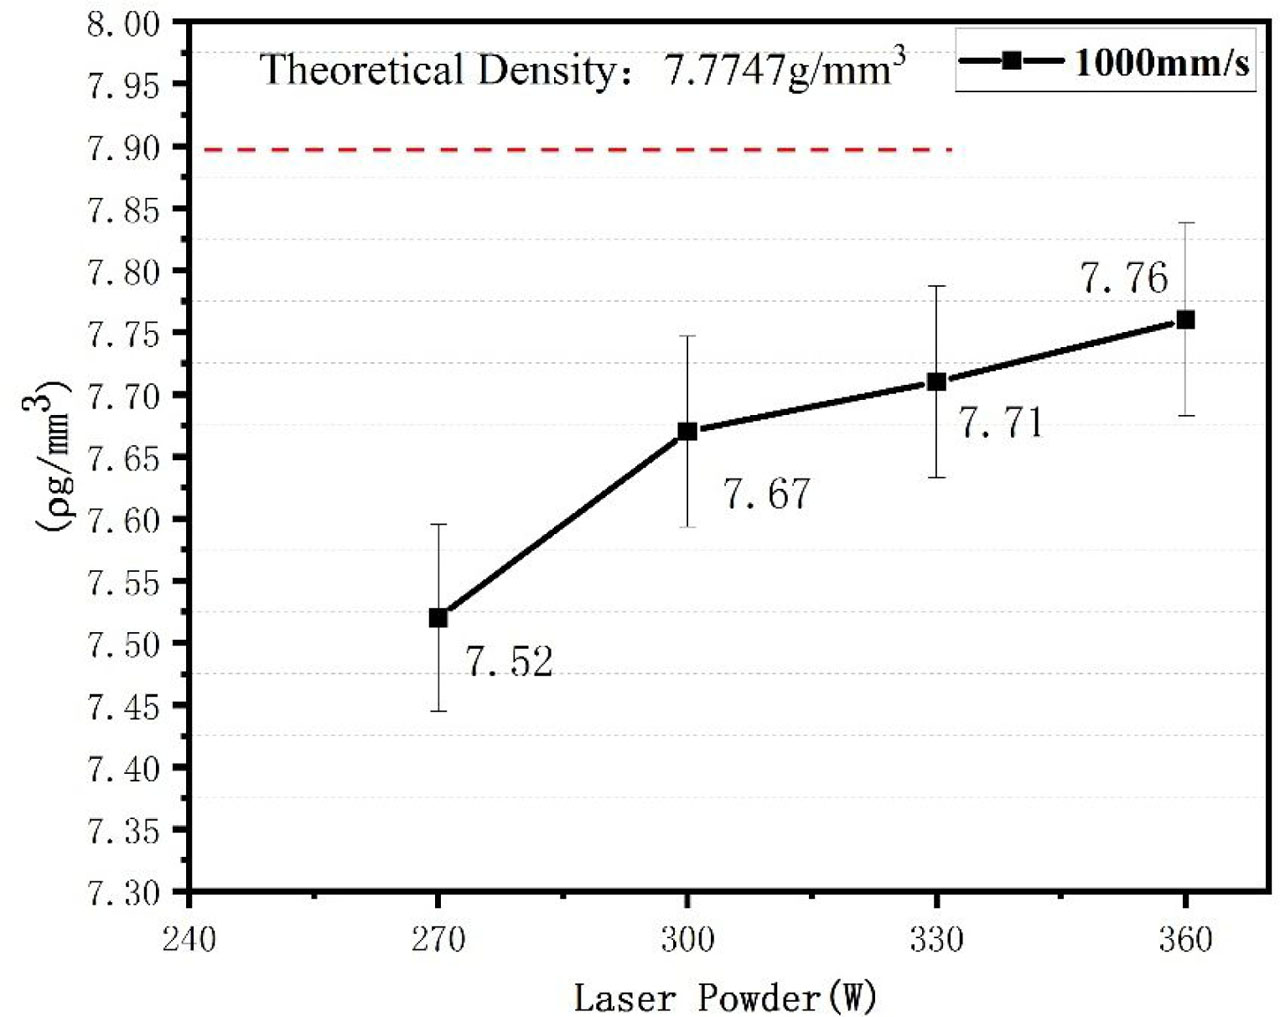
Fig. 8
Density variation under different laser powers
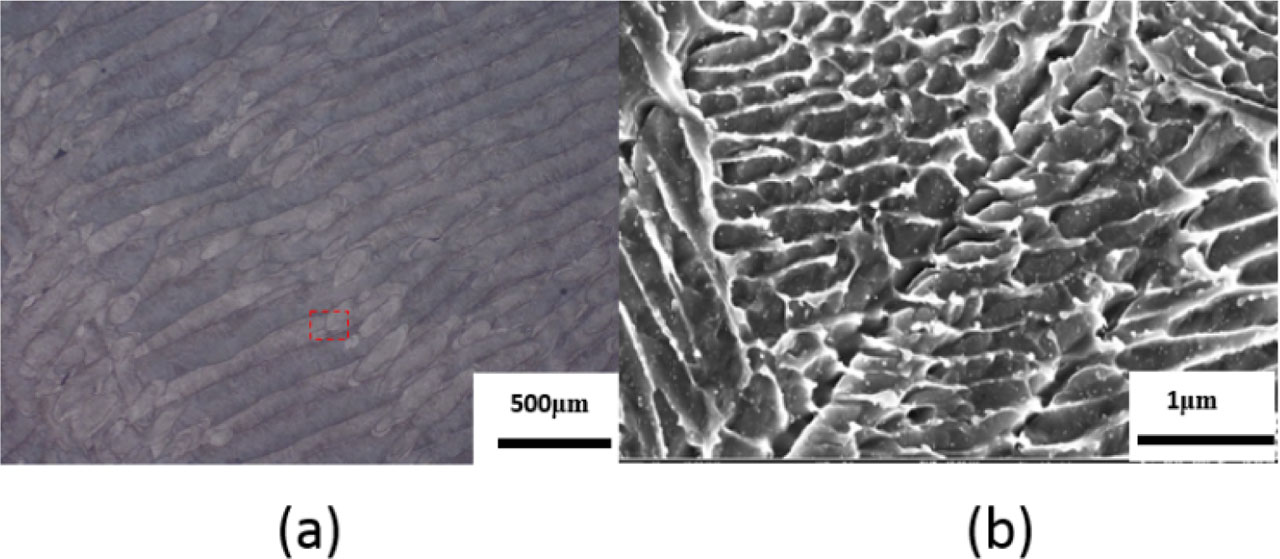
Fig. 9
SEM image (A) and local magnification (B) of the upper surface of the sample
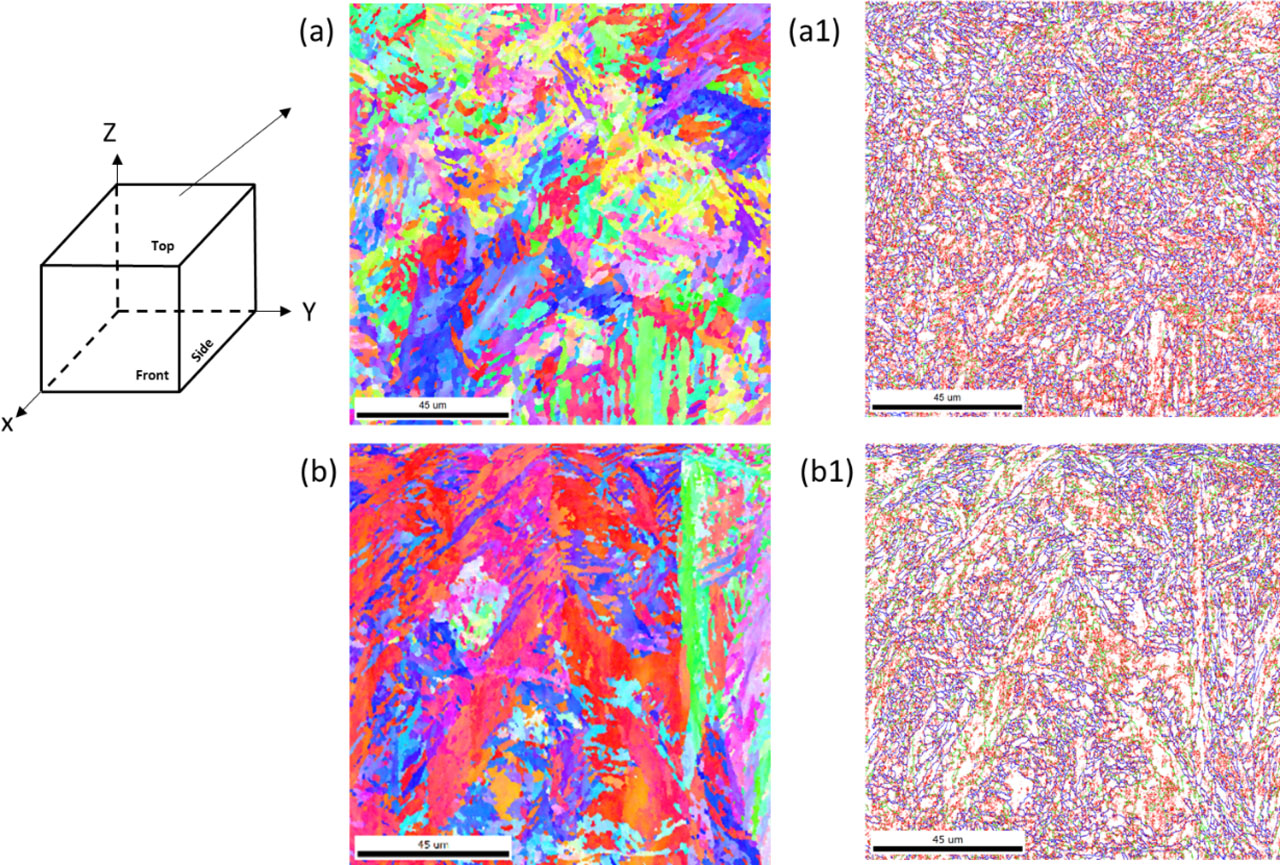
Fig. 10
Microstructure analysis of EBSD on the upper surface of the sample: (A) IPF maps of 300 W, (A1) GB maps of 300 W; and (B) IPF maps of 360 W, (B1) GB maps of 360 W. IPF, inverse pole diagram