
Fig. 1
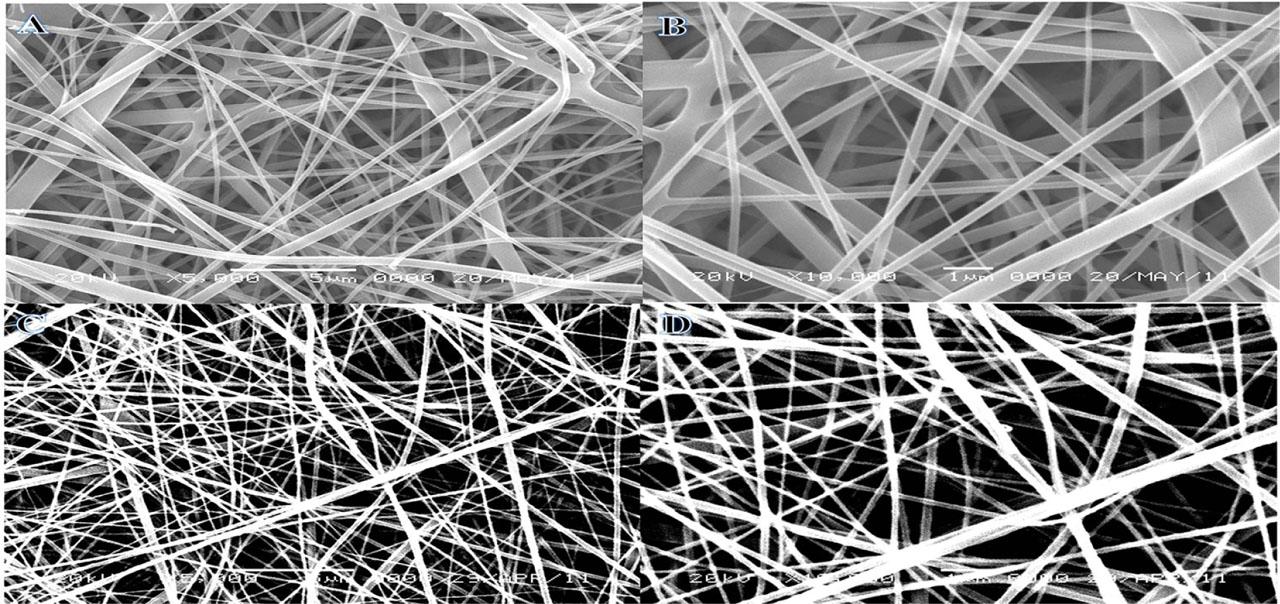
Fig. 2
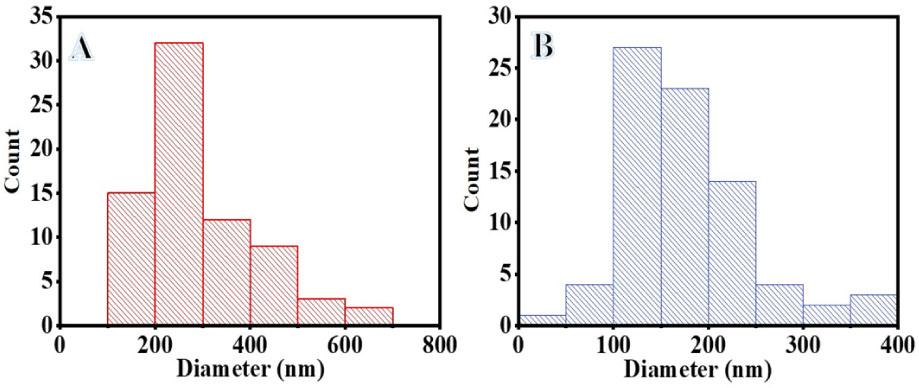
Fig. 3
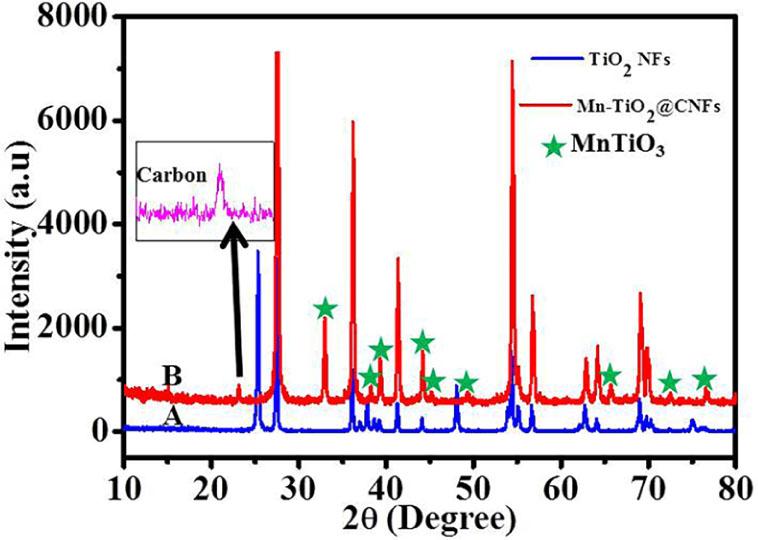
Fig. 4
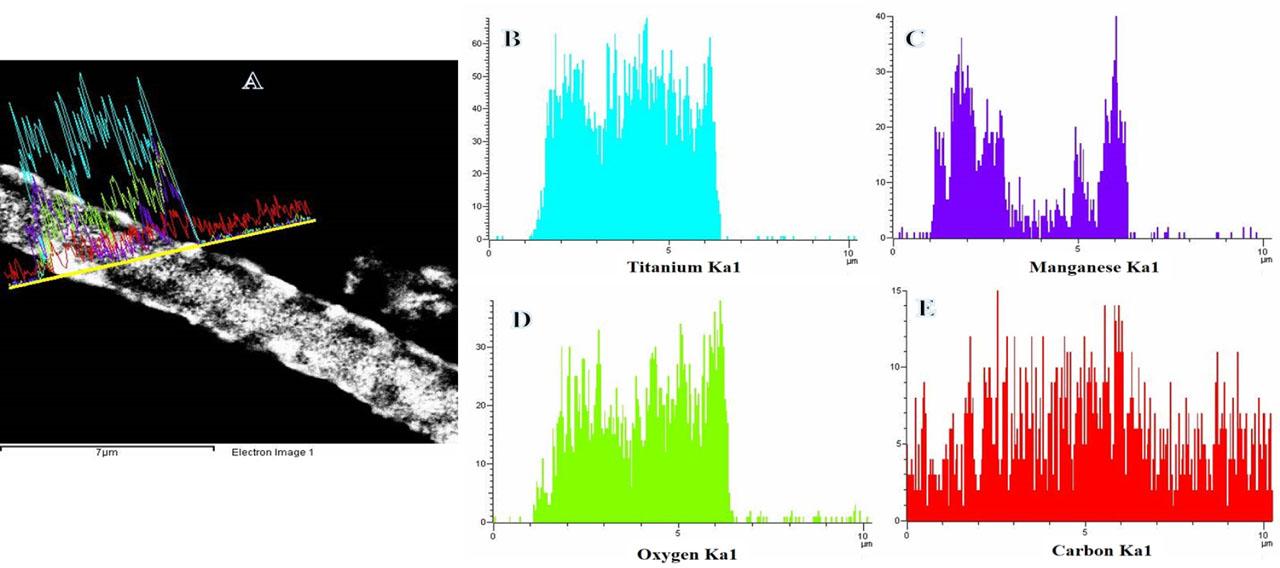
Fig. 5
Fig. 6
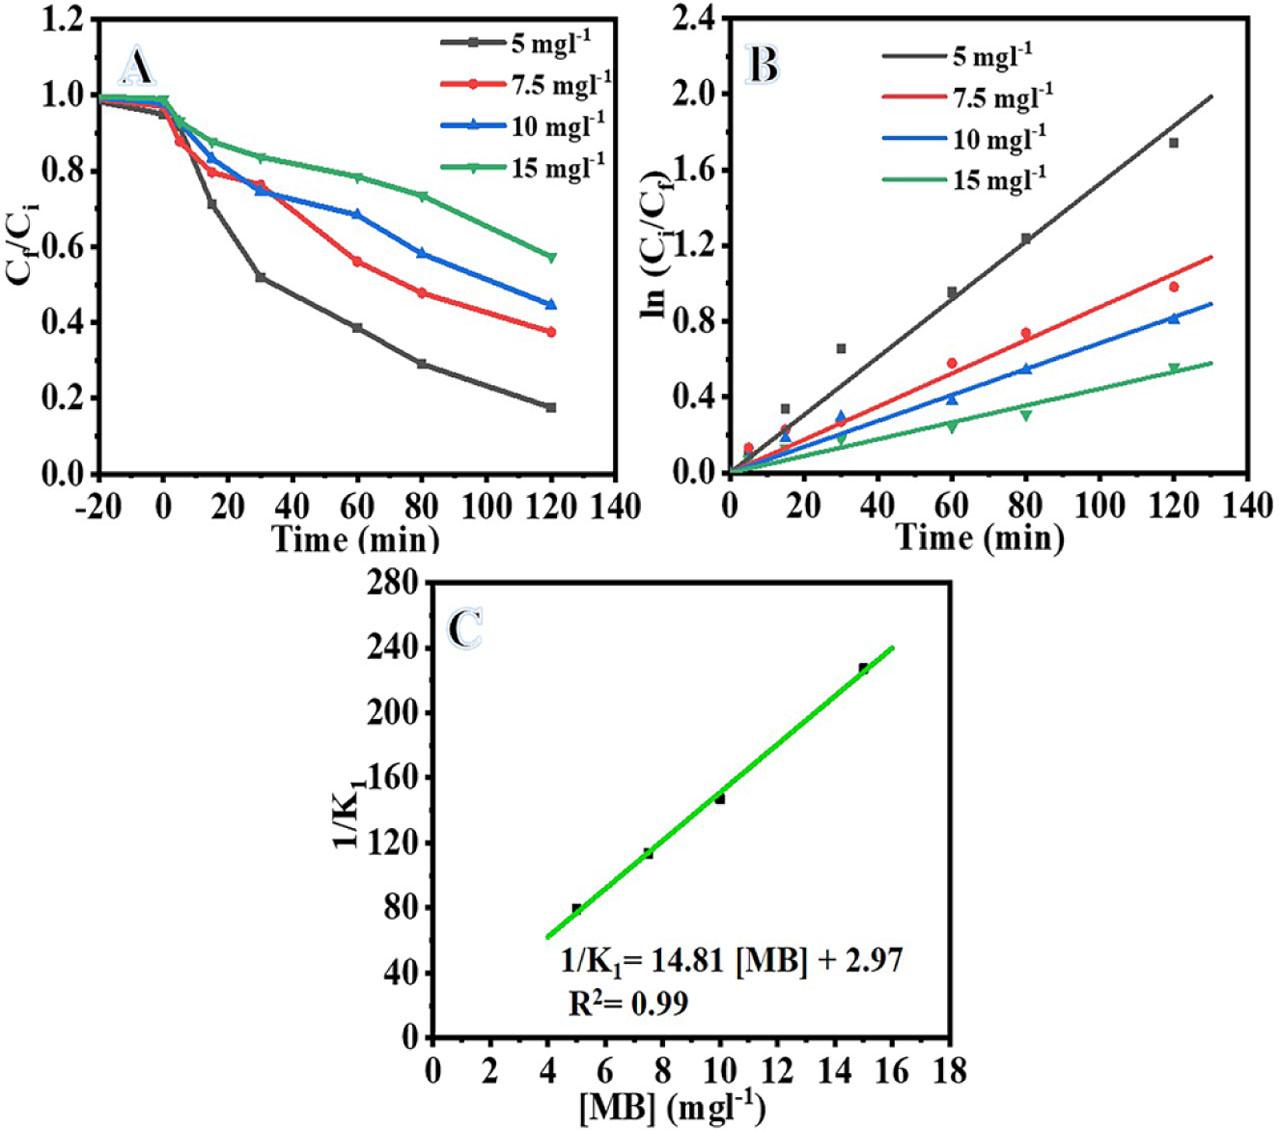
Fig. 7
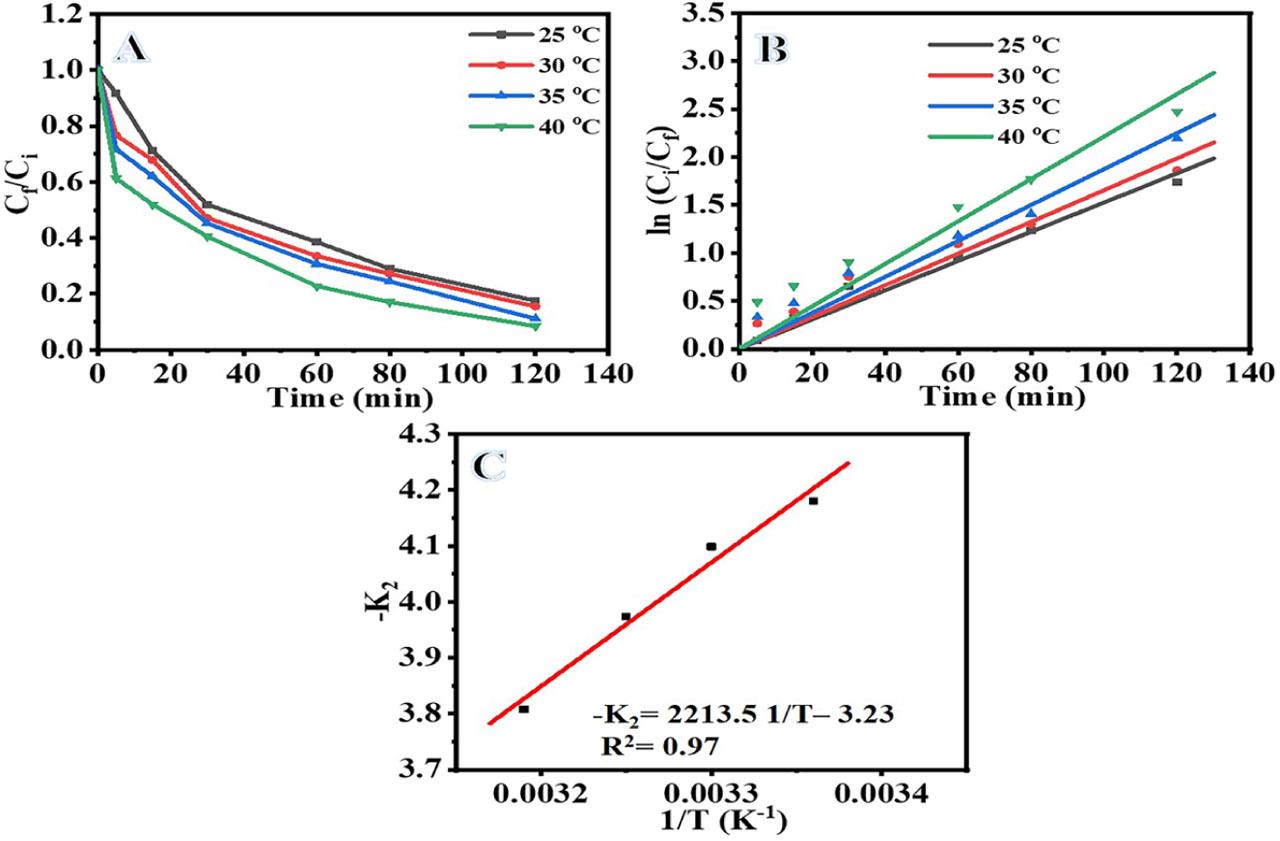
Fig. 8
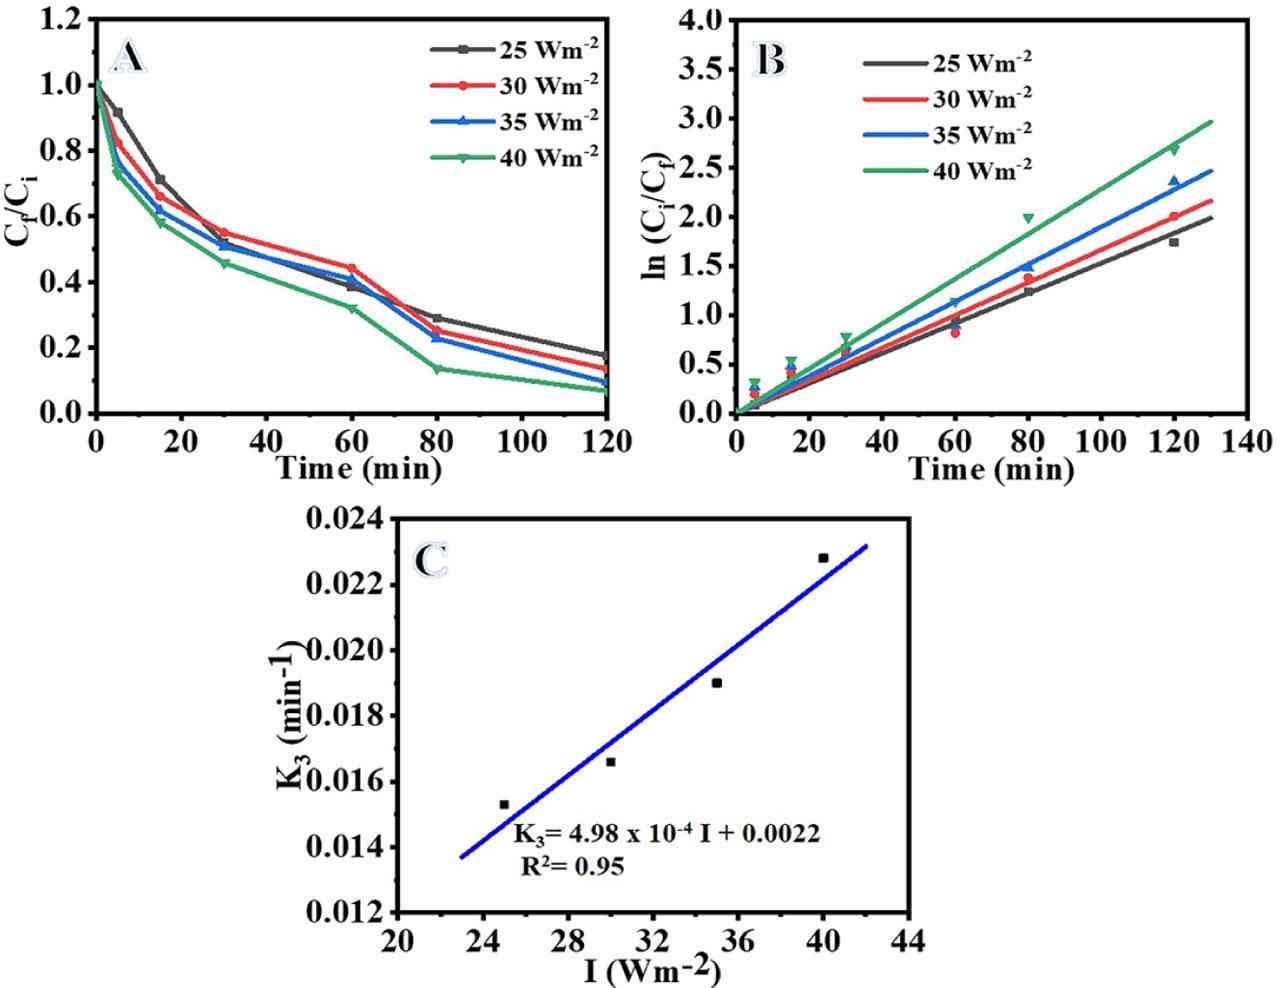
Fig. 9
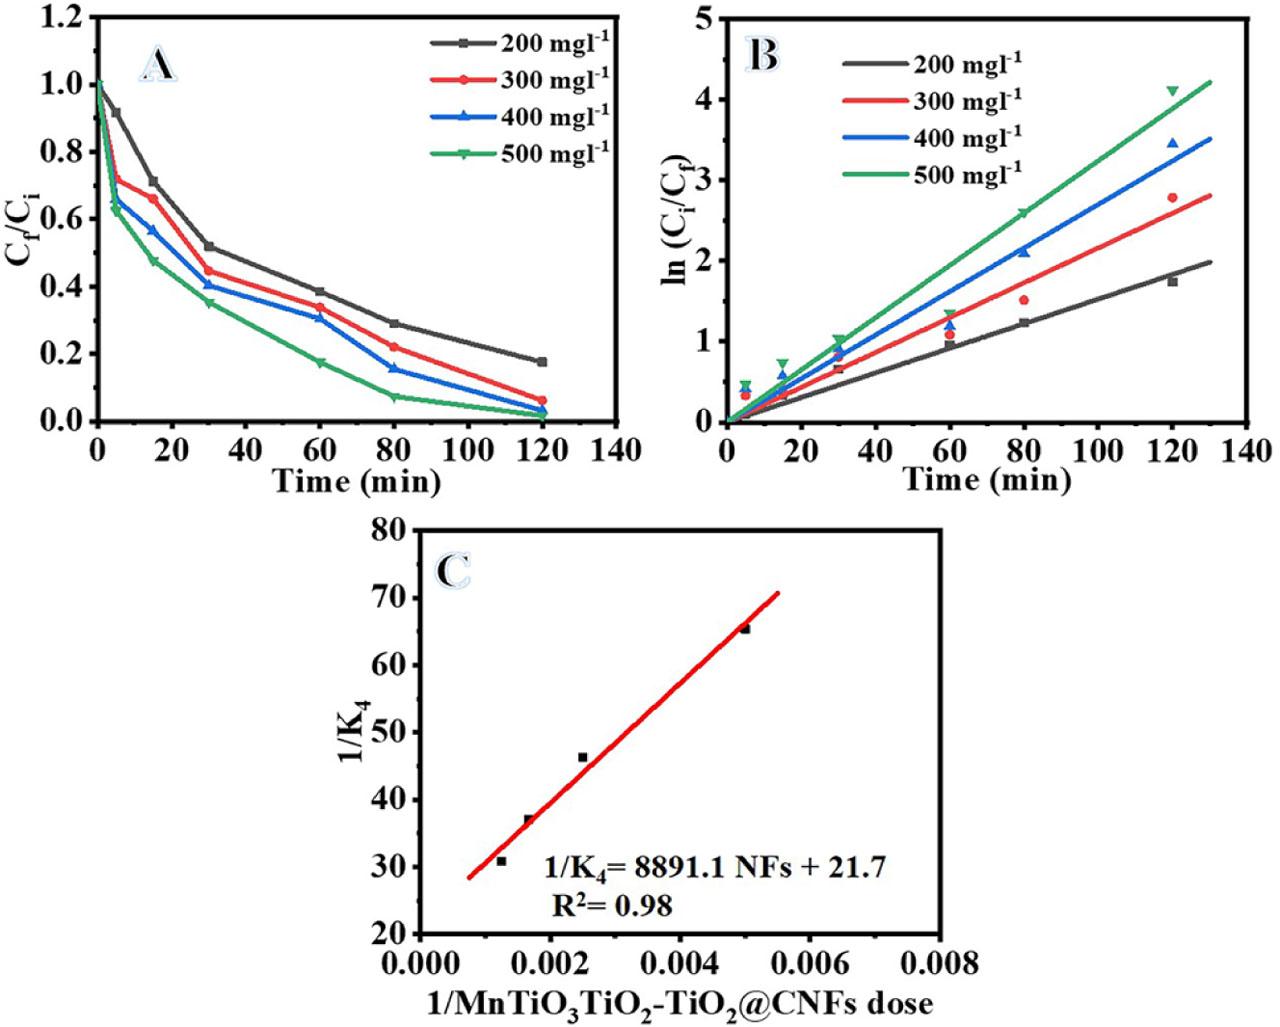
Fig. 10
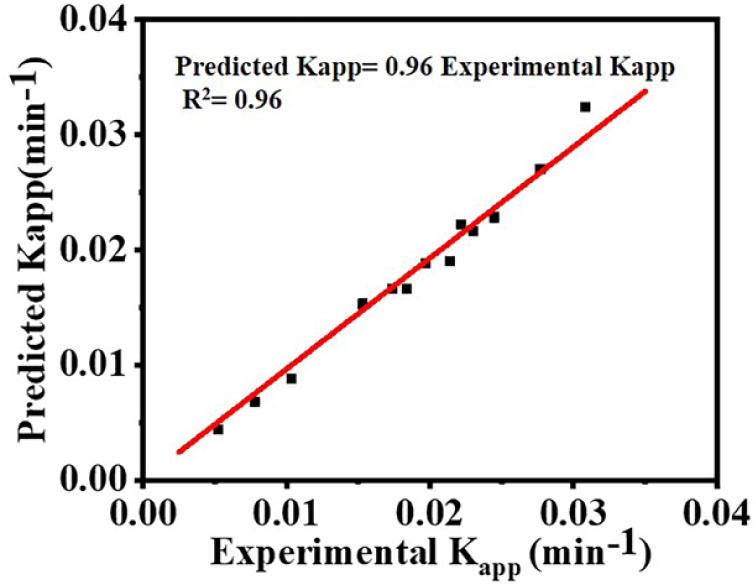
Fig. 11
Fig. 12

Fig. 13
Fig. 14
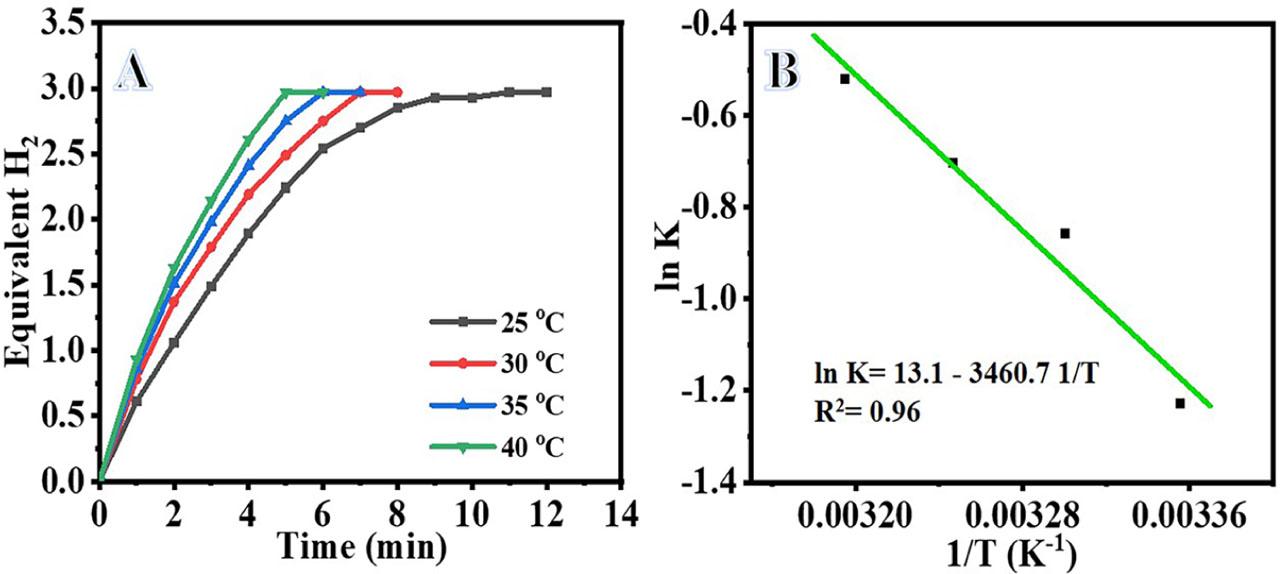
Fig. 15
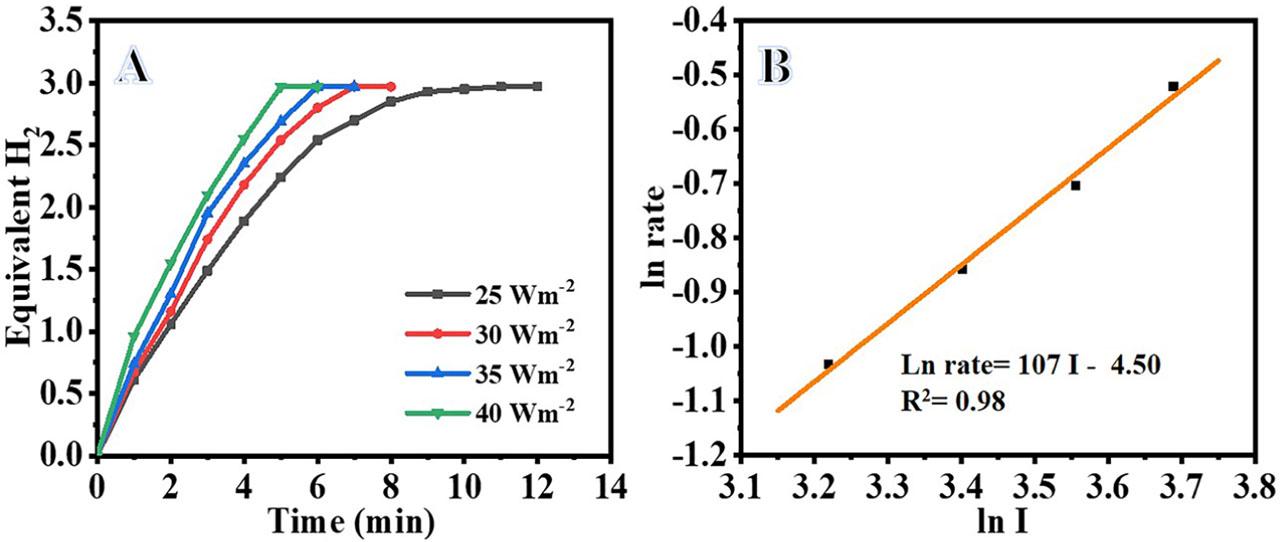
Fig. 16
Reaction rate constants of MB photodegradation at various MB concentrations, reaction temperatures, light intensities, and MnTiO3/TiO2@CNFs dosages
| Rate constant (min−1) | MB dye concentration (Ci) (mg · L−1) |
| 0.0153 | 5 |
| 0.0088 | 7.5 |
| 0.0068 | 10 |
| 0.0044 | 15 |
| Rate constant (min−1) | Reaction temperature (T) (°C) |
| 0.0153 | 25 T |
| 0.0166 | 30 |
| 0.0188 | 35 |
| 0.0222 | 40 |
| Rate constant (min−1) | Light intensity (I) (W·m−2) |
| 0.0153 | 25 I |
| 0.0166 | 30 |
| 0.019 | 35 |
| 0.0228 | 40 |
| Rate constant (min−1) | Catalyst dosage (CNFs) (mg·L−1) |
| 0.0153 | 200 |
| 0.0216 | 400 |
| 0.027 | 600 |
| 0.0324 | 800 |
Values of various constants obtained by employing multiple regression analysis in model equation
| Parameter | k′ | KR (L mg−1) | Ea (J mol−1) | R (J K−1 mol−1) | m (m2 W−1 min−1) | KNFs (L mg−1) |
|---|---|---|---|---|---|---|
| Value | 3.7551 × 10⁴ | 4.99 | 1.9204 × 10⁴ | 8.314 | 6 × 10⁻⁴ | 2.444 × 10⁻³ |