
Fig. 1

Fig. 2

Fig. 3

Fig. 4

Fig. 5
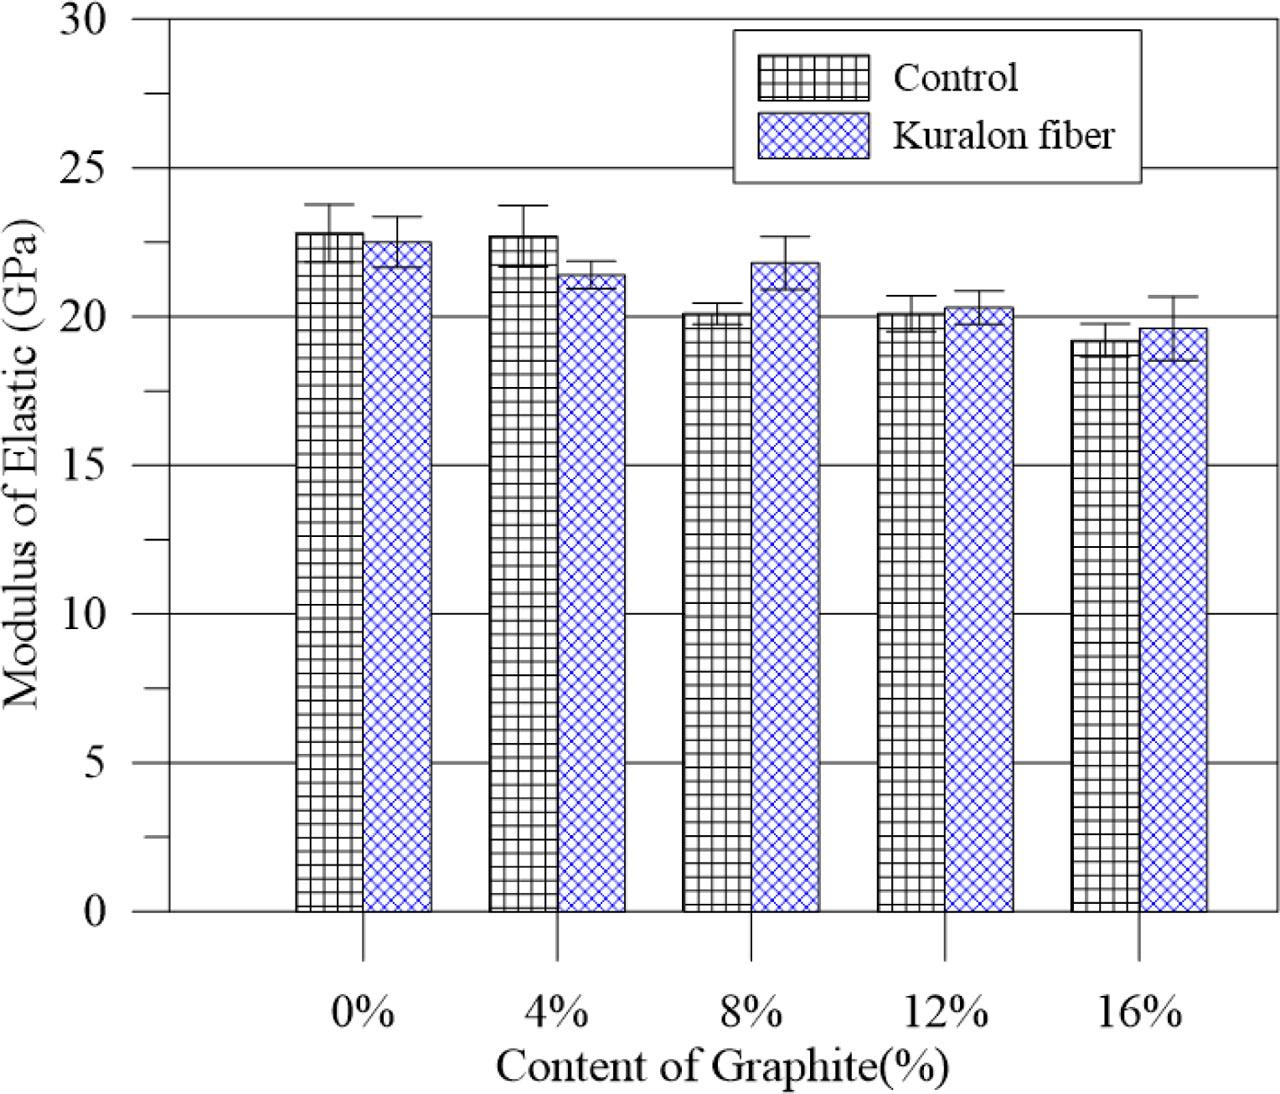
Fig. 6
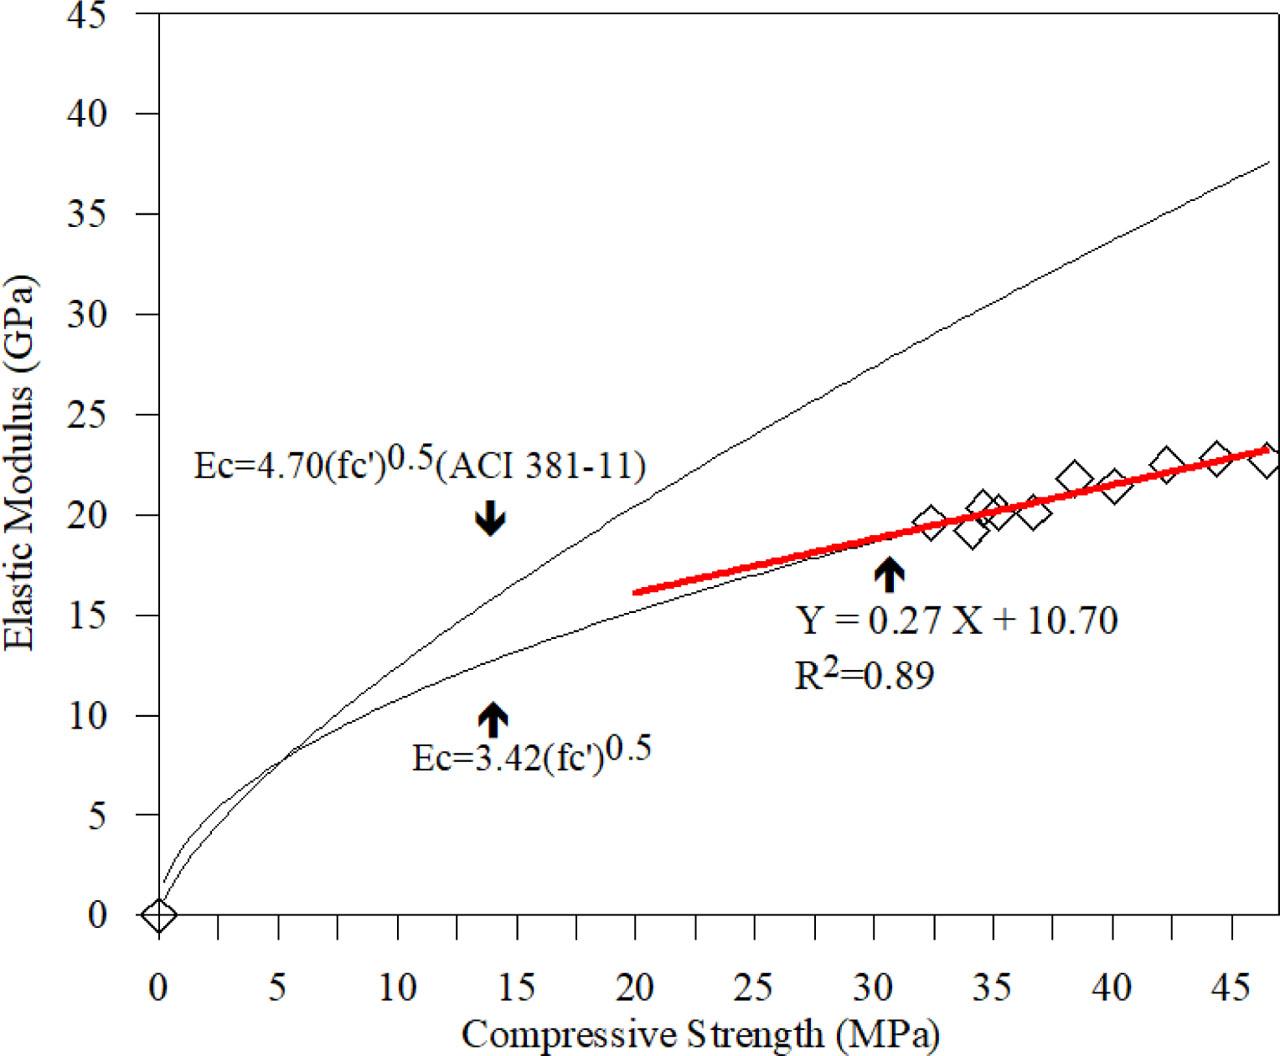
Fig. 7
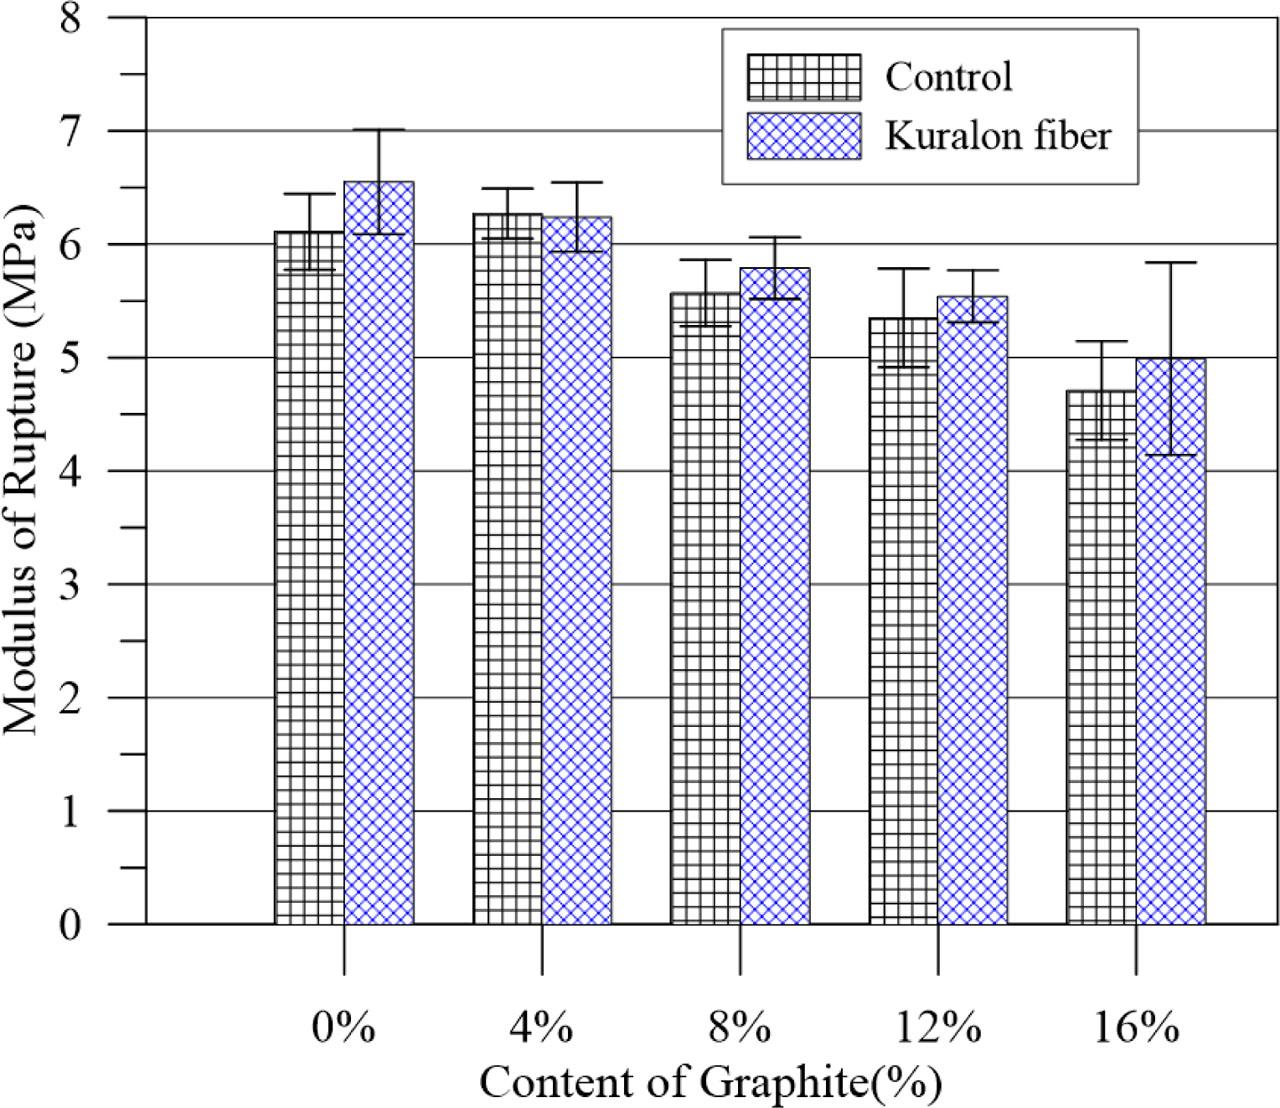
Fig. 8
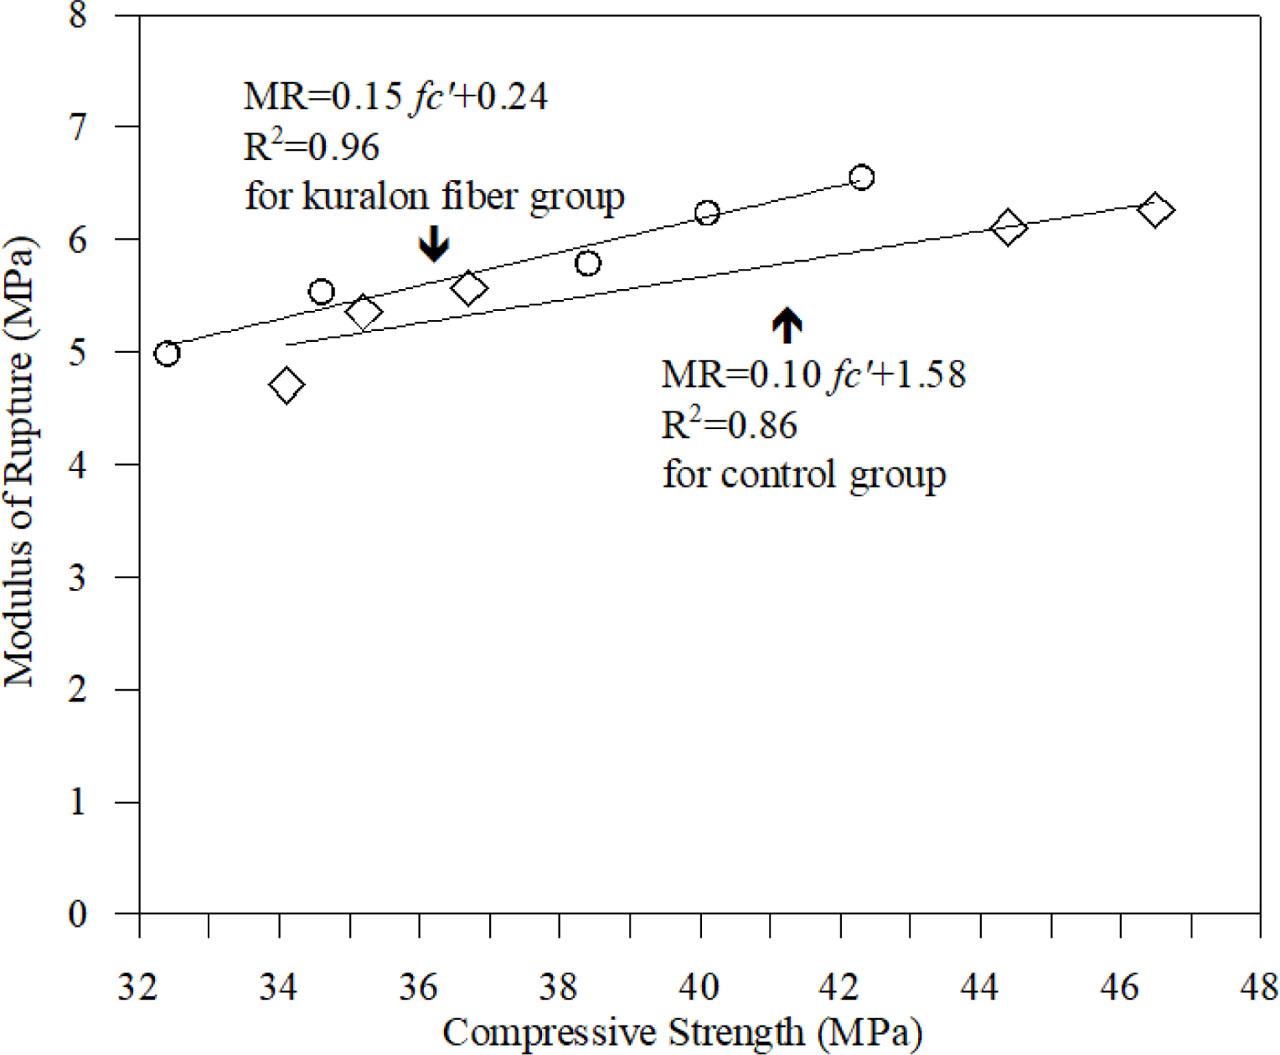
Fig. 9
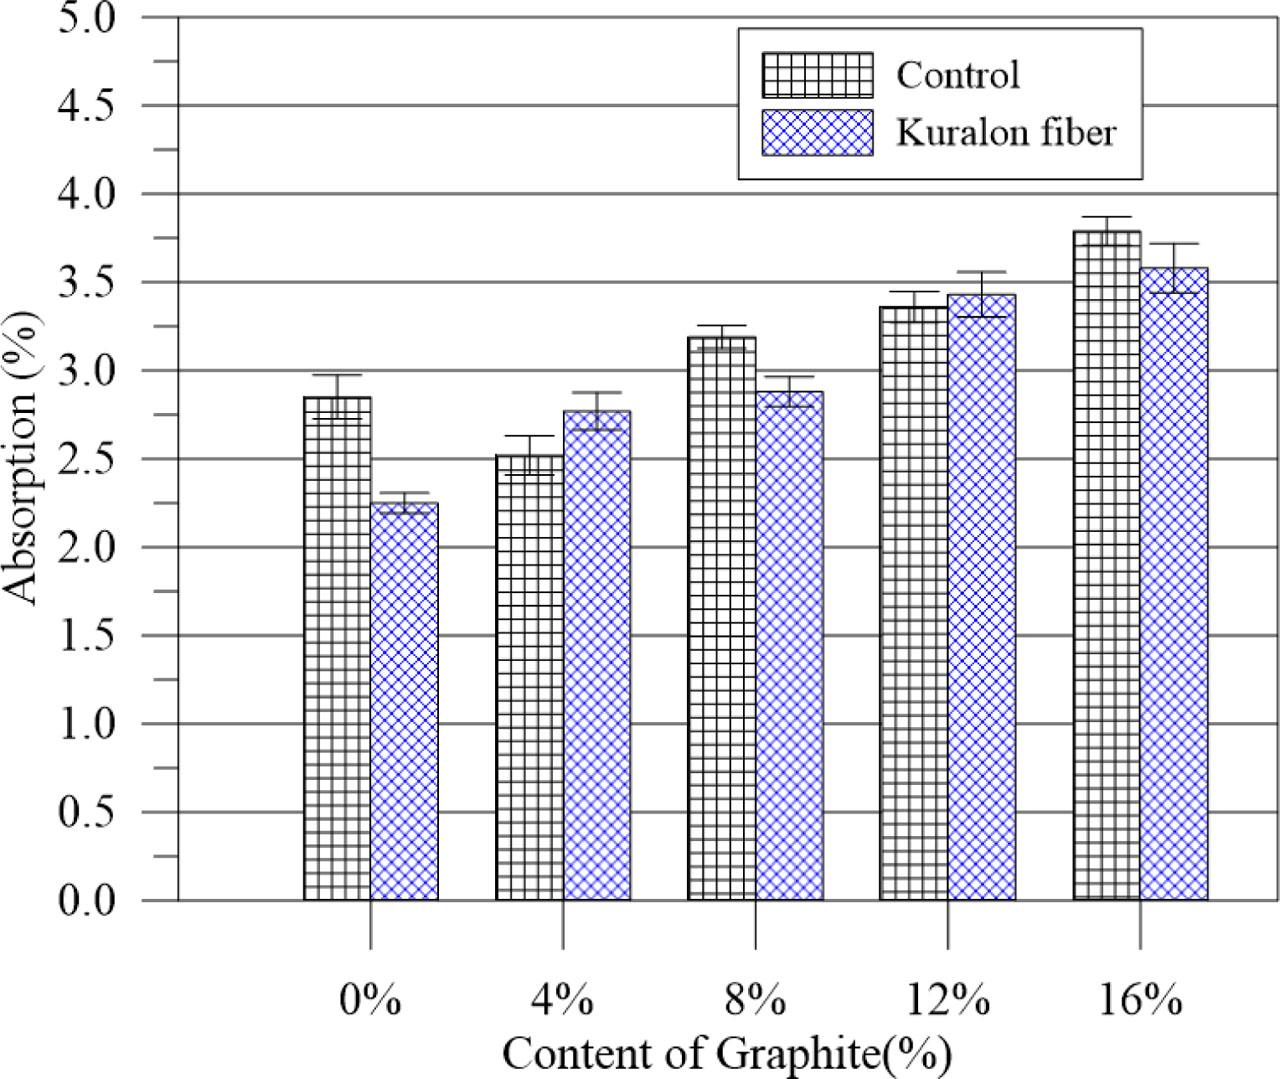
Fig. 10

Fig. 11

Fig. 12
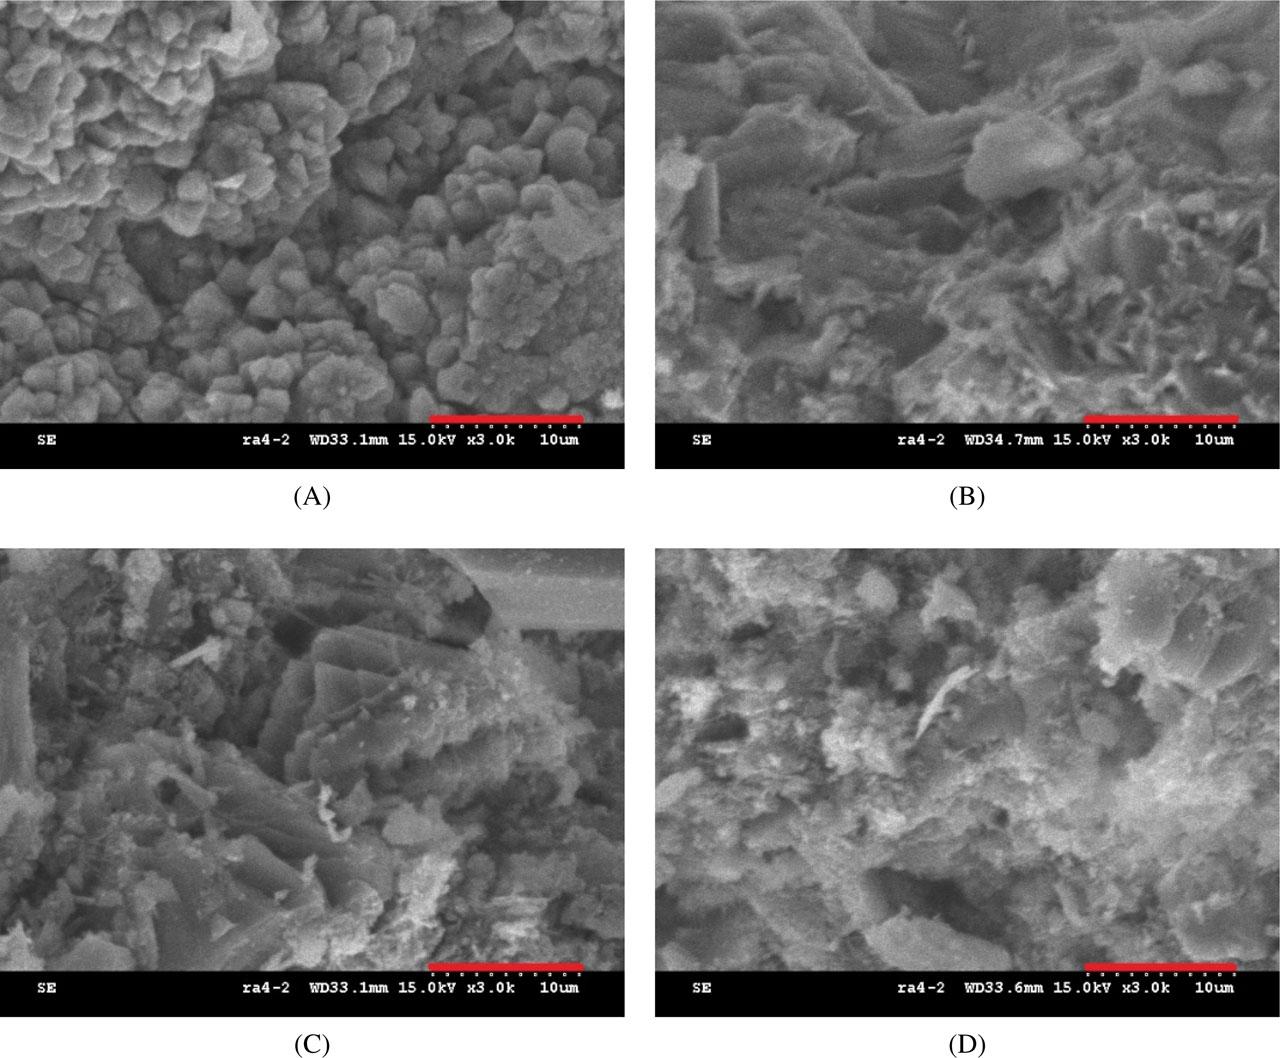
Fig. 13
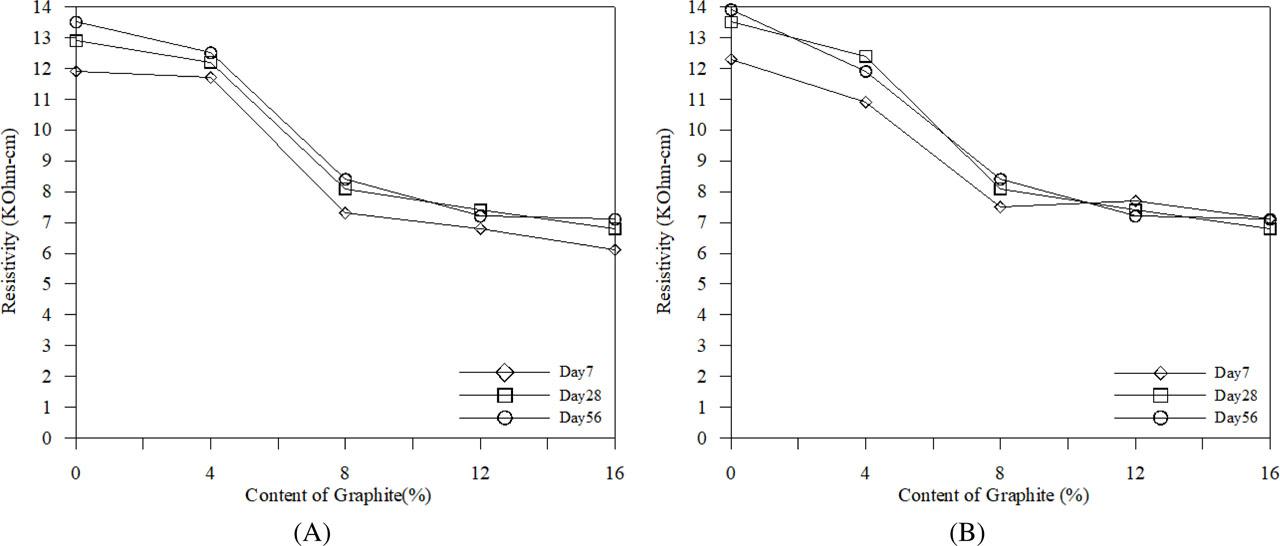
Fig. 14

Fig. 15

Fig. 16
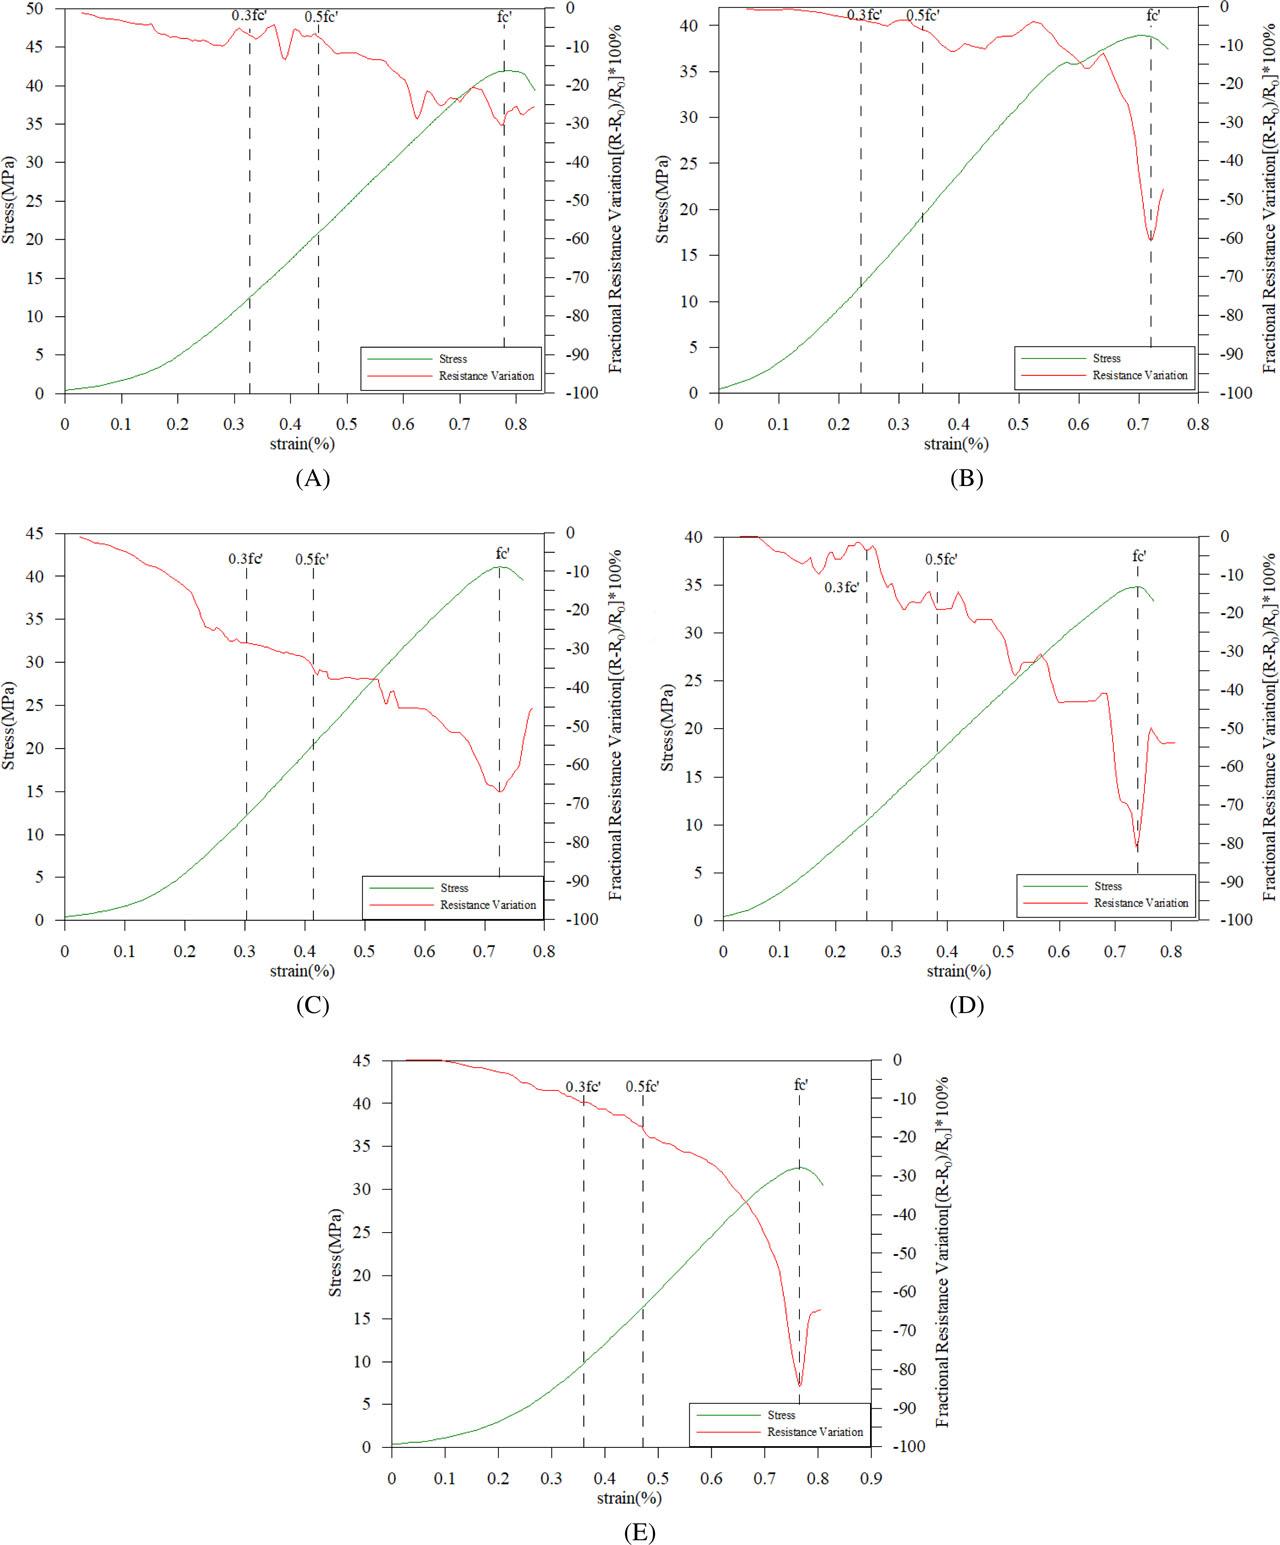
Fig. 17
Fig. 18

Concrete tests
| Specimen | Properties | Detailed tests | Standard |
|---|---|---|---|
| Concrete | Hardened concrete properties | Compressive strength test | ASTM C39 |
| Elastic modulus test | ASTM C469 | ||
| Flexural strength test | ASTM C78 | ||
| Permeability | Saturated absorption test | ASTM C642 | |
| ISA test | BS 1881 | ||
| Microscopic properties | Scanning electron microscopy | ASTM C1723 | |
| Electrical properties | Four-electrode resistivity test | Wenner method | |
| DC loop resistance test | Designed method in Section 2.3 | ||
| Cyclic loading test |
Mixture designs of concrete (kg/m3)
| Mix No. | Water | Cement | Coarse aggregates | Fine aggregates | Graphite powders | K fibers | Superplasticizer |
|---|---|---|---|---|---|---|---|
| NG0 | 236.46 | 535.0 | 929.8 | 612.96 | 0 | 0 | 2.67 |
| NG4 | 234.85 | 513.6 | 929.8 | 612.96 | 21.4 | 0 | 4.28 |
| NG8 | 233.54 | 492.2 | 929.8 | 612.96 | 42.8 | 0 | 5.59 |
| NG12 | 232.17 | 470.8 | 929.8 | 612.96 | 64.2 | 0 | 6.96 |
| NG16 | 231.64 | 449.4 | 929.8 | 612.96 | 85.6 | 0 | 7.49 |
| KG0 | 236.46 | 535.0 | 929.8 | 612.96 | 0 | 6.5 | 2.67 |
| KG4 | 234.85 | 513.6 | 929.8 | 612.96 | 21.4 | 6.5 | 4.28 |
| KG8 | 233.54 | 492.2 | 929.8 | 612.96 | 42.8 | 6.5 | 5.59 |
| KG12 | 232.17 | 470.8 | 929.8 | 612.96 | 64.2 | 6.5 | 6.66 |
| KG16 | 231.64 | 449.4 | 929.8 | 612.96 | 85.6 | 6.5 | 7.49 |
Properties of Kuralon fibers
| Property | Testing value |
|---|---|
| Relative density | 1.30 |
| Tensile strength | 880–1,600 MPa |
| Elongation | 6% |
| Elastic modulus | 29.12 GPa |
Permeability of concrete [39]
| Time (min) | Permeability of concrete using ISA (ml/m2s) | ||
|---|---|---|---|
| Low | Average | High | |
| 10 | <0.25 | 0.25–0.50 | >0.50 |
| 30 | <0.17 | 0.17–0.35 | >0.35 |
| 60 | <0.07 | 0.10–0.20 | >0.20 |