
Table 1
Effect of the mixture temperature on the relative thermal conductivity, λ
| Temperature | Density of the mixture (t/m3) | ||||||
|---|---|---|---|---|---|---|---|
| 1.8 | 1.9 | 2.0 | 2.1 | 2.2 | 2.3 | 2.4 | |
| 50 | 0.94 | 0.94 | 0.95 | 0.95 | 0.96 | 0.97 | 0.97 |
| 70 | 0.97 | 0.97 | 0.97 | 0.99 | 0.99 | 0.99 | 1.0 |
| 90 | 1.00 | 1.00 | 1.00 | 1.02 | 1.03 | 1.03 | 1.03 |
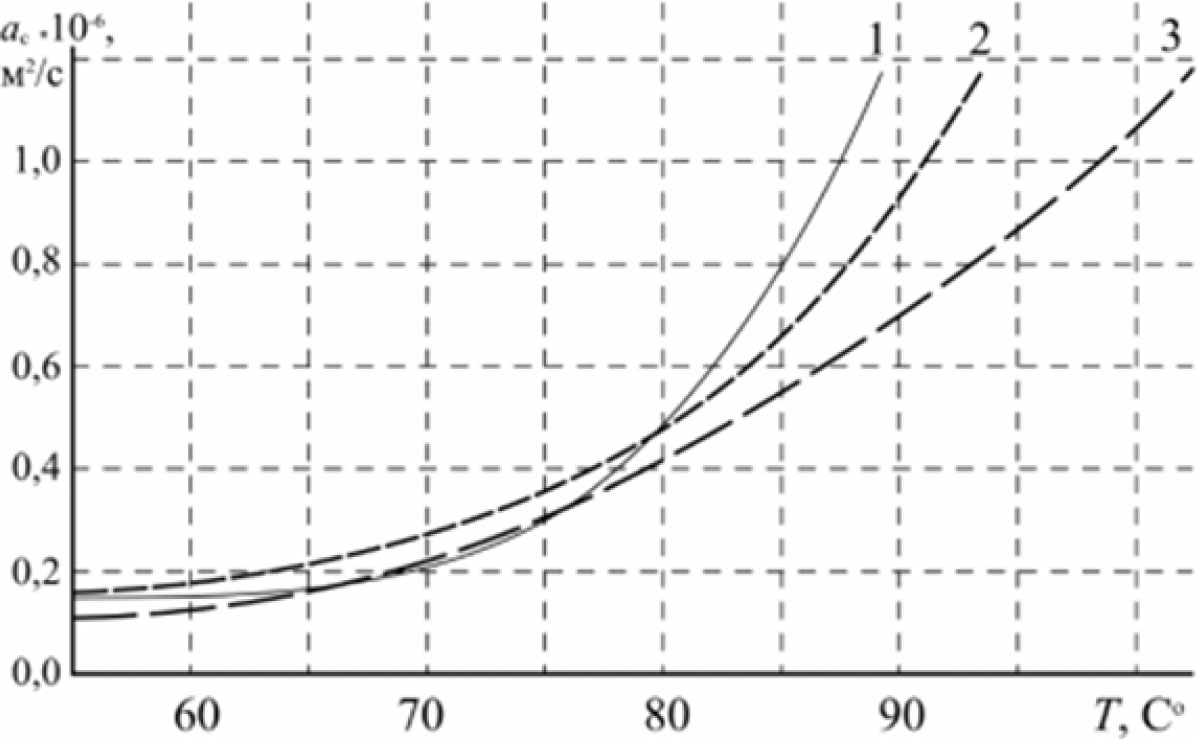
Fig. 1
Temperature dependence of the penetration rate of the binder: 1 – a binder based on bitumen with the fiber in the amount of 4% of the weight of granular asphalt; 2 – a binder based on bitumen with the fiber in the amount of 3% of the weight of granular asphalt; 3 – binder without fiber
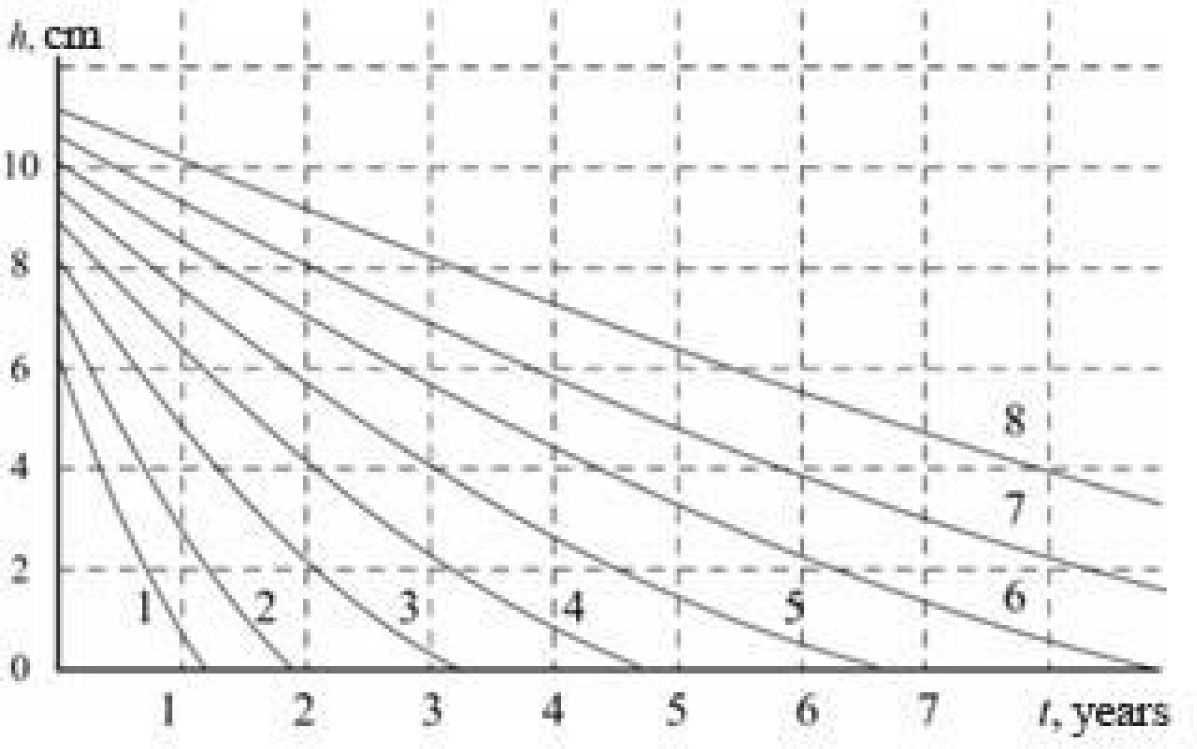
Fig. 2
Dependence of the binder concentration on the thickness of the coating layer and the service life of 1%–8% bitumen in the mixture; 2–7%; 3–6%; 4–5%; 5–4%; 6–3%; 7–2%
Table 2
Variants of restoration technology for asphalt concrete pavements
| Condition of the pavement before restoration | Methods of restoration | |
|---|---|---|
| 1. Hot regeneration with surface treatment | 2. Traditional, leveling course (3 cm) and new pavement (6 cm) | |
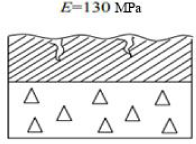 | 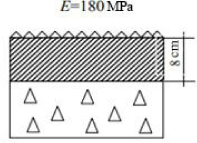 | 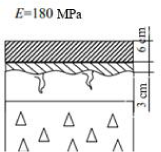 |
Table 3
Grain size composition of the granular asphalt
| Indicators | Mesh size (mm) | |||||||||
|---|---|---|---|---|---|---|---|---|---|---|
| 20 | 15 | 10 | 5 | 2.5 | 1.25 | 0.63 | 0.315 | 0.16 | 0.071 | |
| Partial residuals (g) | 32 | 8 | 88 | 160 | 120 | 52 | 100 | 140 | 116 | 52 |
| Partial residuals (%) | 3.40 | 0.85 | 9.36 | 17.0 | 12.7 | 5.53 | 10.6 | 14.8 | 12.3 | 5.53 |
| Full passes (%) | 96.6 | 75.7 | 66.3 | 49.3 | 36.3 | 21.0 | 20.4 | 5.5 | 3.2 | 0.67 |
| Requirements according to standards | 90–100 | 85–100 | 75–100 | 60–70 | 48–60 | 37–50 | 28–40 | 20–30 | 13–20 | 8–14 |
| Indicators | Mesh size (mm) |
|---|---|
| <0.071 | |
| Partial residuals (g) | 72 |
| Partial residuals (%) | 7.67 |
| Full passes (%) | |
| Requirements according to standards |
Table 4
Indicators of properties of oil road bitumen BND 60/90
| No. | Indicator name, unit of measurement | Test result | DSTU 4044 value for BND 60/90 grade |
|---|---|---|---|
| 1 | Needle penetration depth (0.1 mm) | ||
| at 25°C | 76 | From 61 to 90 | |
| at 0°C | 23 | Not less than 20 | |
| 2 | Ring-and-ball softening point (°C) | 50 | Not lower 47 |
| 3 | Elongation (cm) | ||
| at 25°C | 100 | Not less than 55 | |
| at 0°C | 4.5 | Not less than 3.5 | |
| 4 | Brittleness point (°C) | −17 | Not higher than −15 |
| 5 | Flash point (°C) | 240 | Not lower than 230 |
| 6 | Change in softening point after progress (°C) | 3.5 | Not more 5 |
| 7 | Penetration index | −0.2 | −1 to +1 |
Table 5
Physical and mechanical properties of the crushed granite
| No. | Indicator names | Actual indicators | DSTU B V.2.3-39 requirements |
|---|---|---|---|
| 1 | Content of crushed grains by weight (not less %) | 85 | 85 |
| 2 | Content of lamellar (flaky) and needle-shaped grains by weight (no more %) | 15 | 15 |
| 3 | Content of grains of weak rocks by weight (no more %) | 2.8 | 5 |
| 4 | Content of dust and clay particles by weight (no more %) | 1 | 2 |
| 5 | Clay content in lumps (% by weight, no more) | None | 0.25 |
| 6 | Crushing grade (not less) | 1,000 | 1,000 |
| 7 | Attrition grade | A1 | A1 |
| 8 | Frost resistance grade (not lower) | F150 | F150 |
| 9 | Plasticity grade | Pl1 | Pl1–Pl2 |
| 10 | Water resistance grade | B1 | B1–B2 |
| 11 | Bulk density ρn (kg/m3) | 1,318 | - |
Table 6
Physical and mechanical indicators of the stone screening dust
| No. | Indicator names | Actual indicators | DSTU B V.2.3-39 requirements |
|---|---|---|---|
| 1 | True density (kg/m3) | 2,628 | - |
| 2 | Average density (kg/m3) | 2,621 | - |
| 3 | Bulk density (kg/m3) | 1,540 | - |
| 4 | Content of dust and clay particles, by weight (no more %) | 0.96 | 2 |
| 5 | Crushing grade (not less) | 1,000 | 1,000 |
| 6 | Attrition grade | A1 | A1 |
| 7 | Frost resistance grade (not lower) | F150 | F150 |
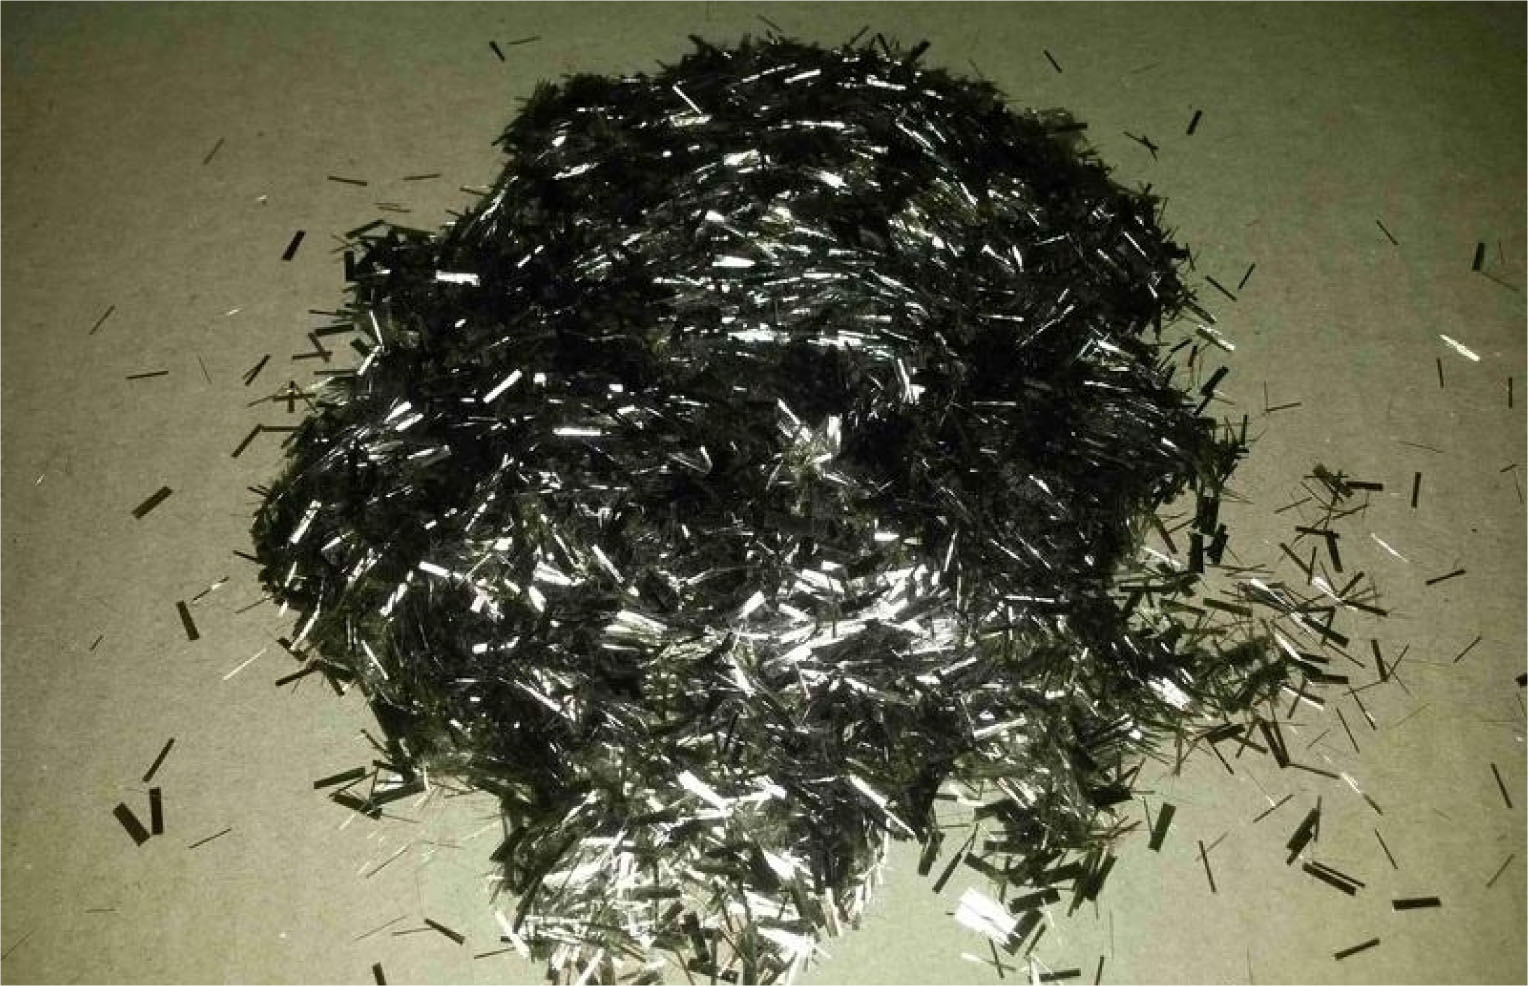
Fig. 3
Fiber
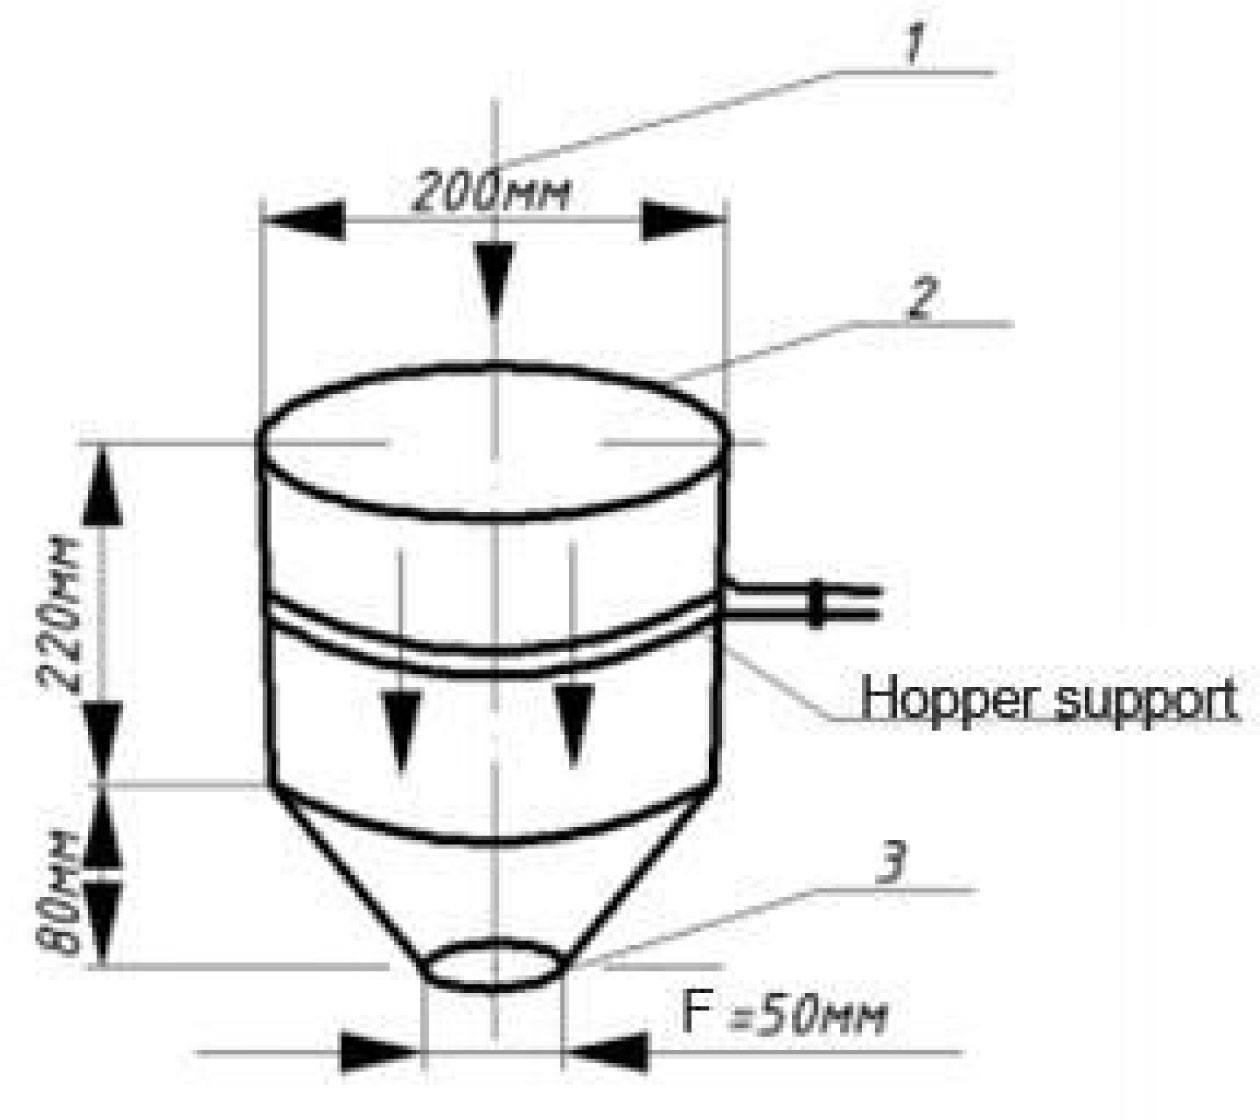
Fig. 4
Model of receiving hopper for stabilizing additives. 1 – direction of additives loading; 2 – inlet opening; 3 – outlet opening
Table 7
Indicators of properties of the bitumen with additives
| No. | Indicator name, unit of measurement | Additive content in bitumen (%) | BND 60/90 | Fiber |
|---|---|---|---|---|
| 1 | Needle penetration depth (0.1 mm) | |||
| at 25°C | 0 | 76 | - | |
| at 0°C | 23 | |||
| 2 | - | 47.0 | ||
| 23.4 | ||||
| 3 | - | 40.2 | ||
| 25.8 | ||||
| 4 | - | 37.4 | ||
| 25.3 | ||||
| 5 | - | 36.3 | ||
| 23.3 | ||||
| 2 | Ring-and-ball softening point (°C) | 0 | 50 | - |
| 2 | - | 64 | ||
| 4 | - | 67 | ||
| 5 | - | 75 | ||
| 7 | - | 78 | ||
| 3 | Elongation (cm) | |||
| at 25°C | 0 | 100 | - | |
| at 0°C | 4.2 | |||
| 2 | - | 43.3 | ||
| 3.5 | ||||
| 4 | - | 30.5 | ||
| 4.0 | ||||
| 5 | - | 27.2 | ||
| 4.2 | ||||
| 7 | 5.3 | |||
| 3.6 | ||||
| 4 | Brittleness point (°C) | 0 | −17 | - |
| 2 | - | −18 | ||
| 4 | - | −25 | ||
| 5 | - | −22 | ||
| 7 | - | −19 |
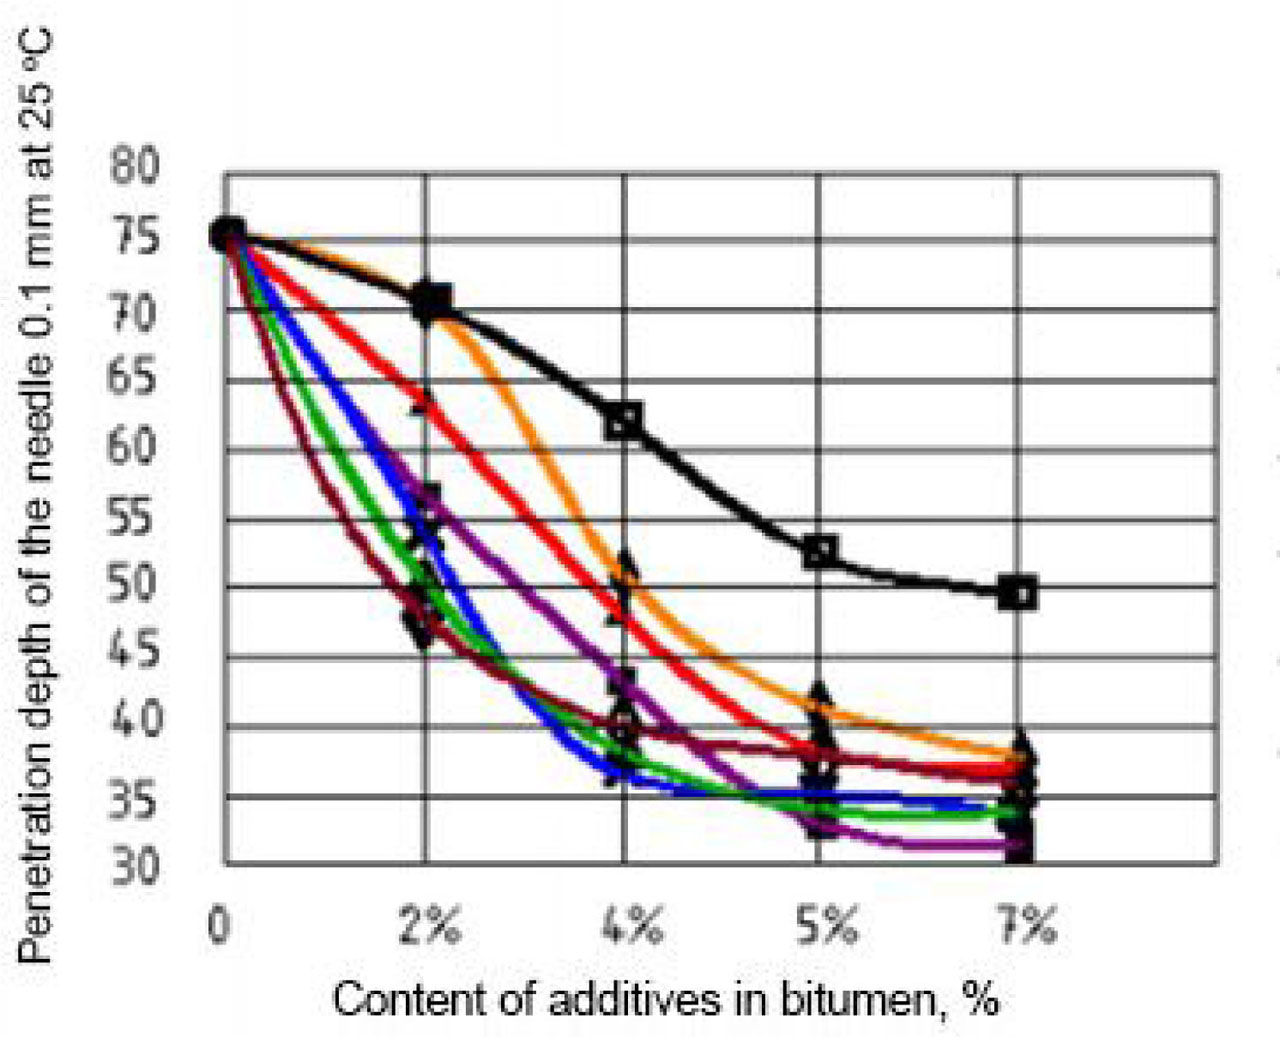
Fig. 5
Dependence of the indicators of the needle penetration depth into the bitumen on the content of the additive at 25°C
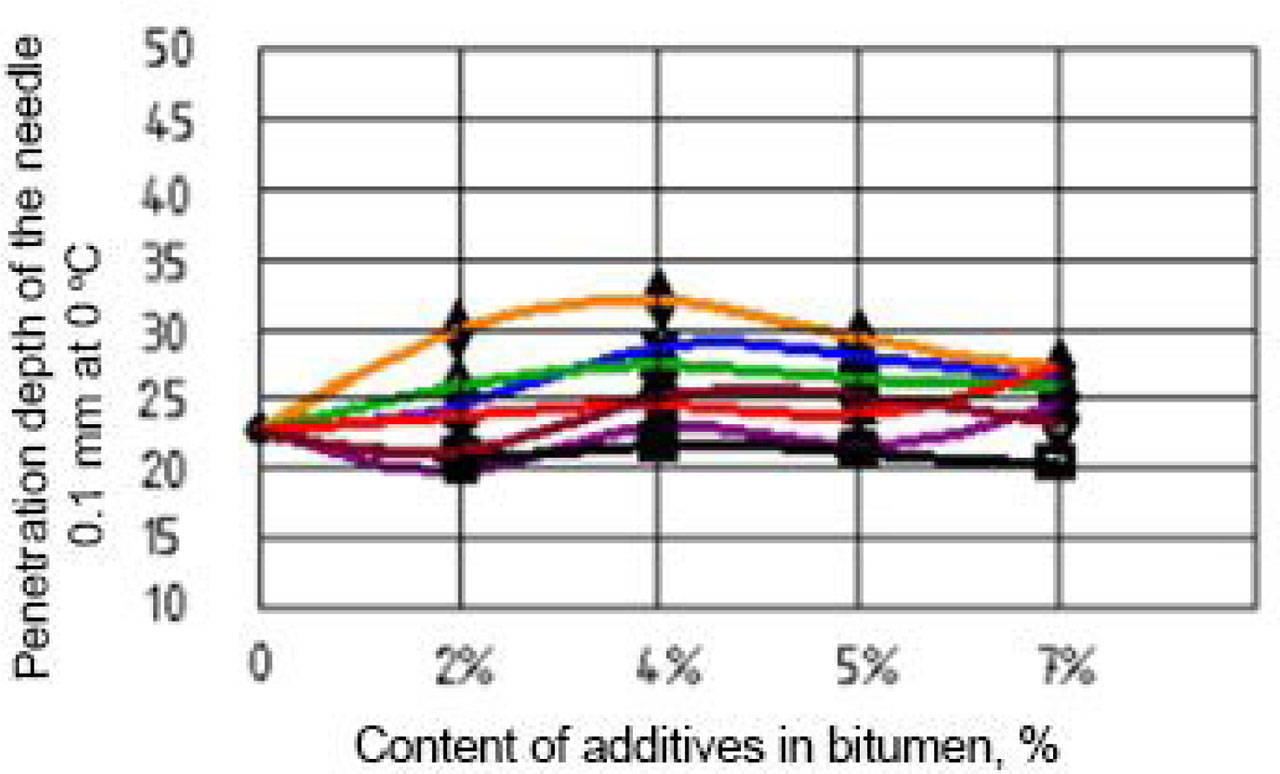
Fig. 6
Dependence of the indicators of the needle penetration depth into bitumen on the content of the additive at 0°C
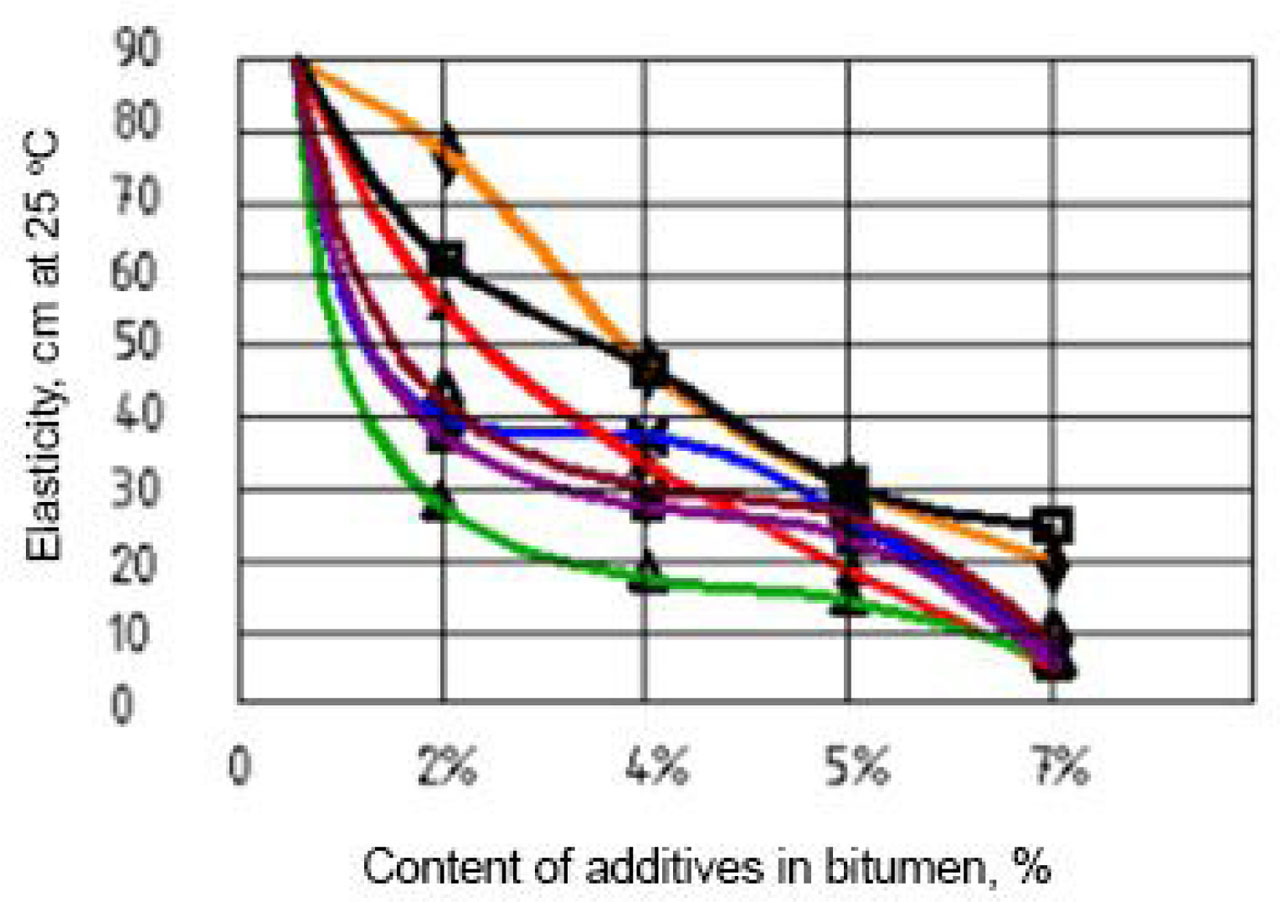
Fig. 7
Dependence of the indicators of the bitumen elongation on the content of the additive at 25°C
Table 8
The composition of the granular asphalt concrete mixture
| Mixture components | Amount (%) |
|---|---|
| Granular asphalt | 69.75 |
| New crushed stone | 30.22 |
| Fiber of fly ash from TPP in China | 4.0 |
| Bitumen BND 60/90 | 3.0 |
[i] TPP, thermal power plants.
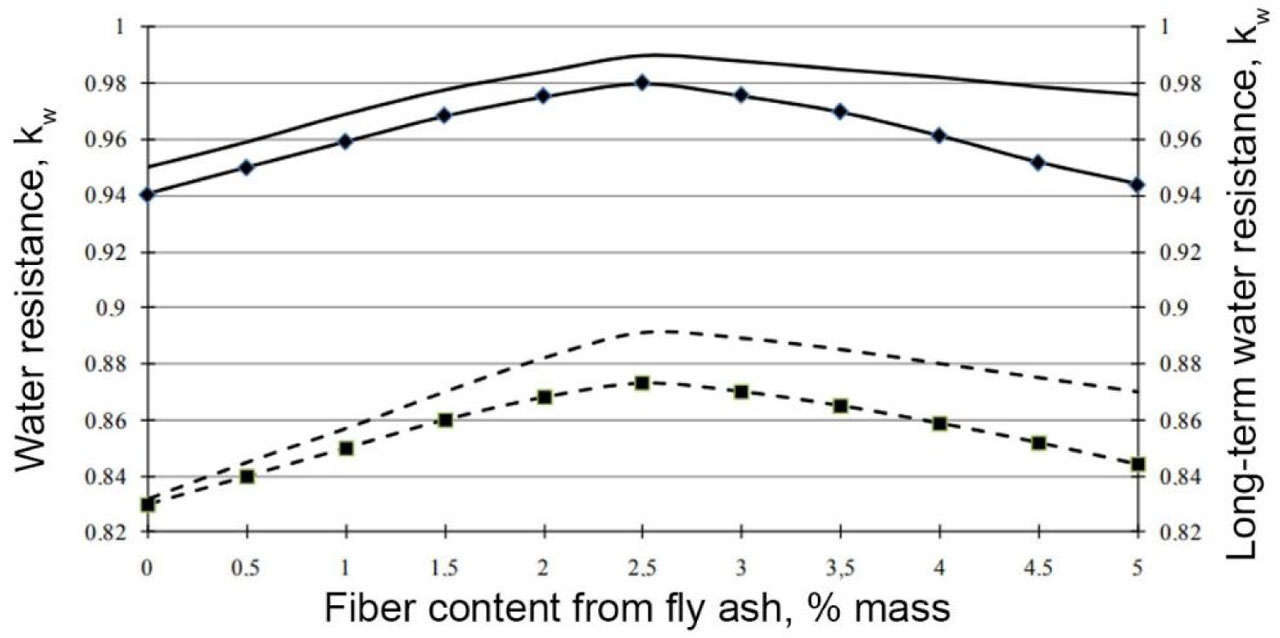
Fig. 8
The dependence of water resistance kw and water resistance at long-term water saturation kws of the hot granular asphalt concrete on the content of fiber of fly ash at the optimum bitumen content
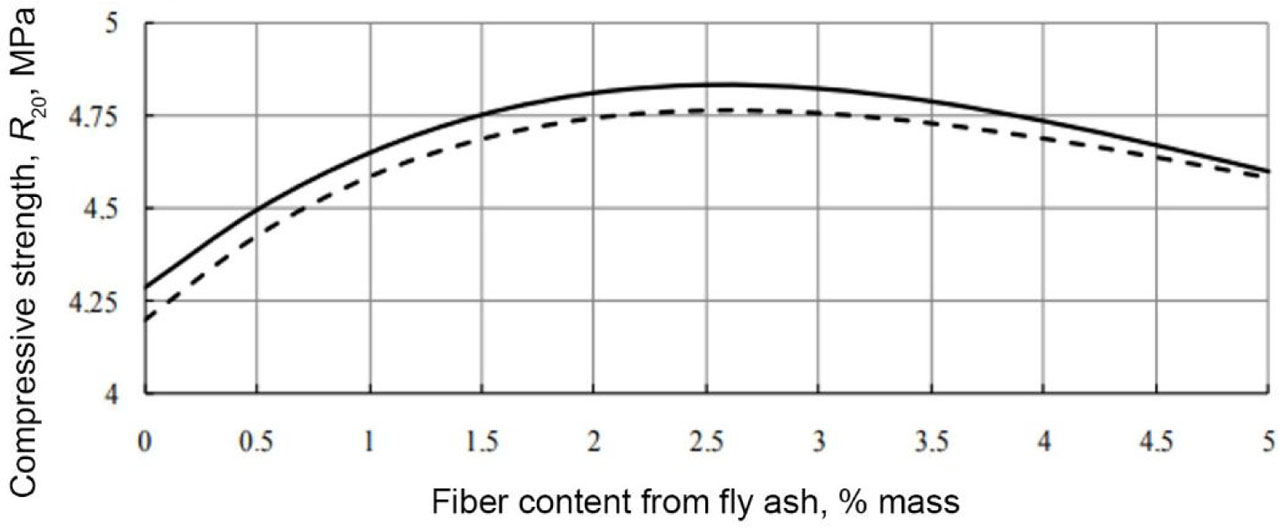
Fig. 9
Compressive strength R20 versus the content of fiber of fly ash at the optimal bitumen content
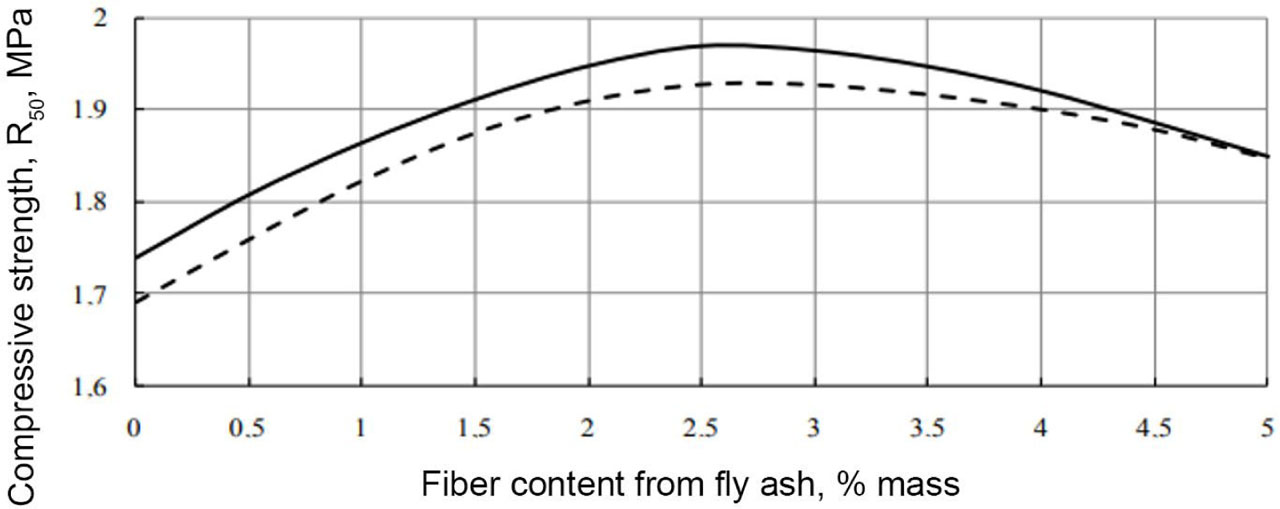
Fig. 10
Compressive strength R50 versus the content of fiber of fly ash at the optimal bitumen content
Table 9
Temperature of the hot granular asphalt concrete depending on the bitumen binder
| Needle penetration depth, 0.1 mm, at 25°C | Temperature (°C) | |
|---|---|---|
| When unloading | When laying, not less | |
| 40–60 incl. | 150–160 | 140 |
| 60–90 incl. | 145–150 | 145 |
Table 10
Influence of the temperature of mixing (Tmix) on the physical and mechanical properties of the fiber-reinforced granular asphalt concrete
| Indicator | Temperature of preparation (°C) | |||||||
|---|---|---|---|---|---|---|---|---|
| Granular asphalt concrete with fiber | Granular asphalt concrete | |||||||
| 140 | 145 | 150 | 155 | 140 | 145 | 150 | 155 | |
| Compressive strength (MPa): | ||||||||
| at 0°C, R0 | 8.07 | 8.64 | 8.35 | 8.21 | 7.59 | 8.2 | 7.89 | 7.76 |
| at 20°C, R20 | 4.3 | 4.71 | 4.55 | 4.42 | 3.37 | 3.78 | 3.62 | 3.53 |
| at 50°C, R50 | 1.7 | 1.9 | 1.83 | 1.79 | 1.04 | 1.19 | 1.85 | 1.82 |
| Water resistance (kw) | 0.89 | 0.96 | 0.93 | 0.92 | 0.8 | 0.87 | 0.84 | 0.84 |
| Water resistance during long-term water saturation (kws) | 0.81 | 0.87 | 0.84 | 0.82 | 0.74 | 0.8 | 0.7 | 0.76 |
| Water saturation (W, % by volume) | 2.28 | 2.2 | 2.16 | 2.1 | 2.68 | 2.72 | 2.97 | 2.99 |
Table 11
Test results of hot granular asphalt concrete mixtures
| Indicators | First option | Second option | ||
|---|---|---|---|---|
| Granular asphalt concrete with fiber | Granular asphalt concrete | Granular asphalt concrete with fiber | Granular asphalt concrete | |
| Compressive strength (MPa): | ||||
| at 0°C, R0 | 4.52 | 4.01 | 4.54 | 4.07 |
| at 20°C, R20 | 1.65 | 1.37 | 1.7 | 1.40 |
| at 50°C, R50 | ||||
| Water resistance (kw) | 0.96 | 0.83 | 0.94 | 0.84 |
| Water resistance at long-term water saturation (kws) | 0.84 | 0.72 | 0.8 | 0.70 |
| Water saturation (W, % by volume) | 2.1 | 2.41 | 2.35 | 2.4 |