
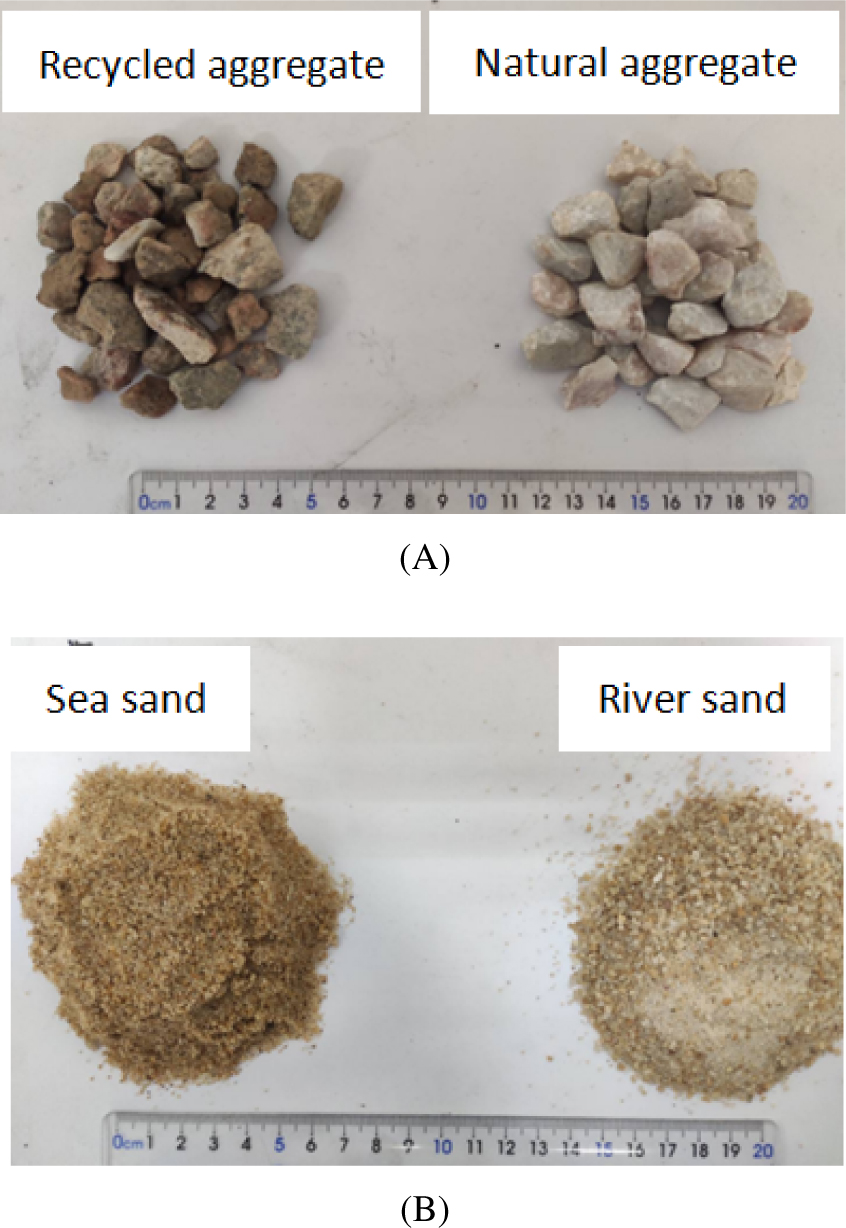
Fig. 1
Aggregate used in this research. (A) Coarse aggregate. (B) Fine aggregate
Table 1
Basic performance index of aggregate
| Aggregate type | Particle size (mm) | Apparent density (kg/m3) | Bulk density (kg/m3) | Water absorption (%) | Crushing index (%) |
|---|---|---|---|---|---|
| Natural coarse aggregate | 5–20 | 2,780 | 1,420 | 0.15 | 9.22 |
| Recycled coarse aggregate | 5–20 | 2,250 | 1,380 | 6.07 | 15.97 |
[i] *The apparent density, bulk density, water absorption, and crushing index are determined in accordance with the specification “Gravel and Crushed Stone for Construction” (GB/T 14685-2011).
Table 2
Main chemical composition of FA and slag
| Combined components | Loss on ignition (%) | CaO (%) | SiO2 (%) | Al2O3 (%) | MgO (%) | Fe2O3 (%) | SO3 (%) |
|---|---|---|---|---|---|---|---|
| FA | 3.79 | 6.66 | 42.34 | 25.84 | 1.17 | 5.46 | 0.95 |
| Slag | 0.34 | 34.45 | 27.46 | 16.24 | 8.46 | 0.42 | 0.81 |
[i] FA, fly ash
Table 3
NaOH solution formulation
| Molarity | Proportion of NaOH solids (wt.%) | Proportion of distilled water (wt.%) |
|---|---|---|
| 8 mol/L | 25.1 | 74.9 |
| 12 mol/L | 32.43 | 67.57 |
| 16 mol/L | 39.02 | 60.98 |
Table 4
Chemical properties of sodium silicate solution
| Modulus | Baume degree (Be) | Na2O (wt.%) | SiO2 (wt.%) | H2O (wt.%) |
|---|---|---|---|---|
| 3.12 | 40 | 8.5 | 26.5 | 65 |
Table 5
Mixture proportion of orthogonal test (kg/m3)
| Test number | FA | Slag | SS | NA | NaOH solution | Na2SiO3 solution | Slag content (%) | Water-binder ratio | NaOH solution concentration |
|---|---|---|---|---|---|---|---|---|---|
| 1 | 499 | 55 | 449 | 1,047 | 70 | 175 | 10 | 0.3 | 8 mol/L |
| 2 | 322 | 81 | 495 | 1,153 | 70 | 175 | 20 | 0.4 | 12 mol/L |
| 3 | 219 | 94 | 522 | 1,215 | 70 | 175 | 30 | 0.5 | 16 mol/L |
| 4 | 266 | 66 | 516 | 1,202 | 70 | 175 | 20 | 0.5 | 8 mol/L |
| 5 | 376 | 161 | 454 | 1,058 | 70 | 175 | 30 | 0.3 | 12 mol/L |
| 6 | 352 | 39 | 498 | 1,160 | 70 | 175 | 10 | 0.4 | 16 mol/L |
| 7 | 291 | 125 | 491 | 1,144 | 70 | 175 | 30 | 0.4 | 8 mol/L |
| 8 | 290 | 32 | 519 | 1,209 | 70 | 175 | 10 | 0.5 | 12 mol/L |
| 9 | 417 | 104 | 459 | 1,070 | 70 | 175 | 20 | 0.3 | 16 mol/L |
[i] *Water-binder ratio refers to the sum of water contained in NaOH solution and Na2SiO3 solution, except the solute, divided by the value of the sum of the FA and slag.
[ii] *The sum of the masses of FA, slag, fine aggregate, and coarse aggregate of all groups is the same.
[iii] FA, fly ash; NA, natural aggregate; SS, sea sand.
Table 6
Mixture proportions of paste and mortar (kg/m3)
| No. | FA | Slag | SS | RS | NaOH solution | Na2SiO3 solution |
|---|---|---|---|---|---|---|
| Seawater paste | 840 | 360 | 0 | 0 | 156* | 391 |
| DWP | 840 | 360 | 0 | 0 | 156 | 391 |
| SSM | 840 | 360 | 600 | 0 | 156 | 391 |
| RSM | 840 | 360 | 0 | 600 | 156 | 391 |
Table 7
Mixture proportions of two-factor test (kg/m3)
| NO. | FA | Slag | Sand | NA | RA | NaOH solution | Na2SiO3 solution | RA replacement rate | Type of sand | Combined components |
|---|---|---|---|---|---|---|---|---|---|---|
| SG-0 | 375.7 | 161.1 | 454.4 | 1,058.7 | 0 | 70 | 175 | 0 | SS | Geopolymer |
| SG-25 | 375.7 | 161.1 | 454.4 | 794.1 | 264.7 | 70 | 175 | 25% | SS | Geopolymer |
| SG-50 | 375.7 | 161.1 | 454.4 | 529.4 | 529.4 | 70 | 175 | 50% | SS | Geopolymer |
| SG-75 | 375.7 | 161.1 | 454.4 | 264.7 | 794.1 | 70 | 175 | 75% | SS | Geopolymer |
| SG-100 | 375.7 | 161.1 | 454.4 | 0 | 1,058.7 | 70 | 175 | 100% | SS | Geopolymer |
| RG-0 | 375.7 | 161.1 | 454.4 | 1,058.8 | 0 | 70 | 175 | 0 | RS | Geopolymer |
| RG-50 | 375.7 | 161.1 | 454.4 | 529.4 | 529.4 | 70 | 175 | 50% | RS | Geopolymer |
| RG-100 | 375.7 | 161.1 | 454.4 | 0 | 1,058.8 | 70 | 175 | 100% | RS | Geopolymer |
| Portland Cement | Distilled water | |||||||||
| SPC-100 | 536.8 | 454.4 | 0 | 1,058.8 | 161.1 | 100% | SS | Portland cement | ||
| RPC-100 | 536.8 | 454.4 | 0 | 1,058.8 | 161.1 | 100% | RS | Portland cement |
[i] *The mass of Portland cement is equal to the sum of the mass of FA and slag; the mass of water is equal to the sum of the mass of water in NaOH solution and Na2SiO4 solution.
[ii] *S stands for sea sand; R stands for river sand; G stands for geopolymer; PC stands for ordinary Portland cement; the last number represents the RA replacement ratio.
[iii] FA, fly ash; NA, natural aggregate; RA, recycled aggregate; RS, river sand; SS, sea sand.
Table 8
Average values of various factors in orthogonal test
| Variables and grades | 3 days compressive strength/MPa | 28 days compressive strength/MPa | 28 days splitting tensile strength/MPa | Cylinder compressive strength/MPa | Elastic modulus/GPa | Slump/mm | Poisson’s ratio |
|---|---|---|---|---|---|---|---|
| A1 | 10.28 | 21.05 | 1.21 | 17.55 | 9.20 | 235 | 0.21 |
| A2 | 15.38 | 29.03 | 1.36 | 27.07 | 11.20 | 237 | 0.23 |
| A3 | 15.41 | 29.89 | 1.53 | 22.53 | 9.50 | 230 | 0.18 |
| B1 | 8.29 | 19.09 | 1.21 | 17.12 | 9.03 | 231 | 0.22 |
| B2 | 14.25 | 27.75 | 1.39 | 21.65 | 10.30 | 236 | 0.18 |
| B3 | 18.54 | 33.14 | 1.50 | 28.38 | 10.57 | 235 | 0.22 |
| C1 | 19.32 | 35.92 | 1.67 | 29.34 | 13.57 | 208 | 0.15 |
| C2 | 12.29 | 24.40 | 1.37 | 22.90 | 9.50 | 239 | 0.24 |
| C3 | 9.47 | 19.65 | 1.06 | 14.91 | 6.83 | 256 | 0.24 |
[i] *A stands for the NaOH solution concentration, A1 = 8 mol/L, A2 = 12 mol/L, A3 = 16 mol/L; B stands for the slag content, B1 = 10%, B2 = 20%, B3 = 30%; C stands for the water-binder ratio, C1 = 0.3, C2 = 0.4, C3 = 0.5.
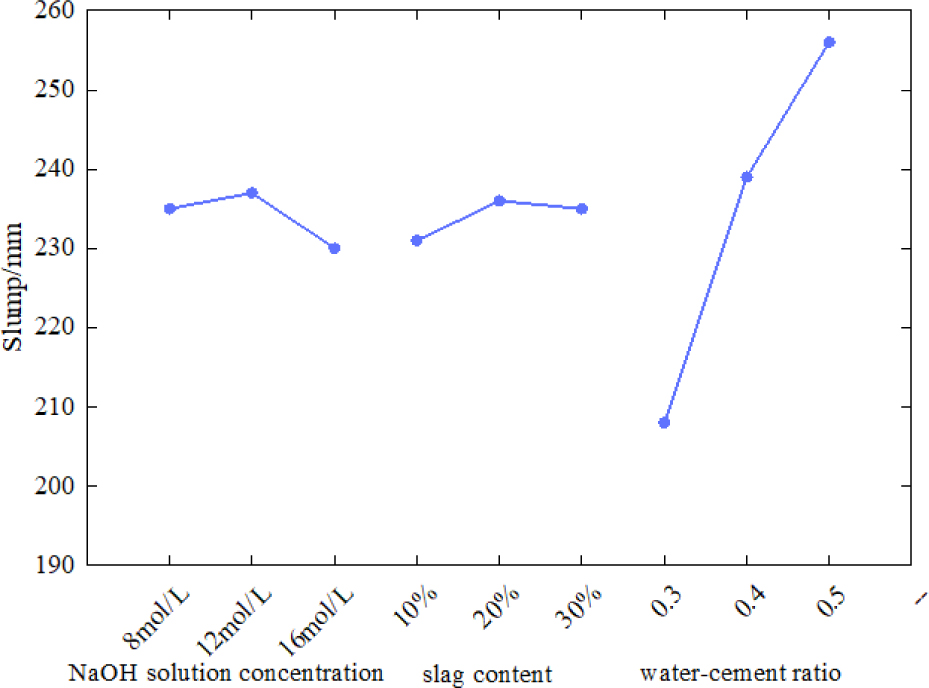
Fig. 2
Factors affecting slump
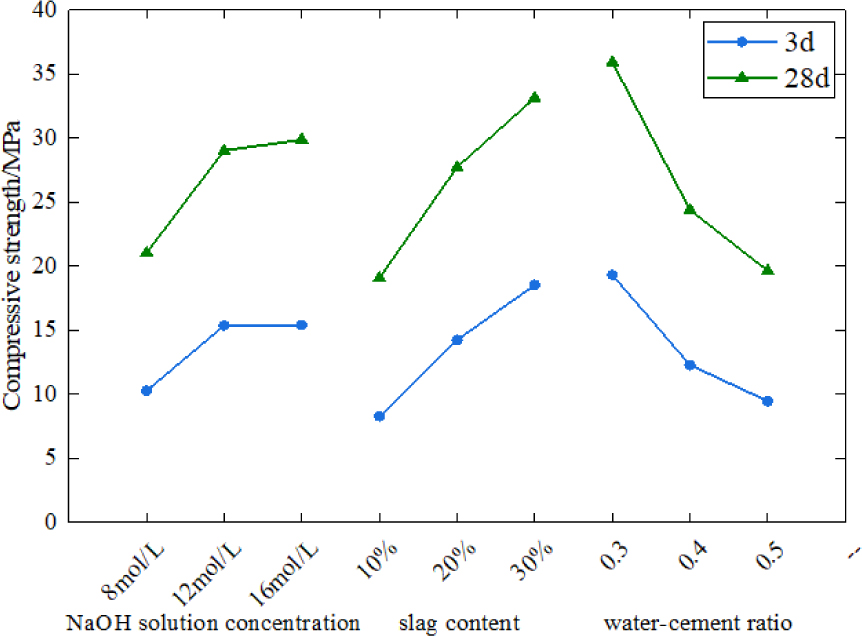
Fig. 3
Factors affecting compressive strength
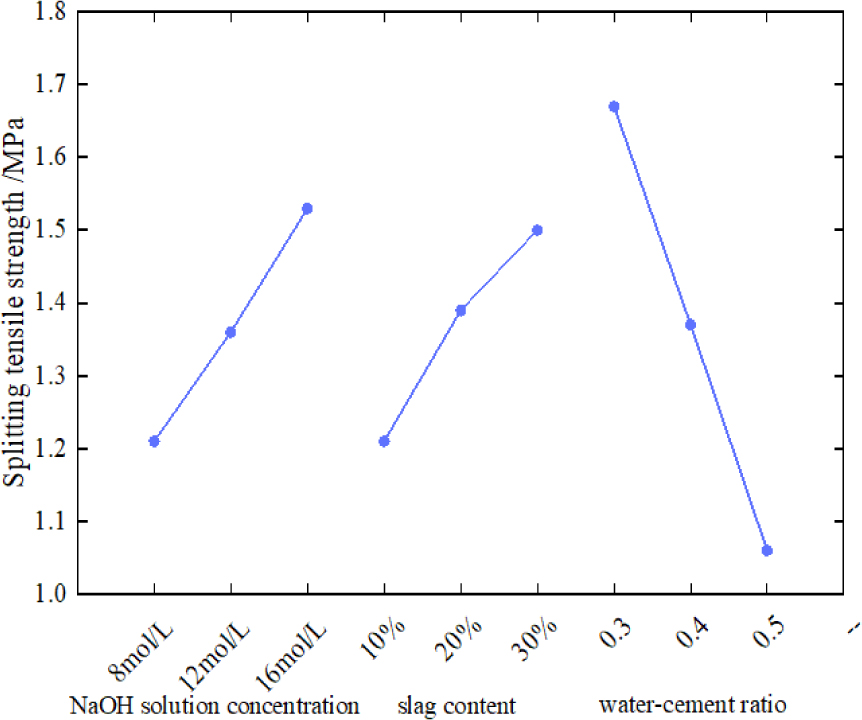
Fig. 4
Factors affecting splitting tensile strength
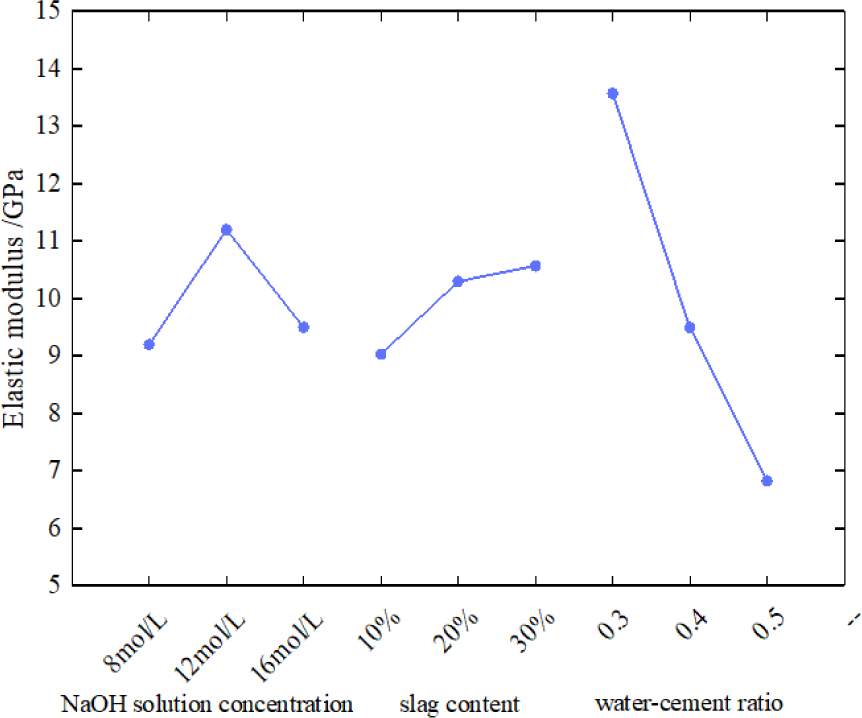
Fig. 5
Factors affecting elastic modulus
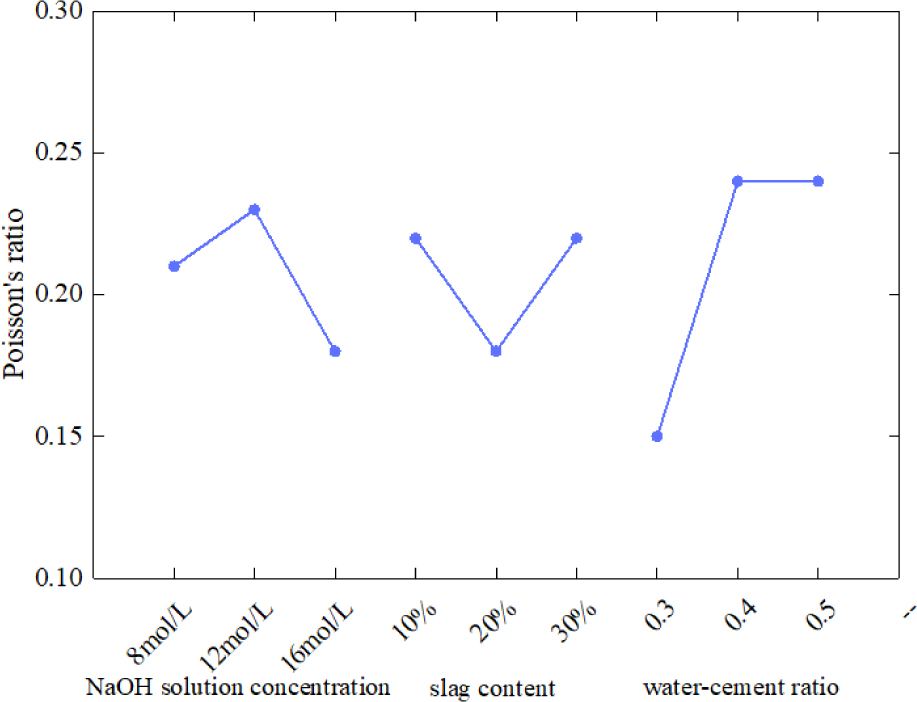
Fig. 6
Factors affecting Poisson’s ratio
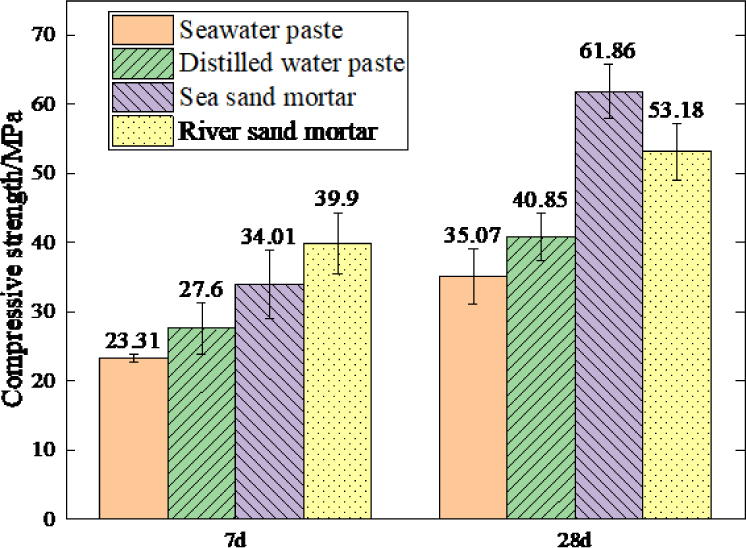
Fig. 7
Compressive strength of paste and mortar
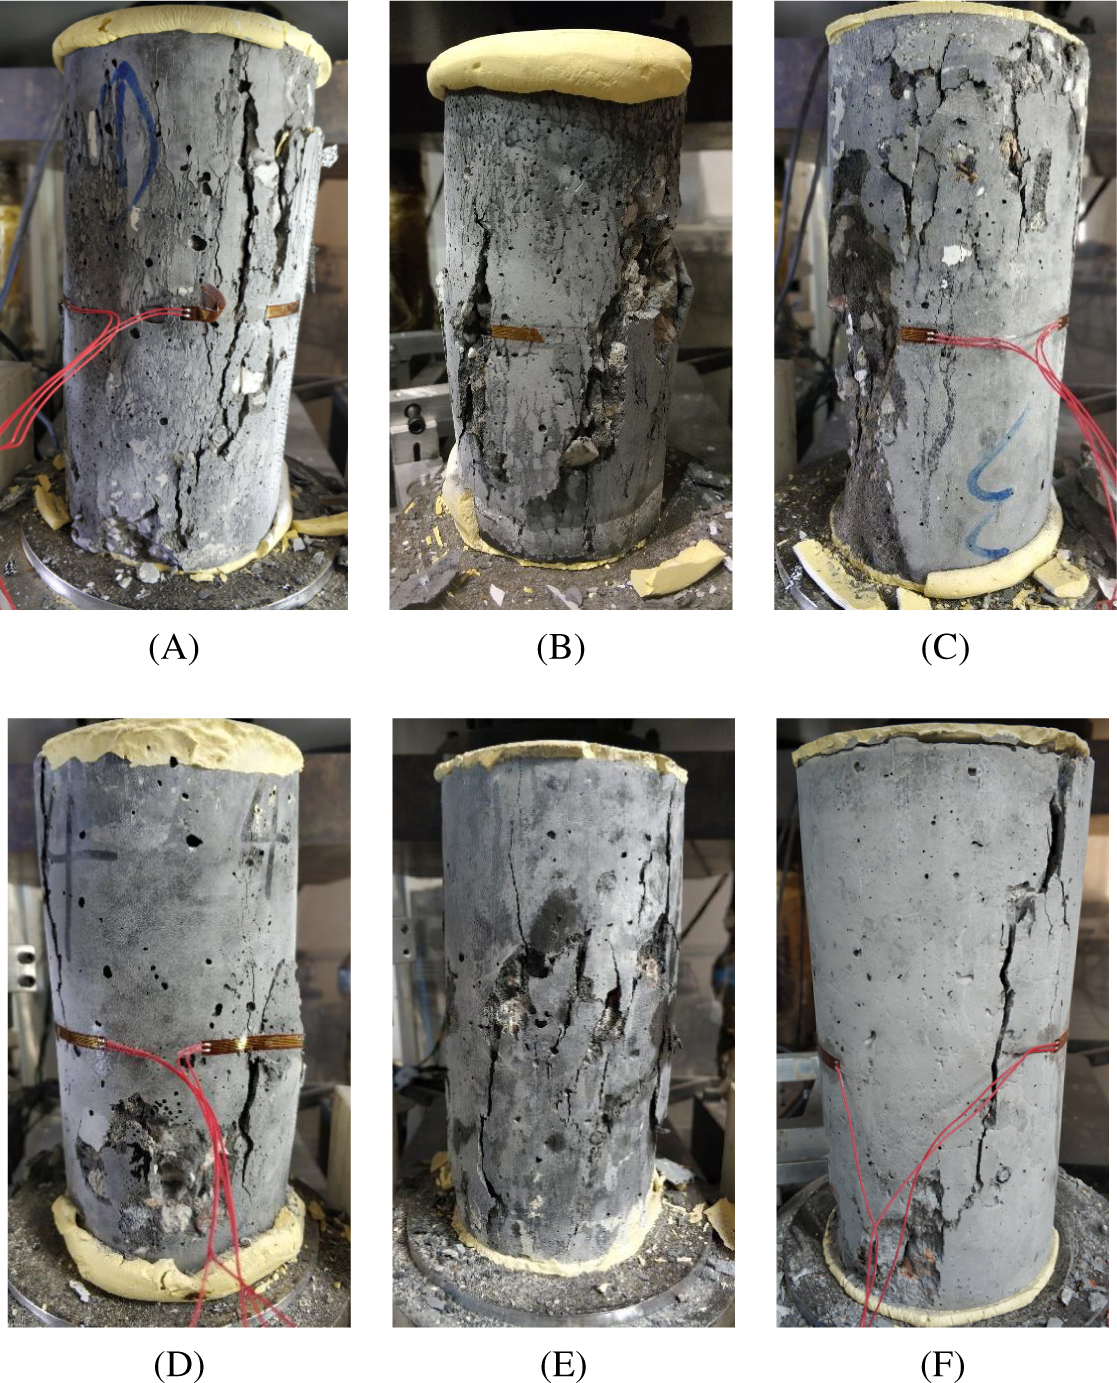
Fig. 8
Failure mode of the SS group. (A) SG-0, (B) SG-25, (C) SG-50, (D) SG-75, (E) SG-100, (F) SPC-100. SS, sea sand
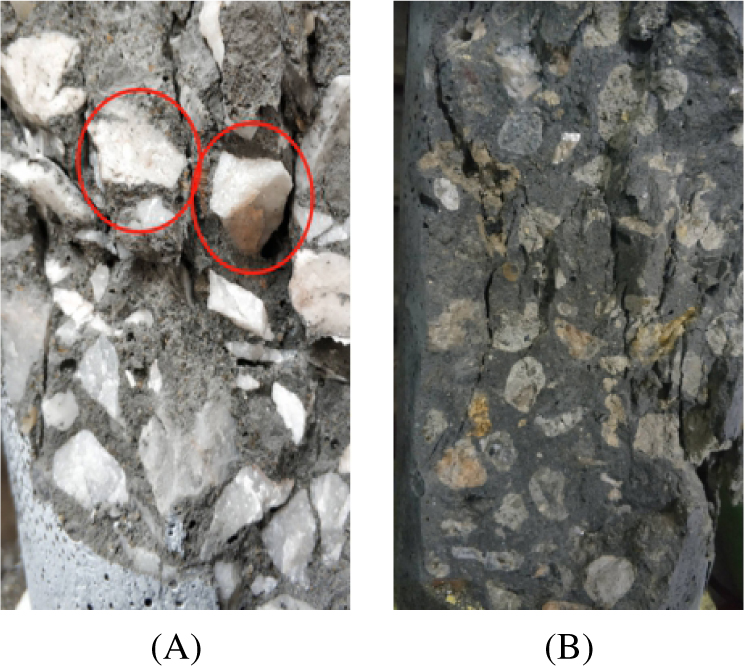
Fig. 9
Fracture surface of specimens. (A) Fracture surface of NA, (B) Fracture surface of RA. NA, natural aggregate; RA, recycled aggregate
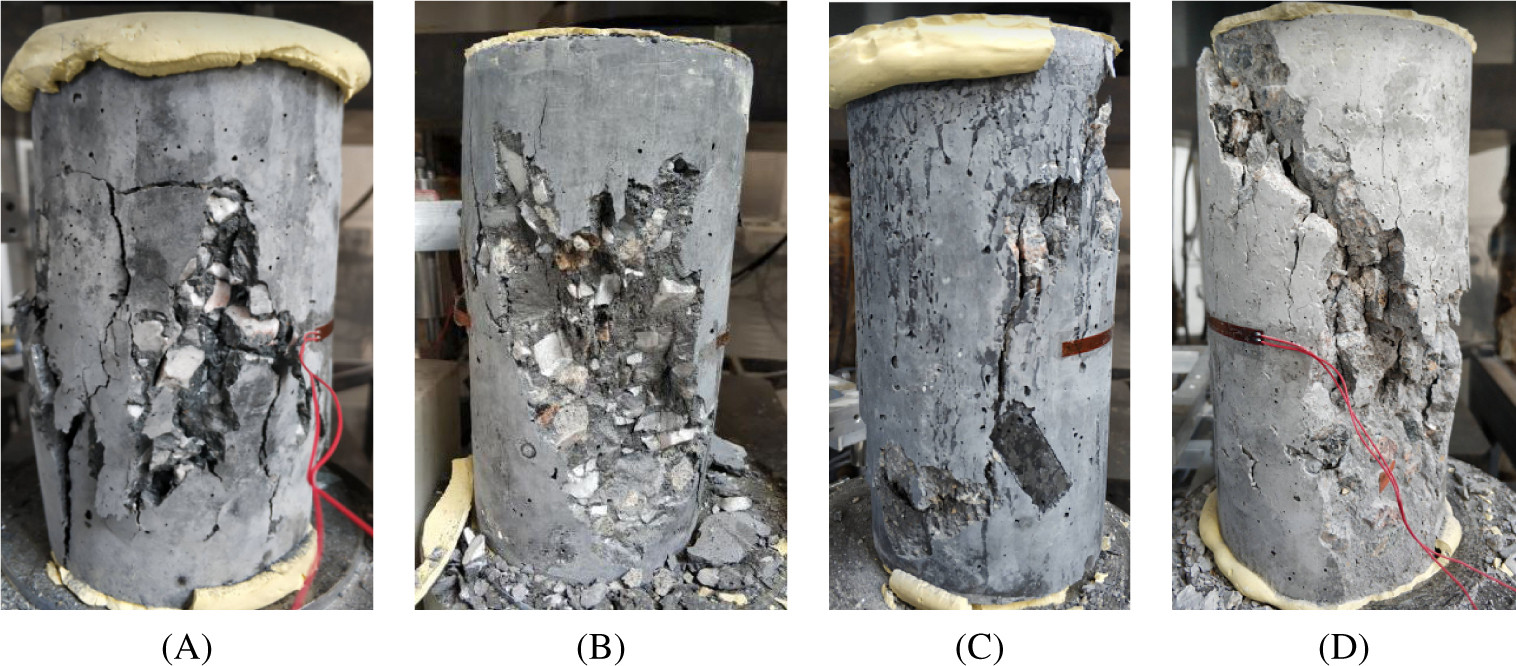
Fig. 10
Failure mode of RS group. (A) RG-0, (B) RG-50, (C) RG-100, (D) RPC-100. RS, river sand
Table 9
Test results of two-factor test
| NO. | Compressive strength/MPa | Flexural strength/MPa | Splitting tensile strength/MPa | Elastic modulus/GPa | Poisson’s ratio | Slump | |||||
|---|---|---|---|---|---|---|---|---|---|---|---|
| 7 days | 28 days | 7 days | 28 days | 7 days | 28 days | 7 days | 28 days | 7 days | 28 days | ||
| SG-0 | 44.92 | 61.67 | 2.98 | 4.13 | 1.24 | 1.73 | 12.6 | 20.3 | 0.25 | 0.21 | 240 |
| SG-25 | 43.24 | 60.10 | 3.07 | 3.92 | 1.26 | 1.65 | 12.8 | 20.5 | 0.19 | 0.23 | 250 |
| SG-50 | 43.92 | 61.97 | 3.13 | 3.95 | 1.33 | 1.58 | 14.0 | 20.7 | 0.16 | 0.17 | 254 |
| SG-75 | 42.67 | 60.43 | 3.11 | 3.81 | 1.30 | 1.52 | 12.5 | 18.8 | 0.19 | 0.21 | 255 |
| SG-100 | 42.64 | 54.80 | 3.08 | 3.70 | 1.31 | 1.44 | 13.9 | 18.1 | 0.13 | 0.30 | 260 |
| RG-0 | 55.79 | 66.60 | 3.60 | 4.47 | 1.63 | 1.73 | 15.6 | 23.8 | 0.19 | 0.30 | 235 |
| RG-50 | 49.89 | 57.83 | 2.65 | 2.95 | 1.35 | 1.50 | 8.8 | 17.4 | 0.20 | 0.30 | 245 |
| RG-100 | 44.94 | 49.50 | 2.34 | 2.53 | 1.10 | 1.18 | 6.6 | 11.1 | 0.25 | 0.22 | 250 |
| SPC-100 | 38.88 | 44.23 | 3.87 | 4.24 | 1.33 | 1.50 | 24.1 | 25.9 | 0.24 | 0.13 | 115 |
| RPC-100 | 30.74 | 35.93 | 3.02 | 3.53 | 1.33 | 1.28 | 23.9 | 25.1 | 0.09 | 0.19 | 110 |
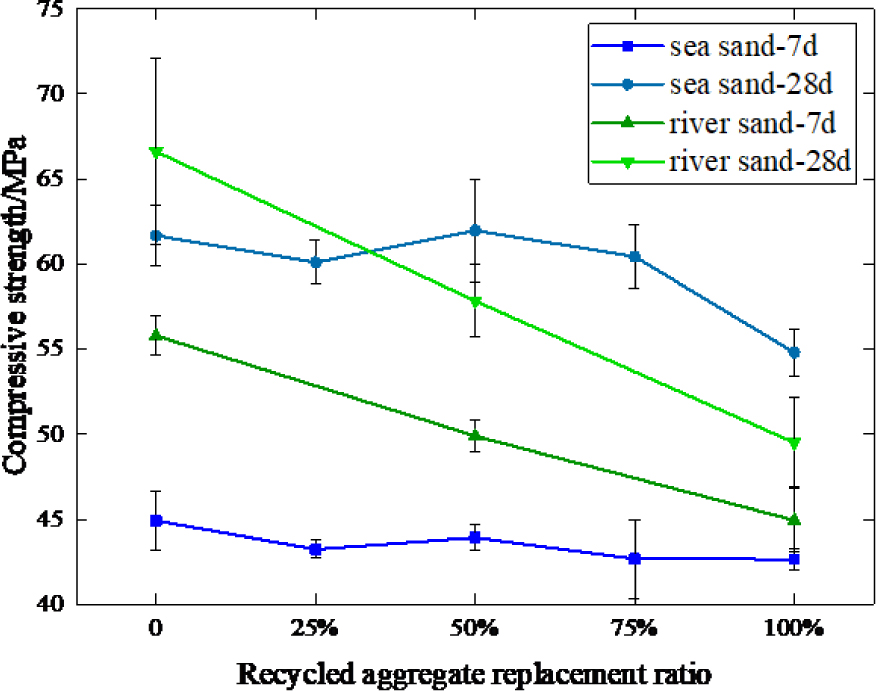
Fig. 11
Influence of RA replacement ratio and sand types on compressive strength. RA, recycled aggregate
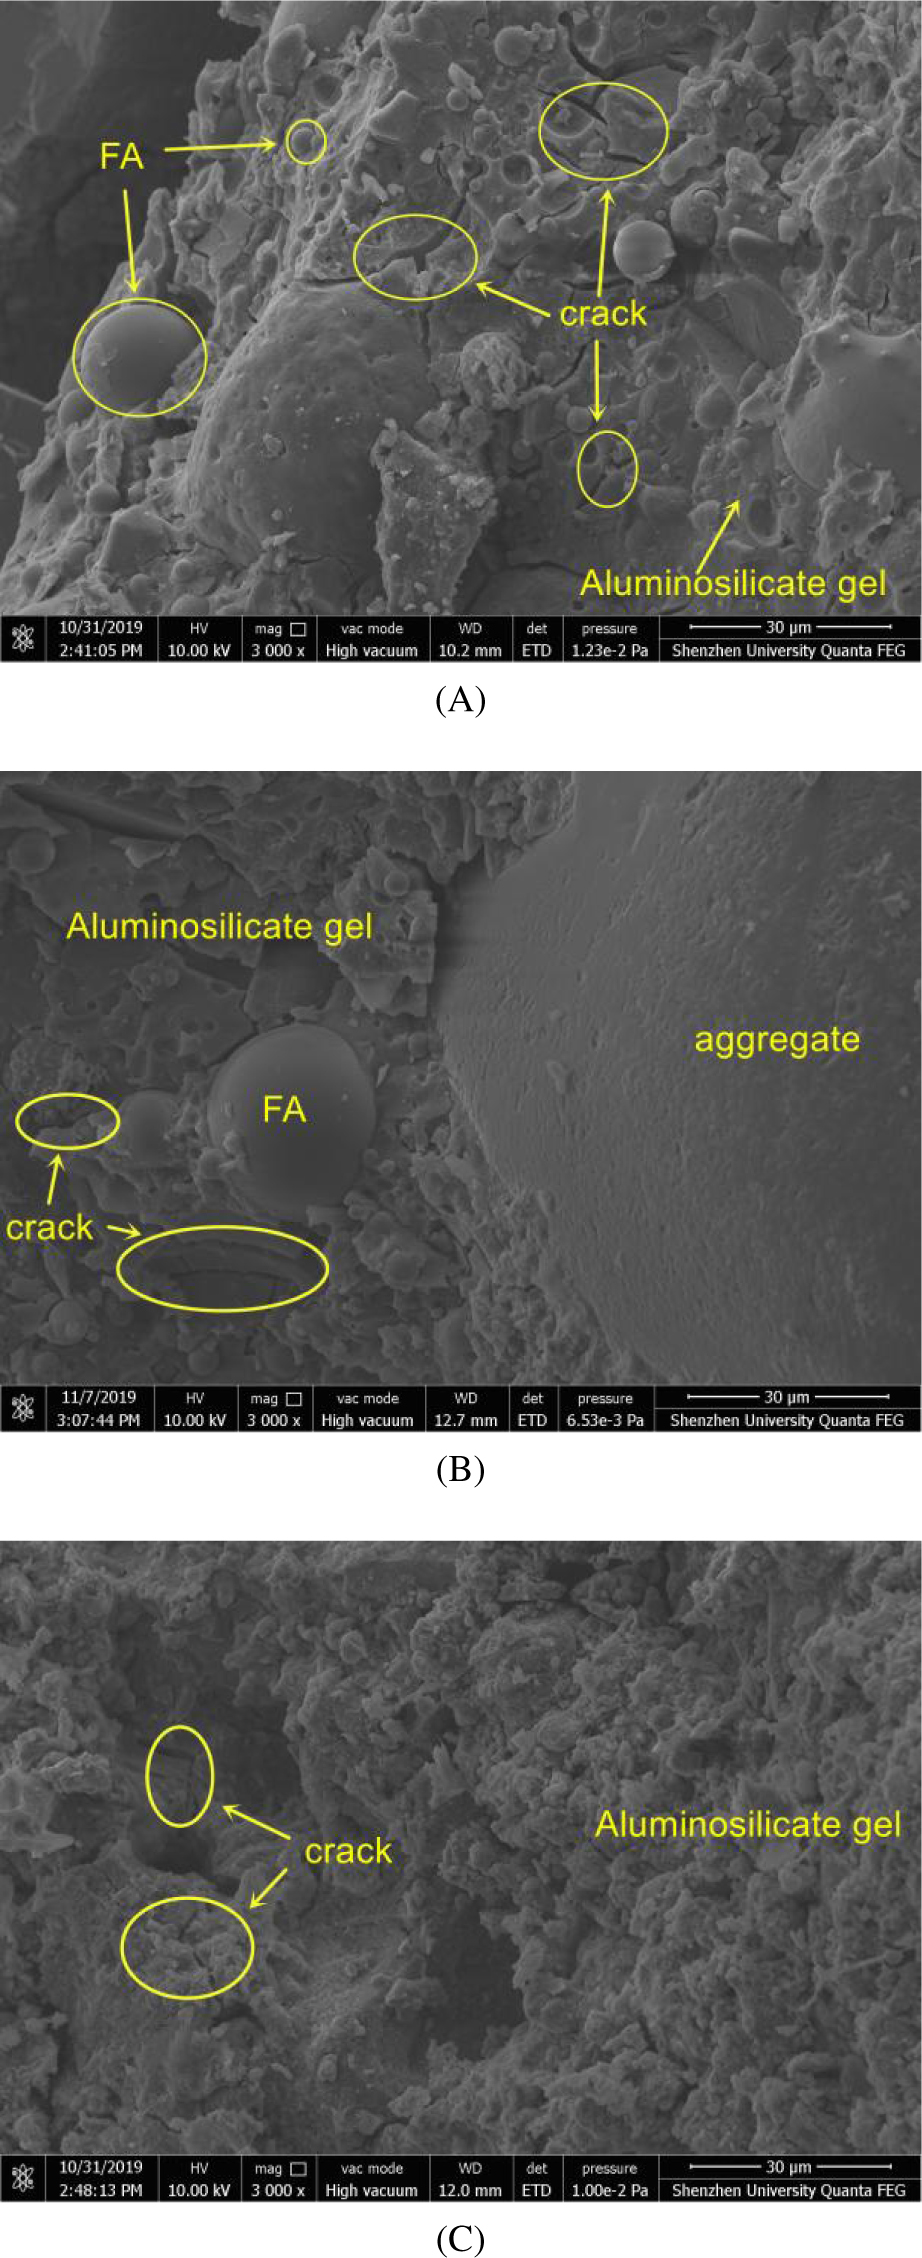
Fig. 12
SEM photos of SS group at 7 days. (A) SG-0, (B) SG-50, (C) SG-100. SEM, scanning electron microscopy. SS, sea sand
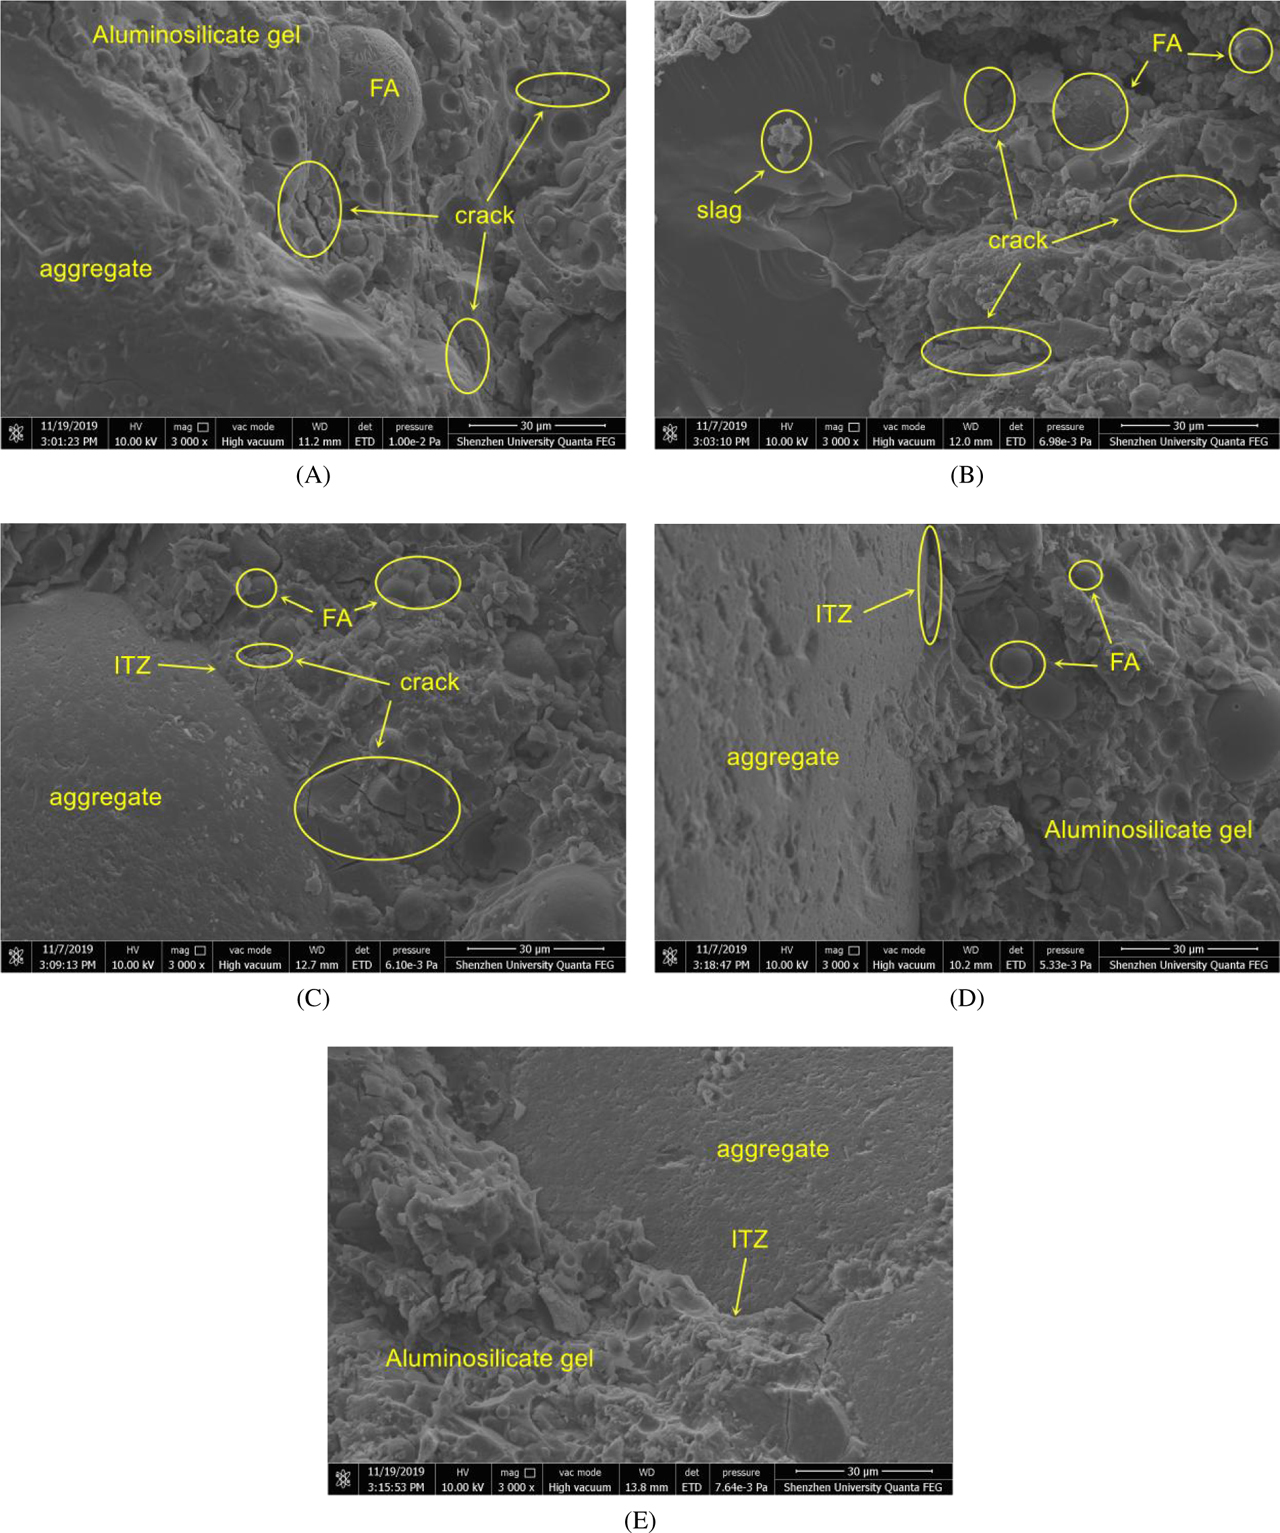
Fig. 13
SEM photos of SS group at 28 days. (A) SG-0, (B) SG-25, (C) SG-50, (D) SG-75, (E) SG-100. FA, fly ash; ITZ, interface transportation zone; SEM, scanning electron microscopy; SS, sea sand
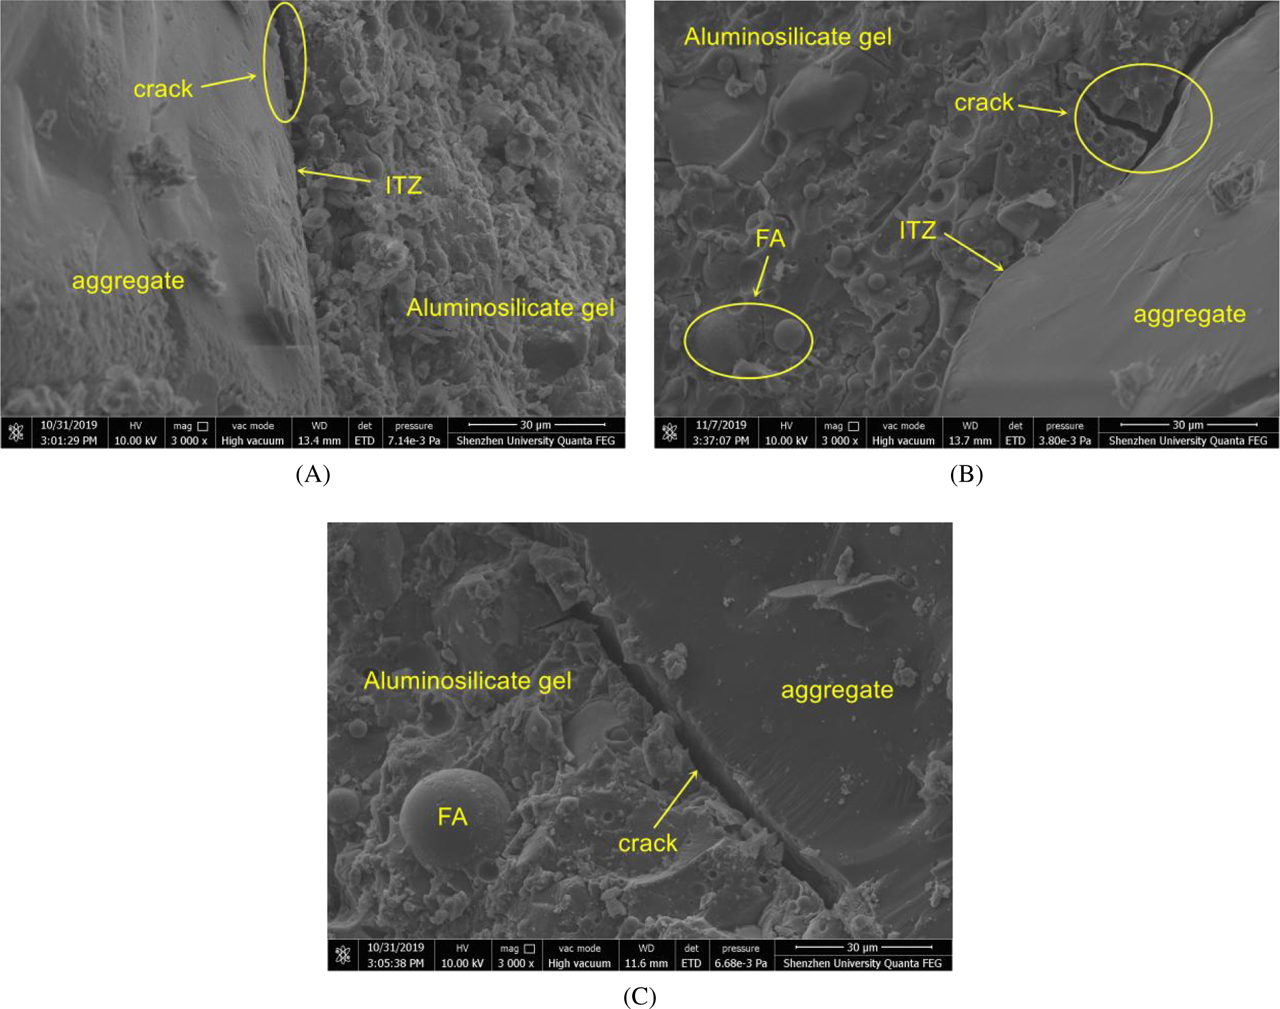
Fig. 14
SEM photos of RS group at 7 days. (A) RG-0, (B) RG-50, (C) RG-100. RS, river sand. ITZ, interface transportation zone; SEM, scanning electron microscopy
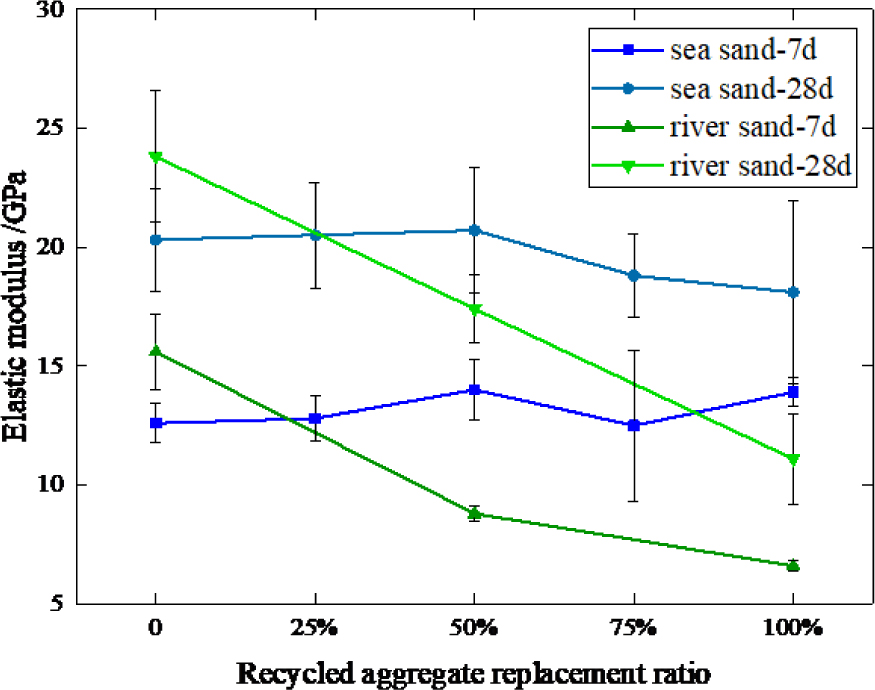
Fig. 15
Influence of RA replacement ratio and sand types on elastic modulus. RA, recycled aggregate
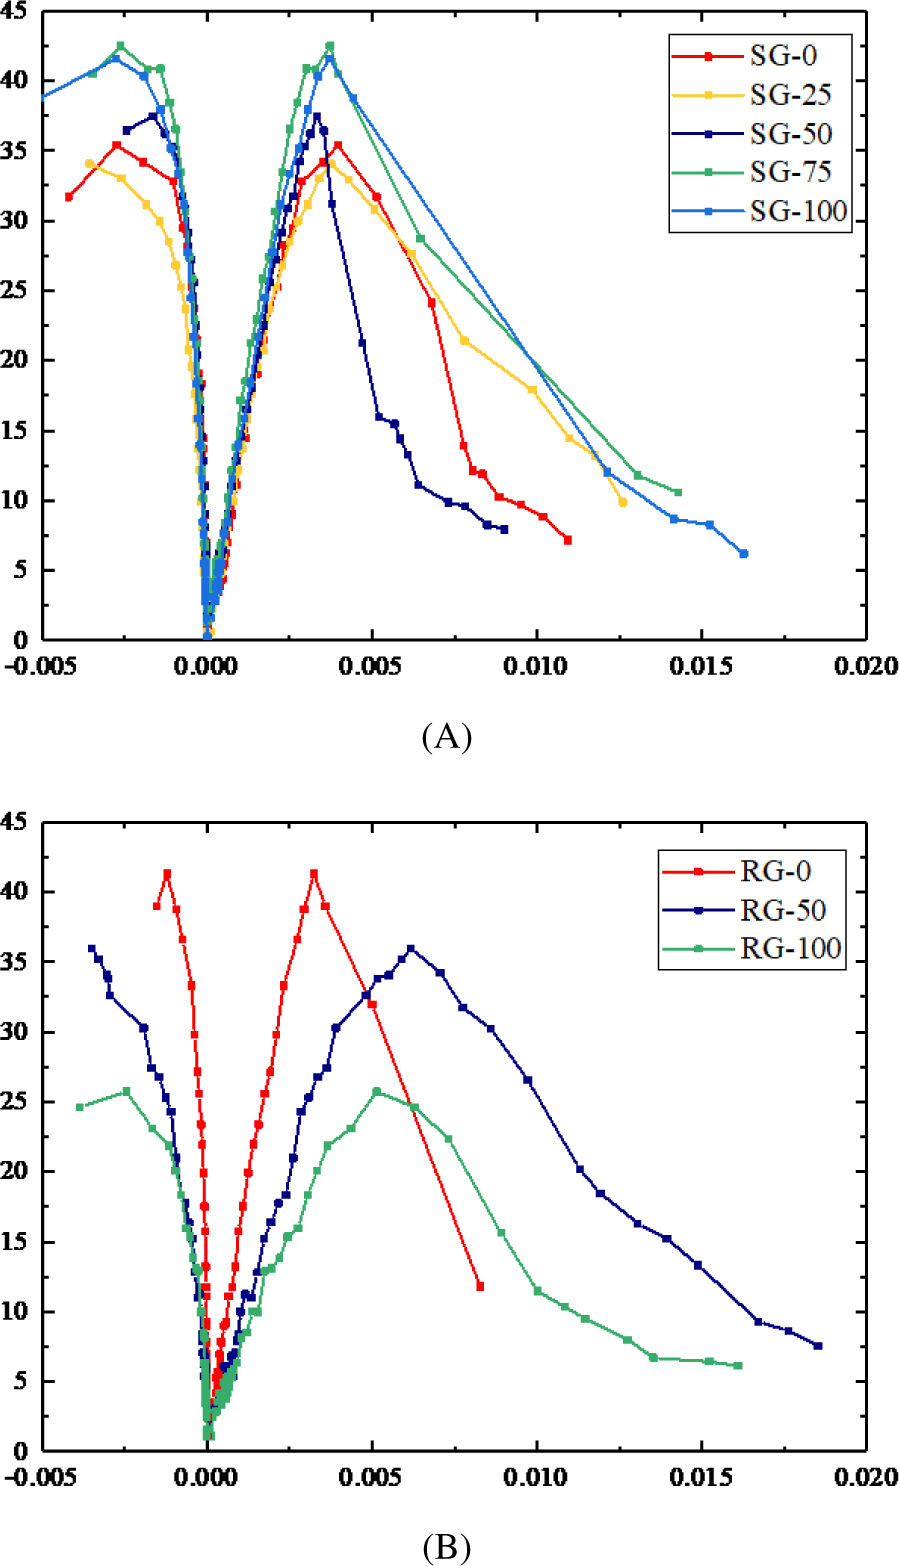
Fig. 16
Stress–strain curves at 7 days. (A) SS–GPC, (B) RS–GPC. RS–GPC, river sand geopolymer concrete; SS–GPC, sea sand geopolymer concrete
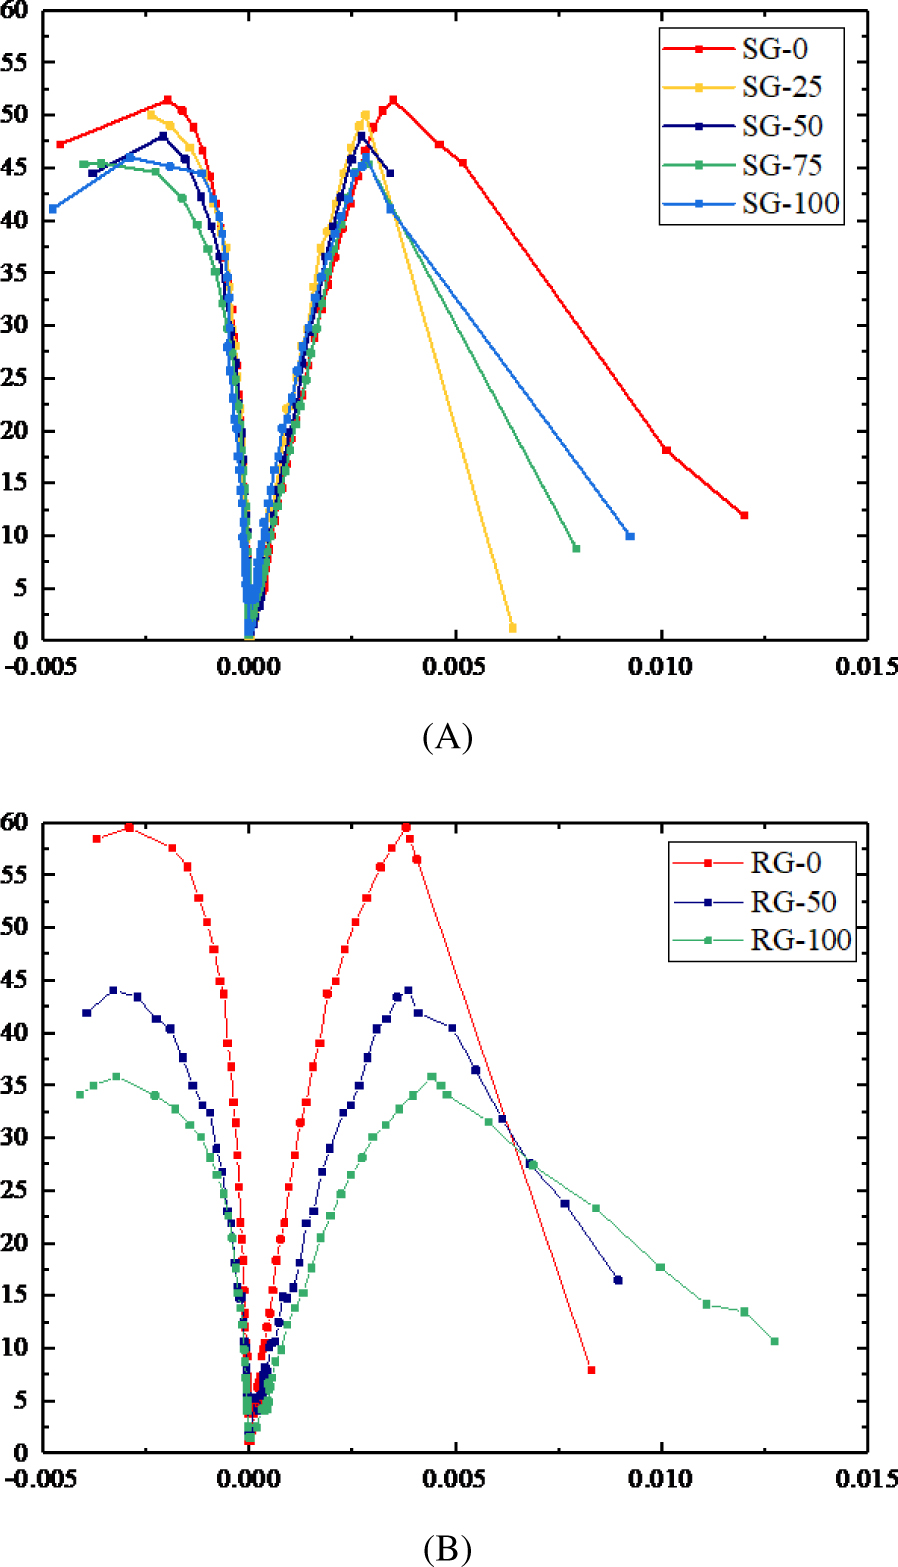
Fig. 17
Stress–strain curves at 28 days. (A) SS–GPC, (B) RS–GPC. RS, river sand geopolymer concrete; SS–GPC, sea sand geopolymer concrete
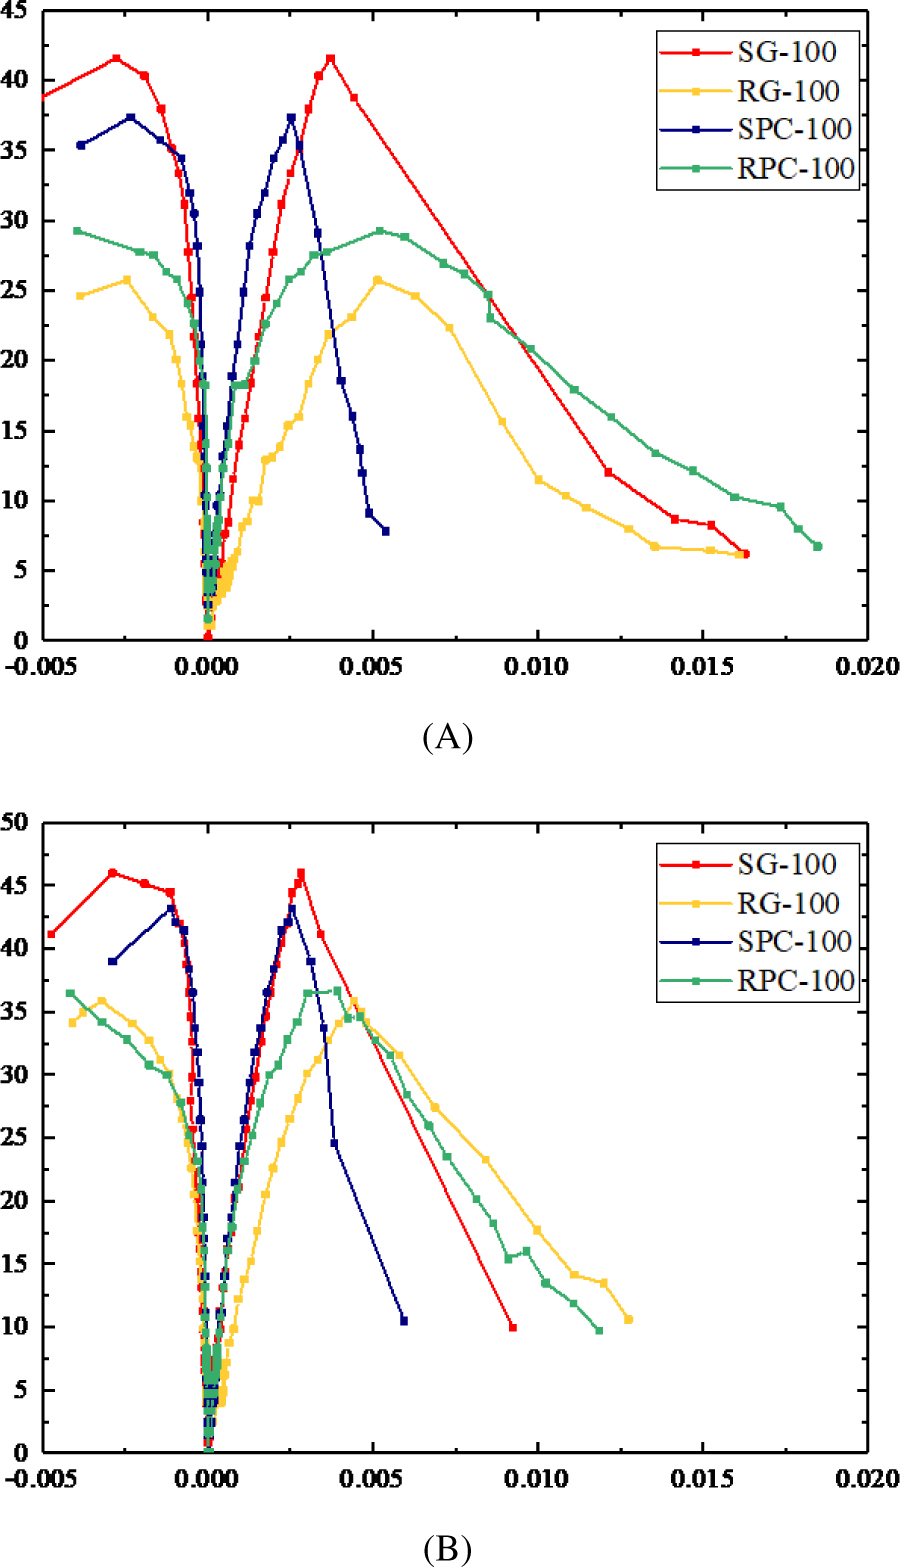
Fig. 18
Comparison of GPC and ordinary silicate concrete. (A) 7 days, (B) 28 days. GPC, geopolymer concrete
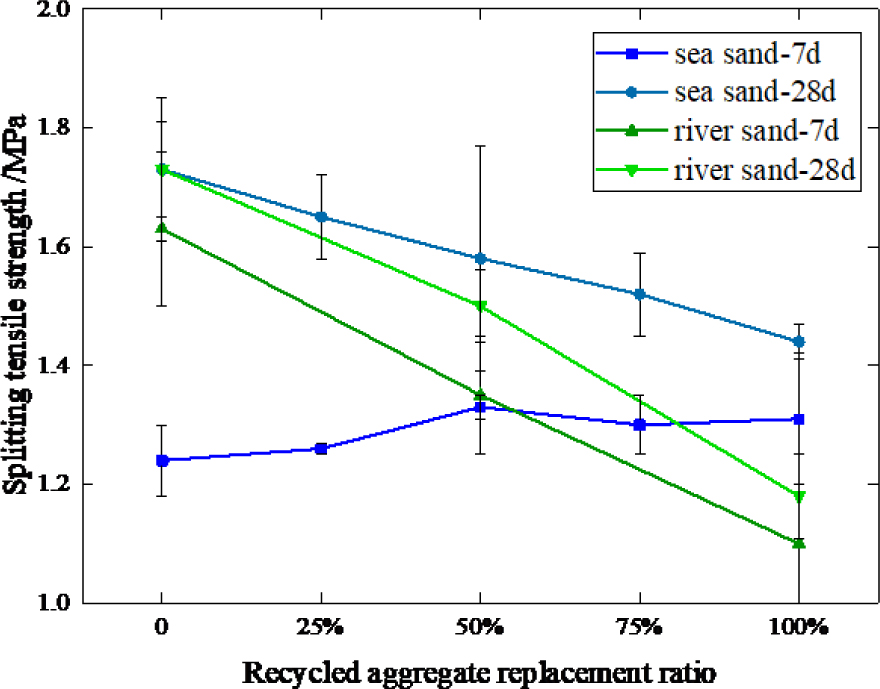
Fig. 19
Influence of RA replacement ratio and sand types on splitting tensile strength. RA, recycled aggregate
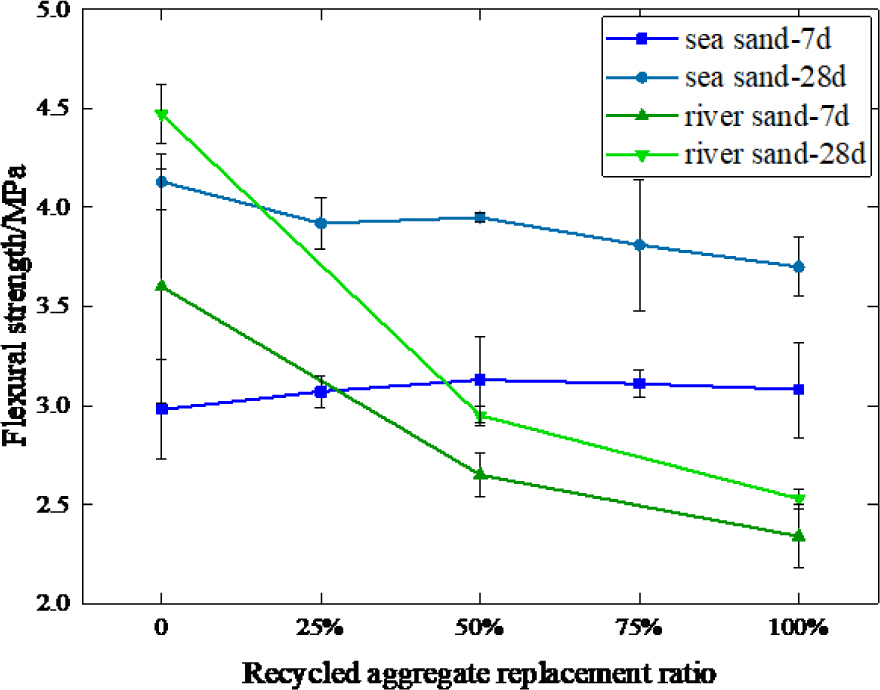
Fig. 20
Influence of RA replacement ratio and sand types on flexural strength. RA, recycled aggregate