
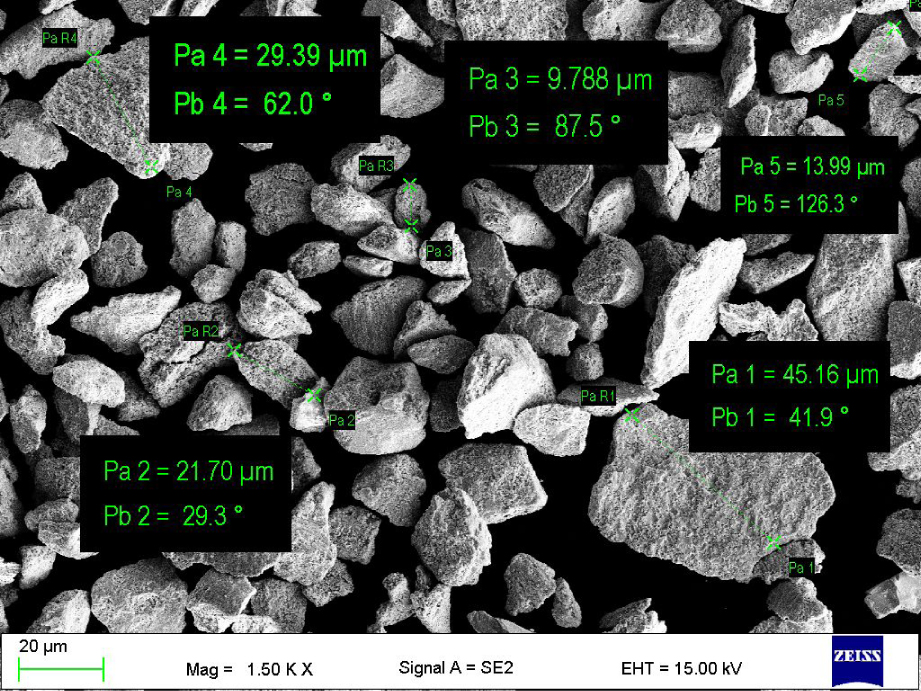
Fig. 1
Morphology of initial feedstock power (SEM-SE) with random measurements of particle size. SEM, scanning electron microscope
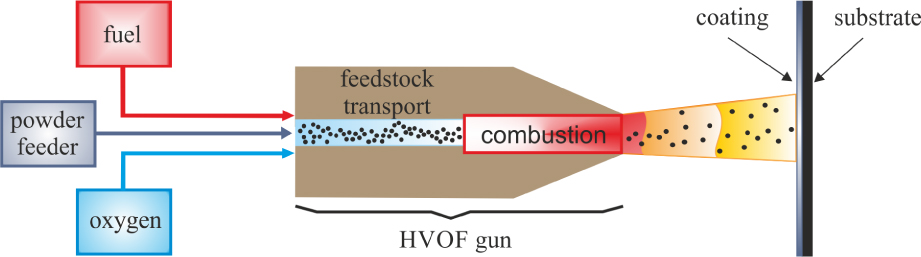
Fig. 2
Schematic representation of the HVOF method and its key process parameter, inspired by Pawłowski [3] and Jonda and Łatka [33]. HVOF, high-velocity oxy-fuel spraying
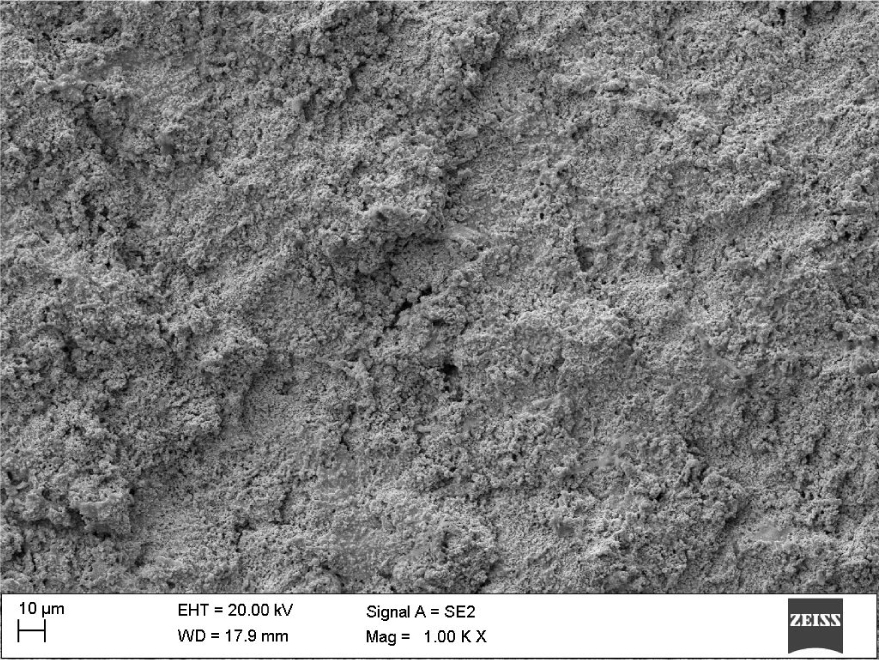
Fig. 3
The topography of the A1 sample surface
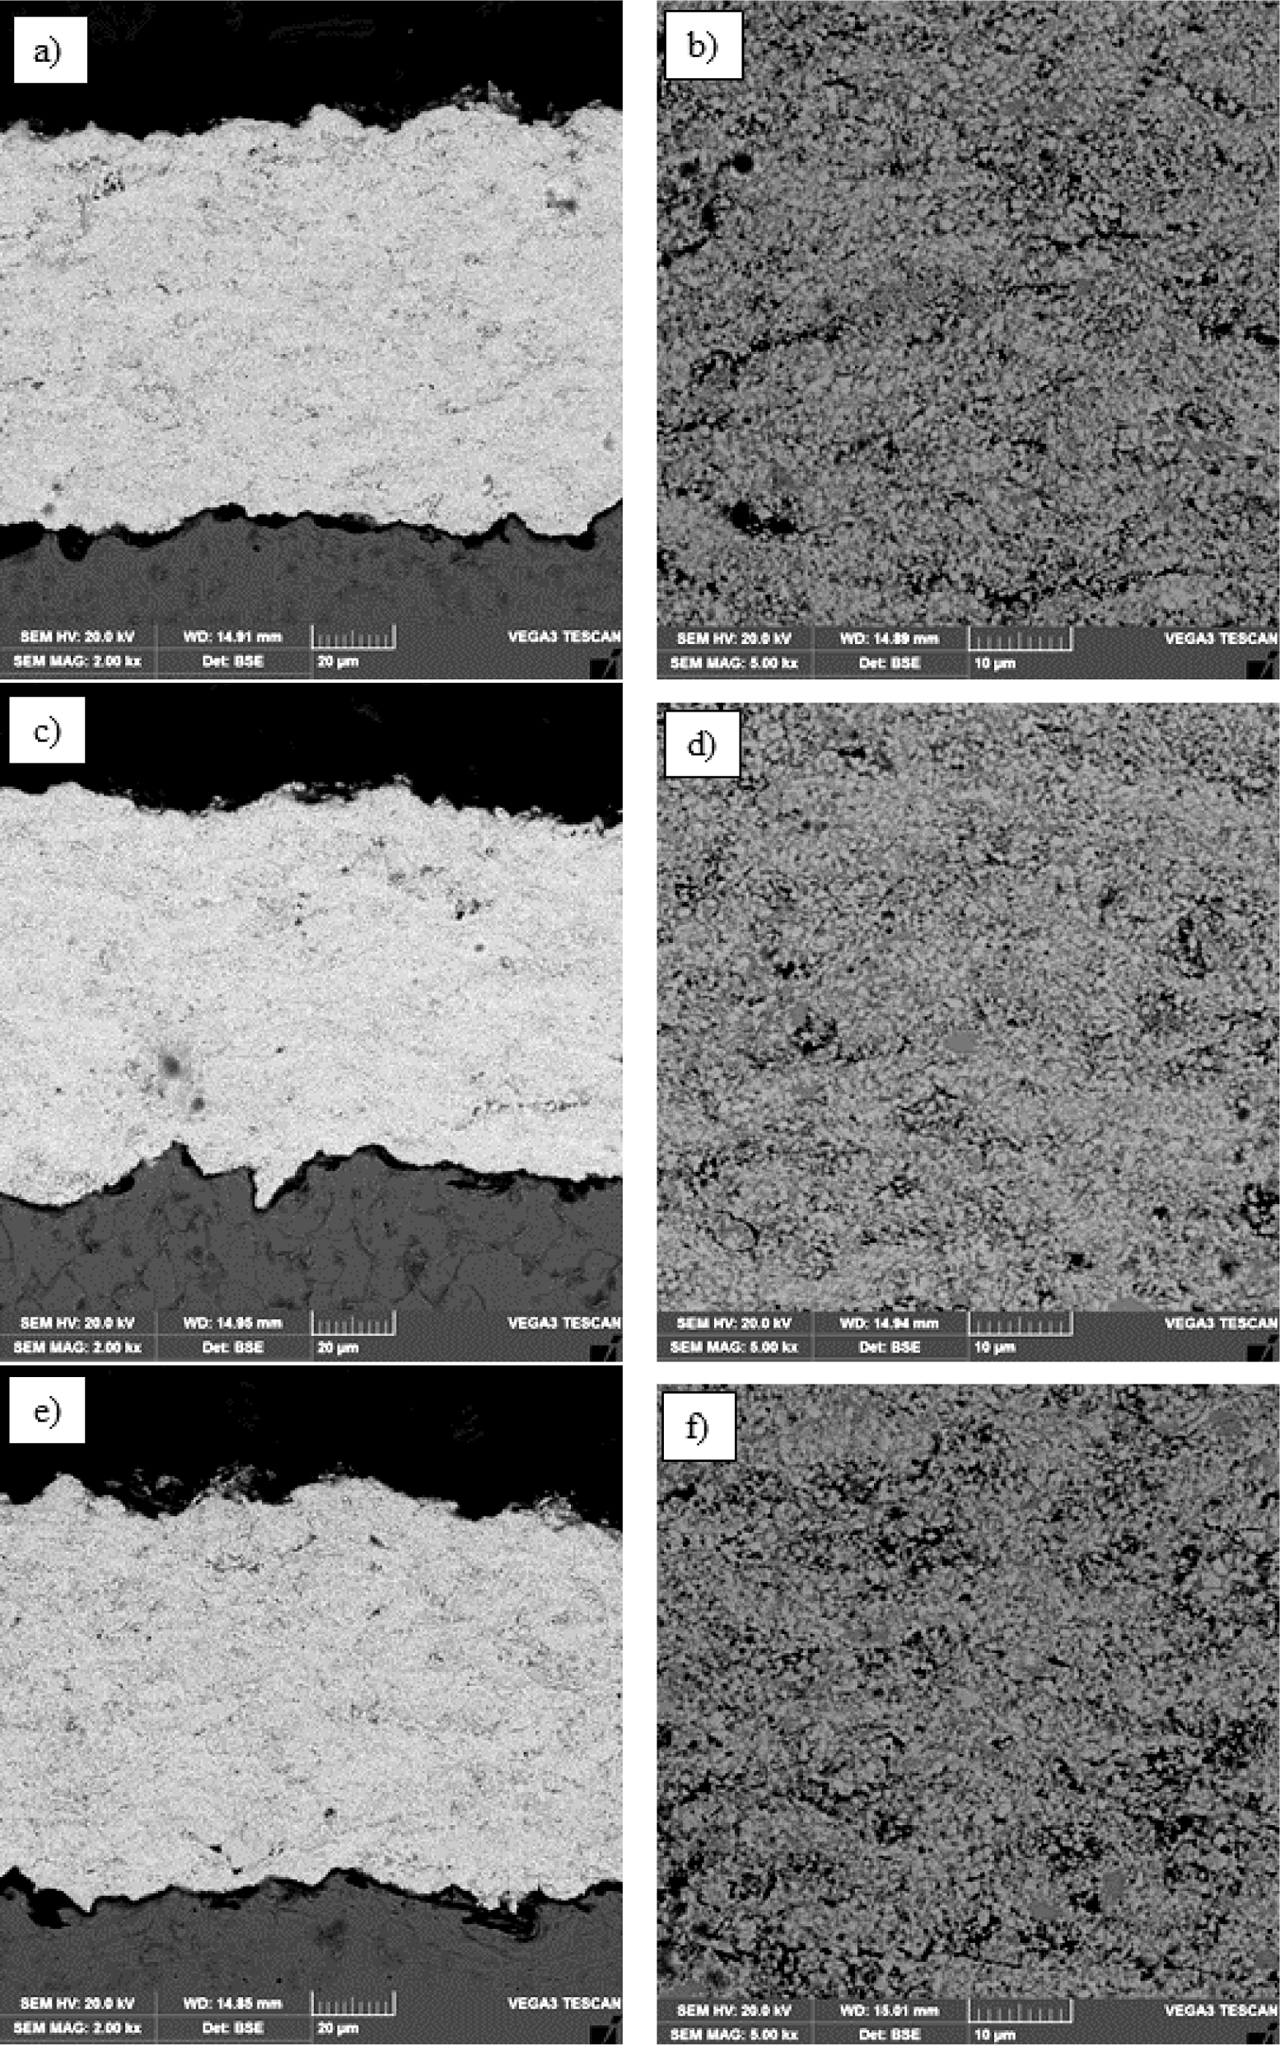
Fig. 4
SEM images of coatings’ cross sections: (A, B) sample A1; (C, D) sample A2; (E, F) sample A3; (A, C, E) – mag. 2,000×; (B, D, F) – mag. 5,000×. SEM, scanning electron microscope
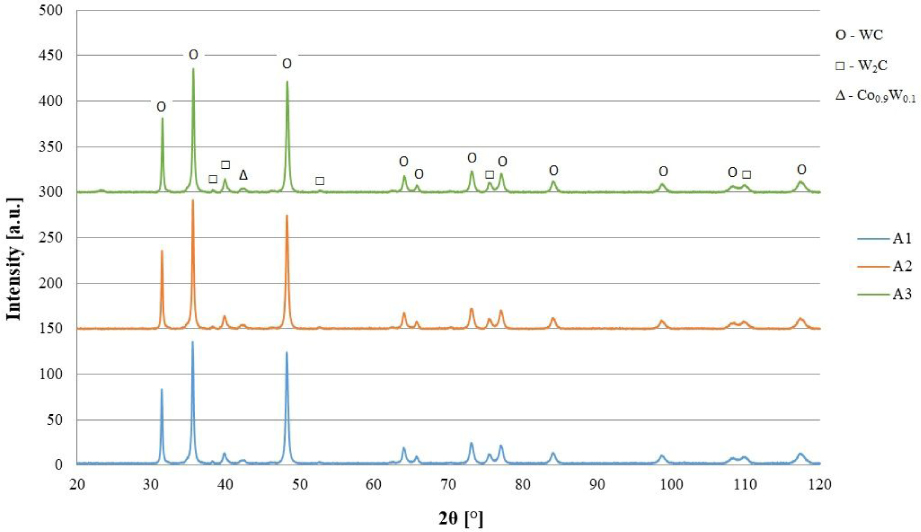
Fig. 5
XRD patterns of all WC-Co-Cr coatings manufactured by the HVOF method. XRD, X-ray diffraction; HVOF, high-velocity oxy-fuel spraying
Table 2
Values of elastic modulus and hardness from instrumental indentation test
| A1 | A2 | A3 | |
|---|---|---|---|
| HIT, GPa | 14.82 ± 1.25 | 14.67 ± 1.55 | 14.24 ± 1.35 |
| EIT, GPa | 339 | 342 | 336 |
Table 3
Mean values of bond strength and type of fracture
| A1 | A2 | A3 | |
|---|---|---|---|
| Bond strength, MPa | 65 ± 3 | 61 ± 4 | 55 ± 3 |
| Fracture type | A/C | A/C | A/C |
[i] A/C, adhesive-cohesive type of fracture
Table 4
Sliding wear results: wear factor and friction coefficient (CoF)
| A1 | A2 | A3 | |
|---|---|---|---|
| K, 10−9 mm3/(N · m) | 77 ± 11 | 73 ± 9 | 81 ± 14 |
| CoF, - | 0.41 ± 0.07 | 0.40 ± 0.09 | 0.40 ± 0.07 |
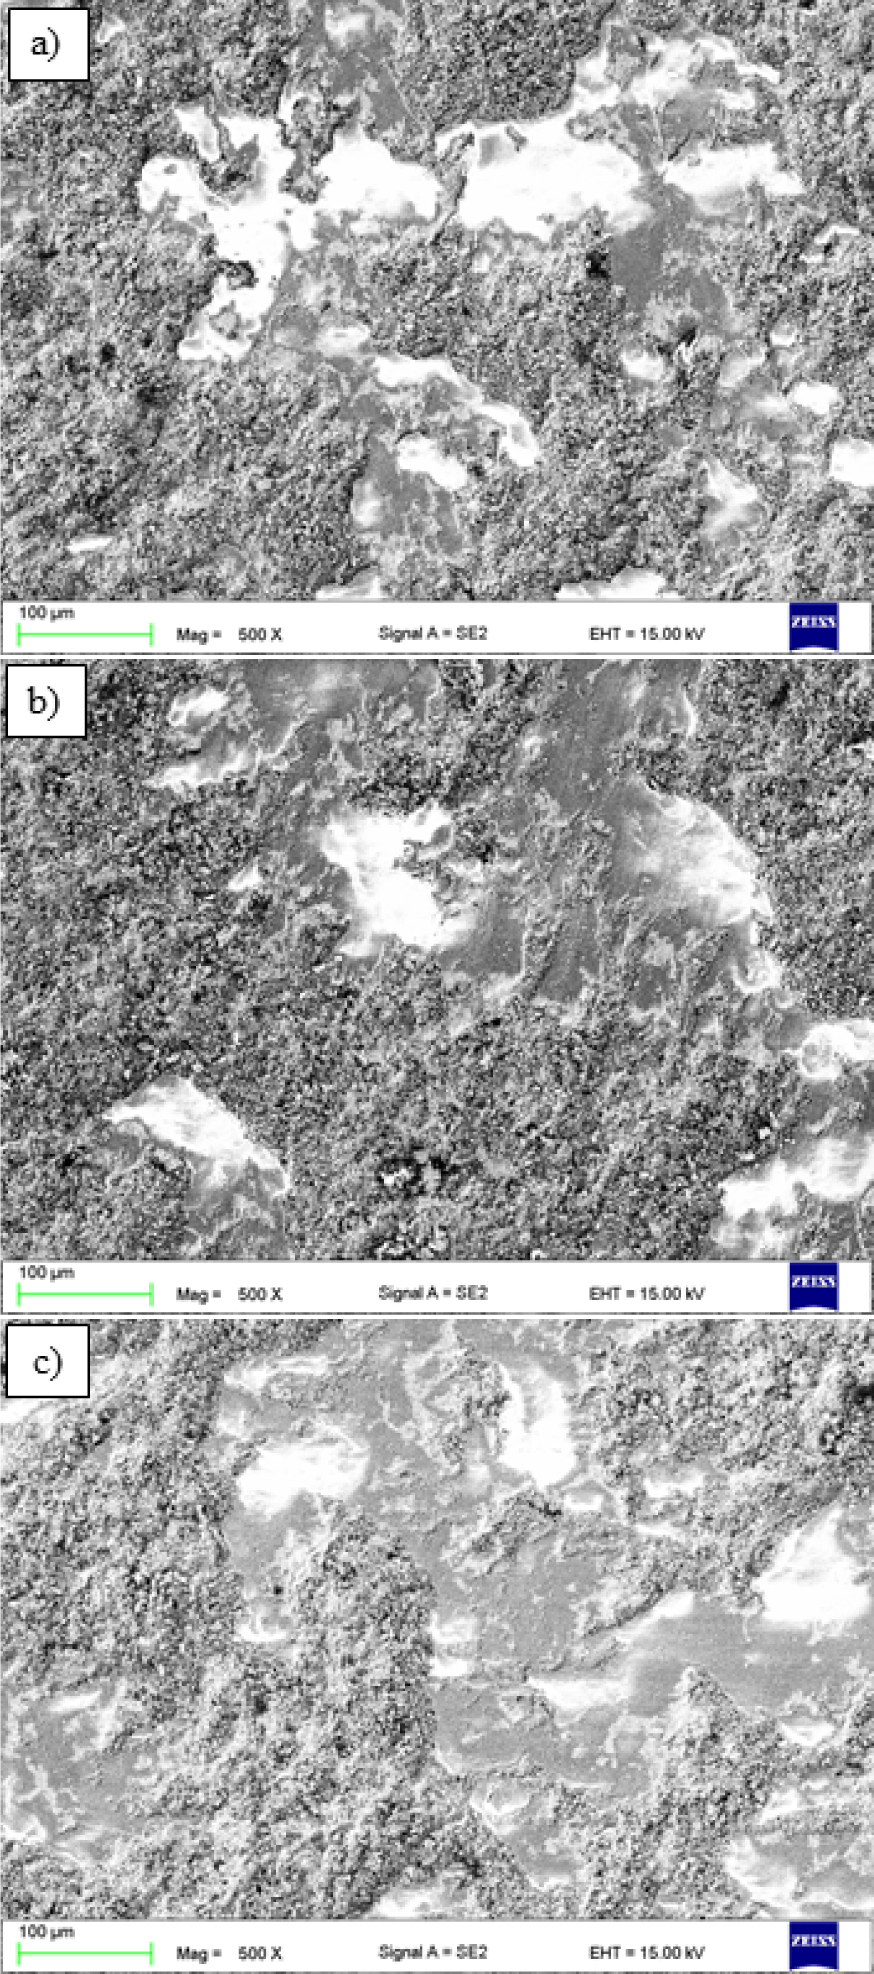
Fig. 6
SEM images showing the wear track of deposited coatings: (A) A1, (B) A2, (C) A3. SEM, scanning electron microscope