
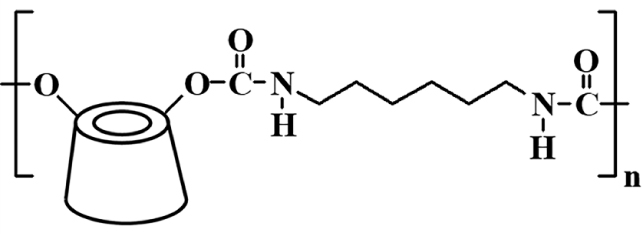
Fig. 1
Molecular structure of the PU polymer based on β-cyclodextrin forming the microcapsules shell. PU, Polyurethane
Table 1
Experimental range and levels of independent process variables
| Coded variable | Natural variable | Unit | Levels | ||
|---|---|---|---|---|---|
| −1 | 0 | +1 | |||
| X1 | U1: microcapsules concentration | (g ⋅ L−1) | 90 | 100 | 110 |
| X2 | U2: CA crosslinking agent concentration | (g ⋅ L−1) | 80 | 100 | 120 |
| X3 | U3: DHP CAT | (g ⋅ L−1) | 50 | 60 | 70 |
[i] CAT, catalyst concentration; CA, citric acid; DHP, disodium hydrogen phosphate
Table 2
Box-Behnken design and experimental results
| Experiment N° | Coded values | Real values | Mean response | ||||
|---|---|---|---|---|---|---|---|
| X1 | X2 | X3 | U1 | U2 | U3 | G (%) (n = 3) | |
| 1 | −1 | −1 | 0 | 90 | 80 | 60 | 2.25 |
| 2 | +1 | −1 | 0 | 110 | 80 | 60 | 3.68 |
| 3 | −1 | +1 | 0 | 90 | 120 | 60 | 2.75 |
| 4 | +1 | +1 | 0 | 110 | 120 | 60 | 4.11 |
| 5 | −1 | 0 | −1 | 90 | 100 | 50 | 3.85 |
| 6 | +1 | 0 | −1 | 110 | 100 | 50 | 4.72 |
| 7 | −1 | 0 | +1 | 90 | 100 | 70 | 1.88 |
| 8 | +1 | 0 | +1 | 110 | 100 | 70 | 2.11 |
| 9 | 0 | −1 | −1 | 100 | 80 | 50 | 3.45 |
| 10 | 0 | +1 | −1 | 100 | 120 | 50 | 5.22 |
| 11 | 0 | −1 | +1 | 100 | 80 | 70 | 1.50 |
| 12 | 0 | +1 | +1 | 100 | 120 | 70 | 1.47 |
| 13 | 0 | 0 | 0 | 100 | 100 | 60 | 4.23 |
| 14 | 0 | 0 | 0 | 100 | 100 | 60 | 4.26 |
| 15 | 0 | 0 | 0 | 100 | 100 | 60 | 4.28 |
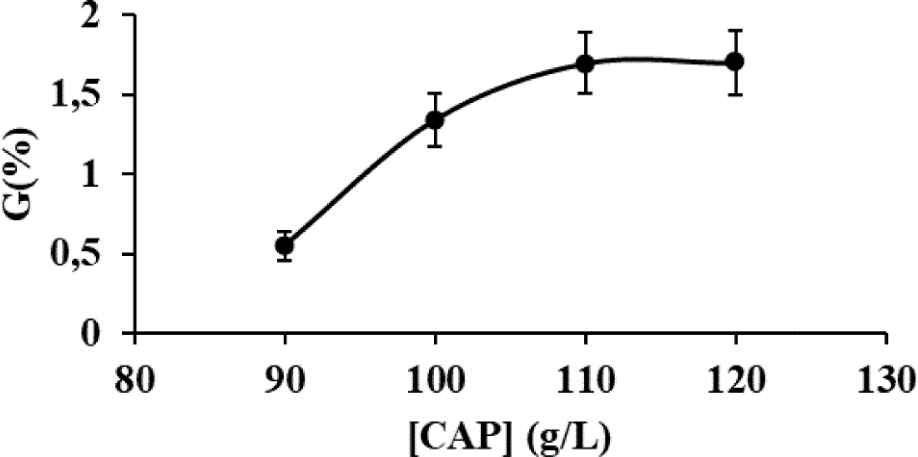
Fig. 2
Effect of the microcapsules concentration (CAP) on the mass gain G
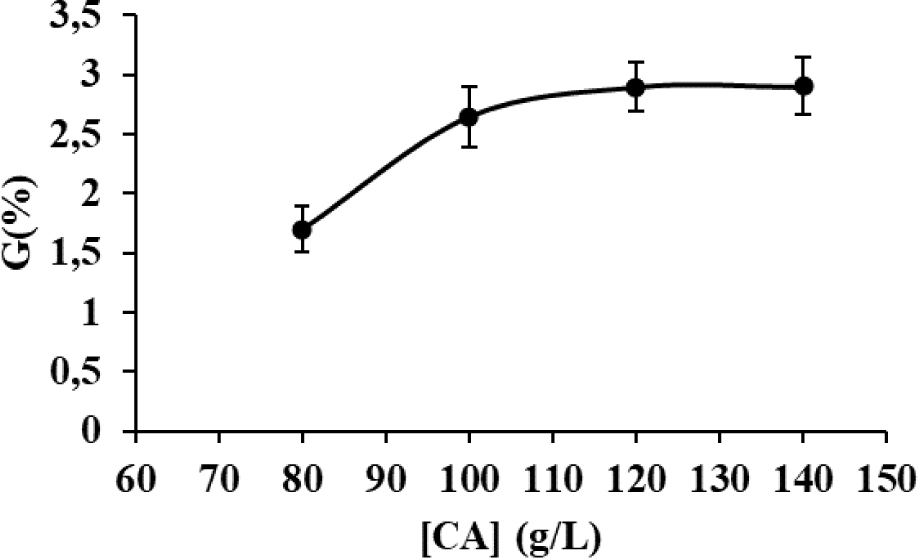
Fig. 3
Effect of the CA crosslinking agent concentration on the fabric mass gain. CA, citric acid
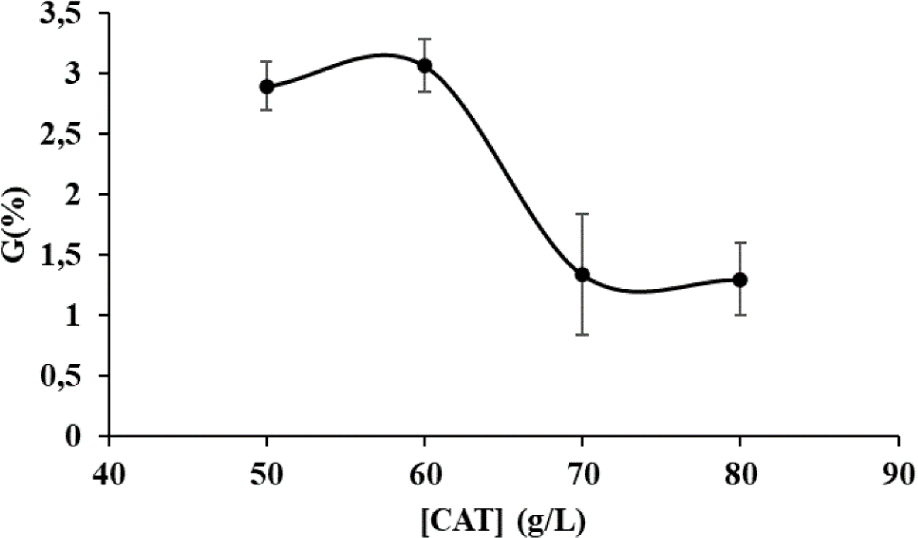
Fig. 4
Effect of the DHP CAT on the mass gain. CAT, catalyst concentration; DHP, disodium hydrogen phosphate
Table 3
ANOVA
| Source | Degrees of freedom | Sum of squares | Variance | F | p-value |
|---|---|---|---|---|---|
| Regression | 9 | 20.4000 | 2.2667 | 18.98 | 0.002 |
| Residuals | 5 | 0.5971 | 0.1194 | – | – |
| Total | 14 | 20.9971 | – | – | – |
[i] ANOVA, analysis of variance
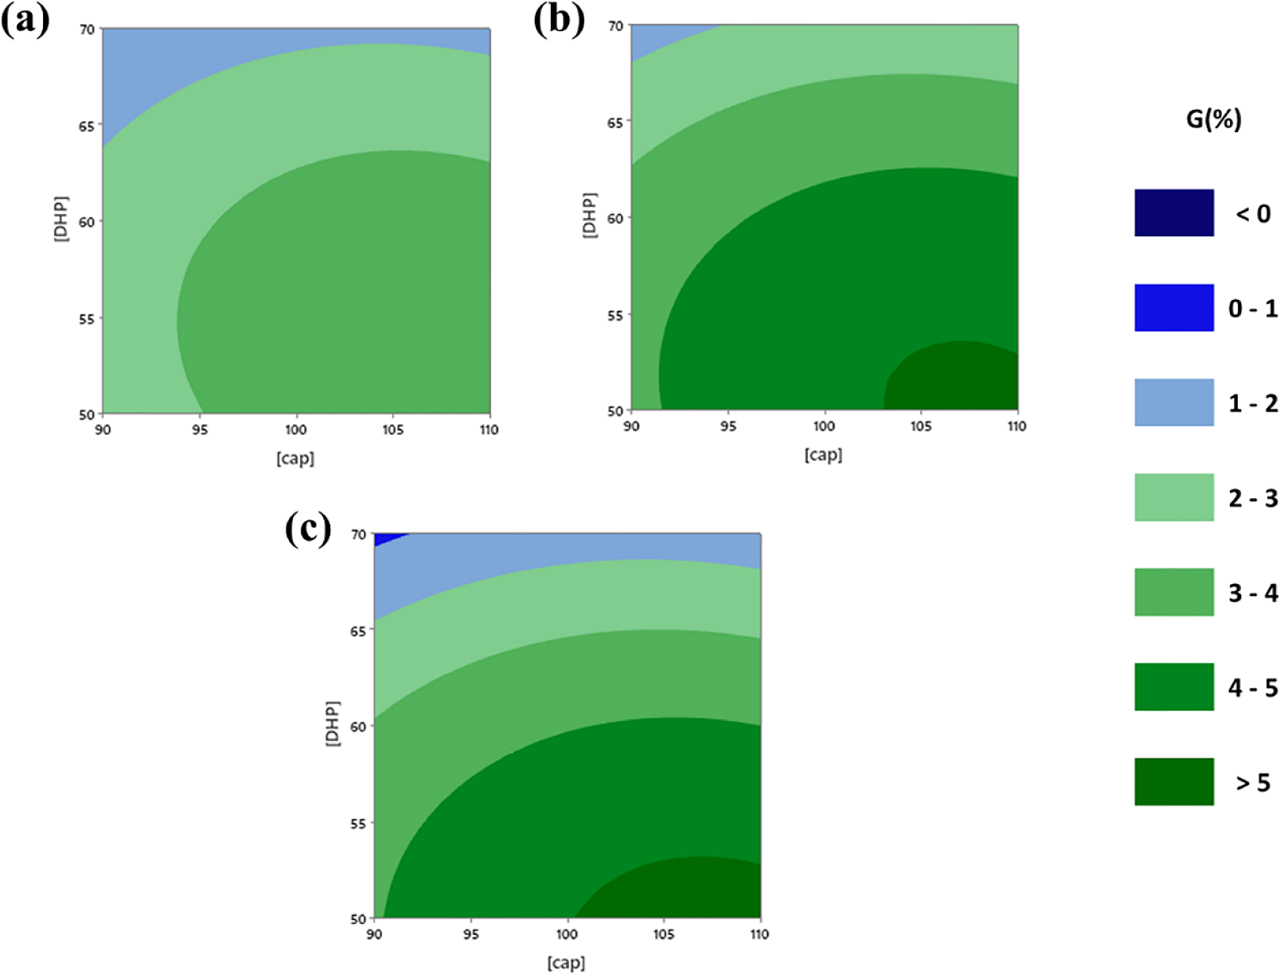
Fig. 5
Contour plots showing the combined effect of microcapsules and DHP CATs on the mass gain (G) using different CA crosslinking agent concentrations: (A) 80 g ⋅ L−1, (B) 100 g ⋅ L−1 and (C) 120 g ⋅ L−1. CAT, catalyst concentration; DHP, disodium hydrogen phosphate
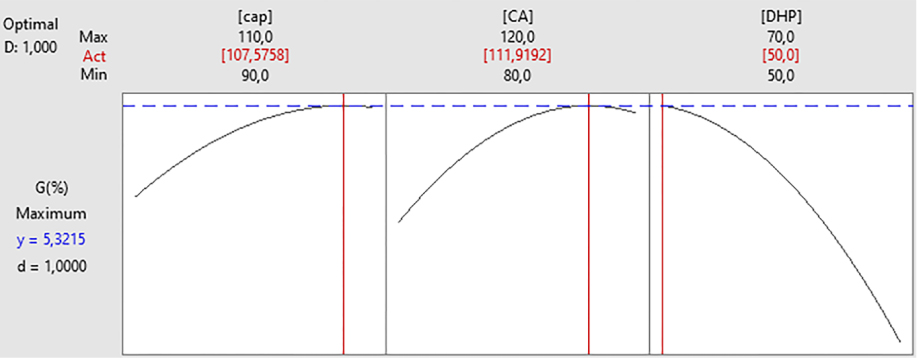
Fig. 6
Response optimisation of the grafting process. CA, citric acid; DHP, disodium hydrogen phosphate
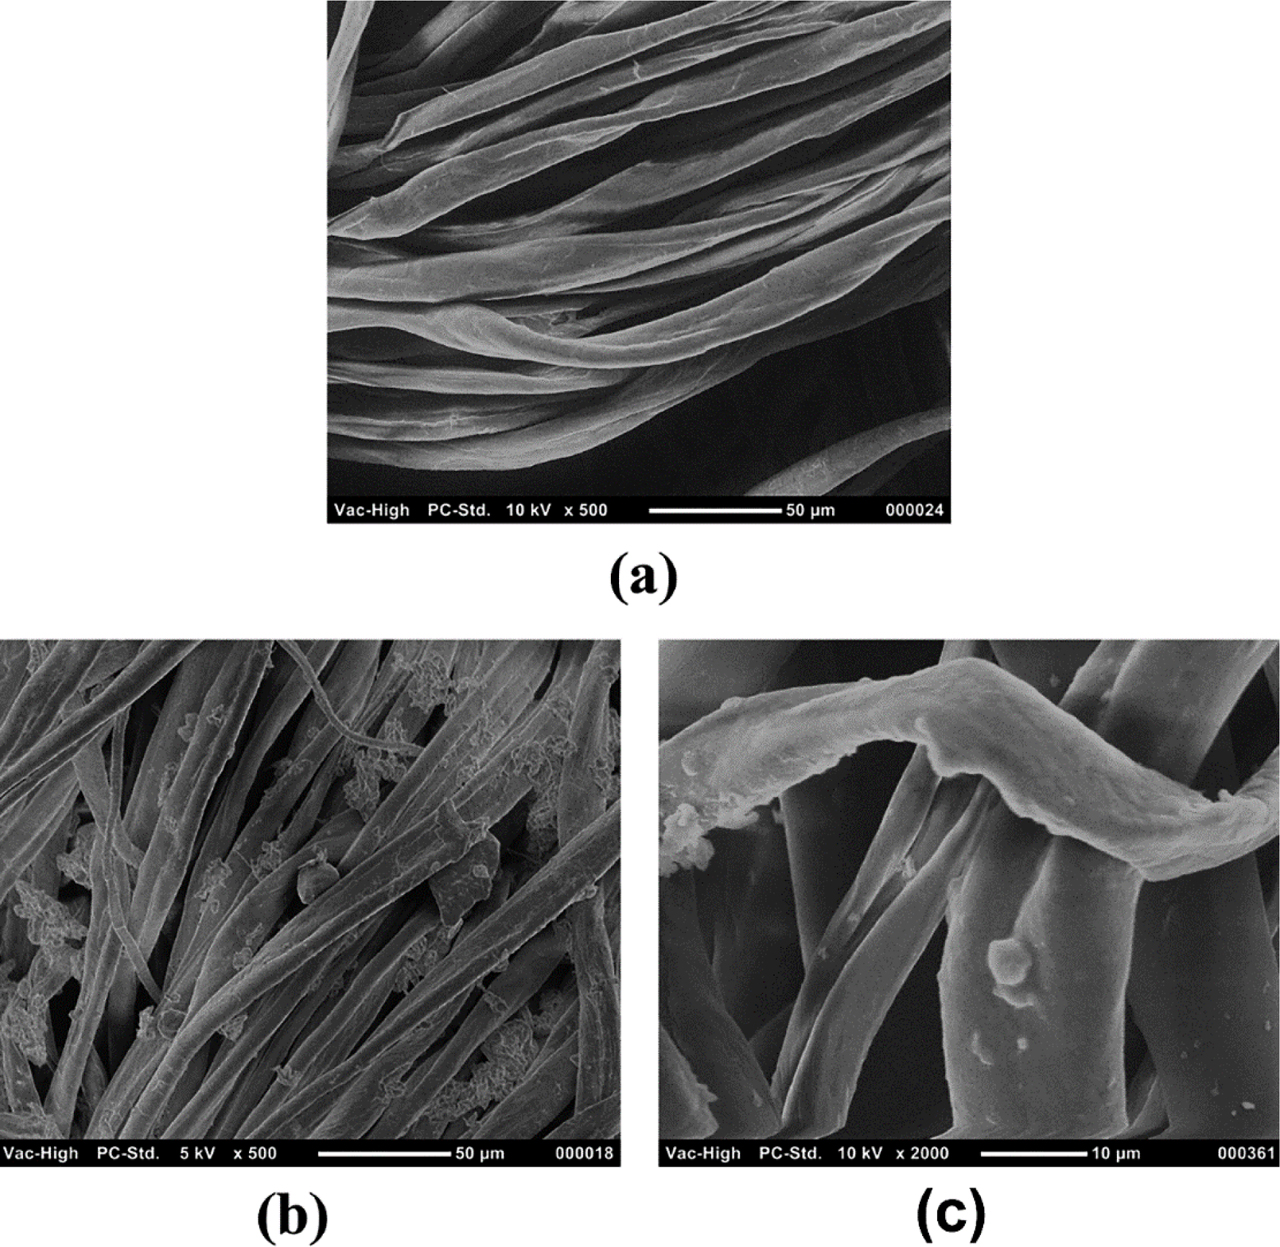
Fig. 7
SEM micrographs of: (A) untreated cotton knitted textile at ×500 magnification and (B, C) treated cotton knitted textile at ×500 (B) and ×2,000 (C) magnifications. SEM, scanning electron microscopy
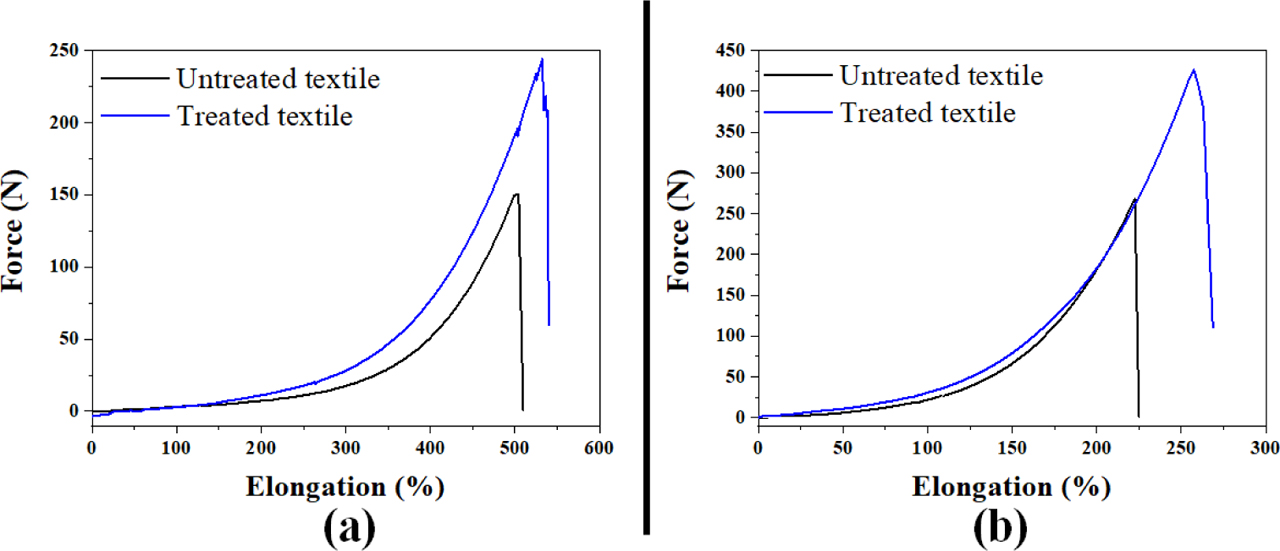
Fig. 8
Tensile behaviour of untreated and treated knitted fabric in both directions: (A) row direction and (B) column direction
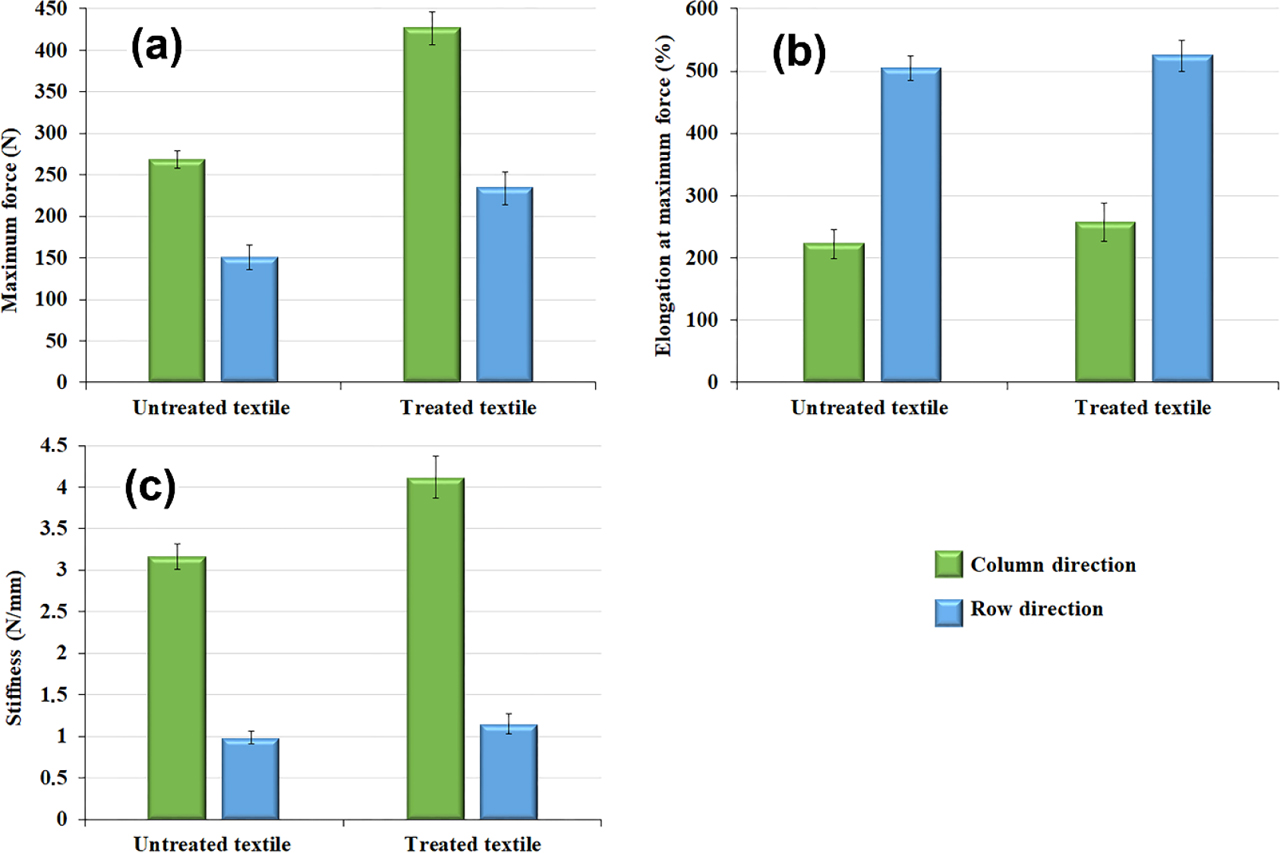
Fig. 9
Variation of: (A) maximum force, (B) elongation at maximum force and (C) stiffness before and after grafting treatment in row and column directions
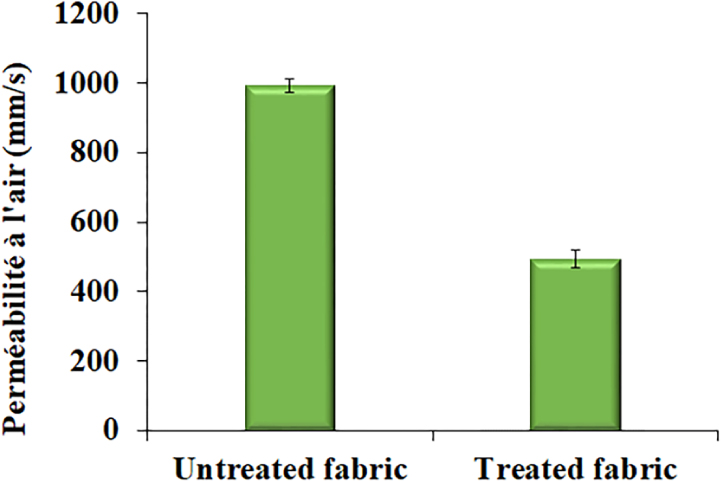
Fig. 10
Air permeability of knitted cotton fabrics before and after grafting
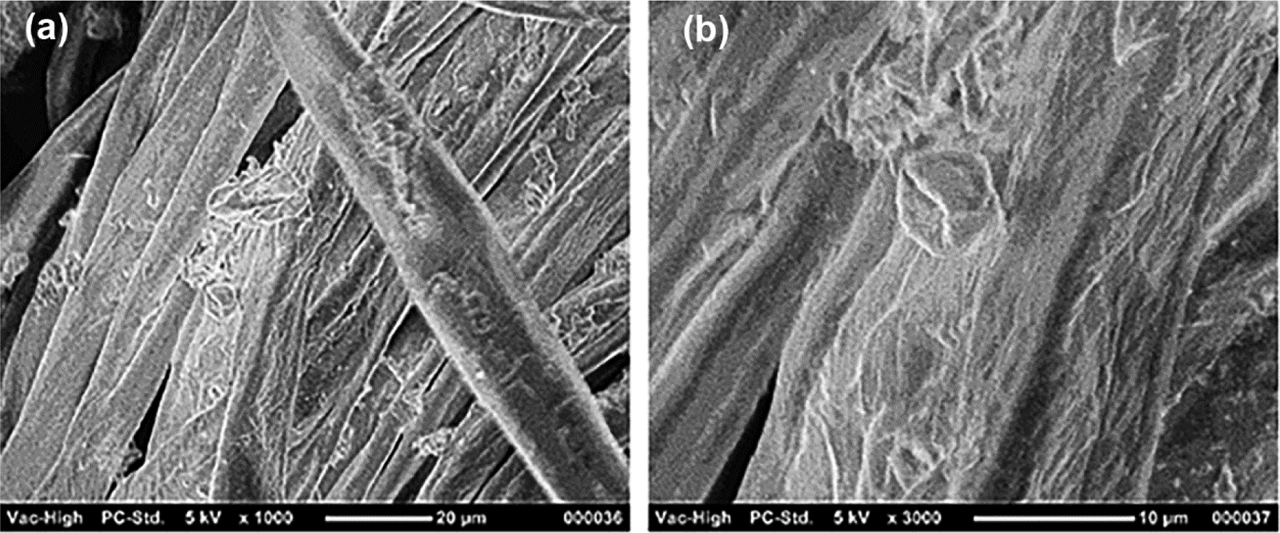
Fig. 11
SEM micrographs of knitting grafted with fragrant microcapsules after 40 washing cycles at (A) ×1,000 and (B) ×3,000 magnification. SEM, scanning electron microscopy
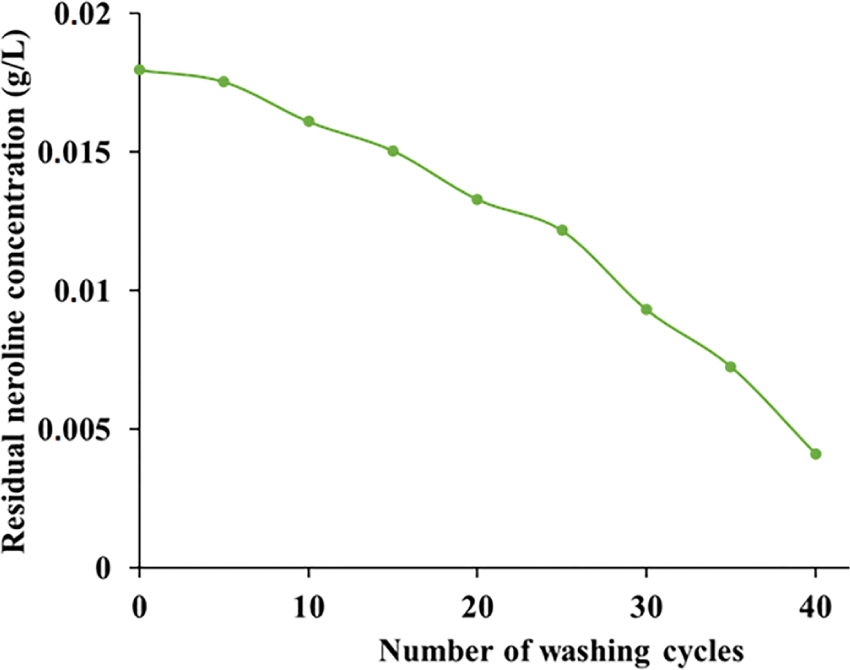
Fig. 12
Residual neroline concentration after subsequent washing cycles