
Fig. 1
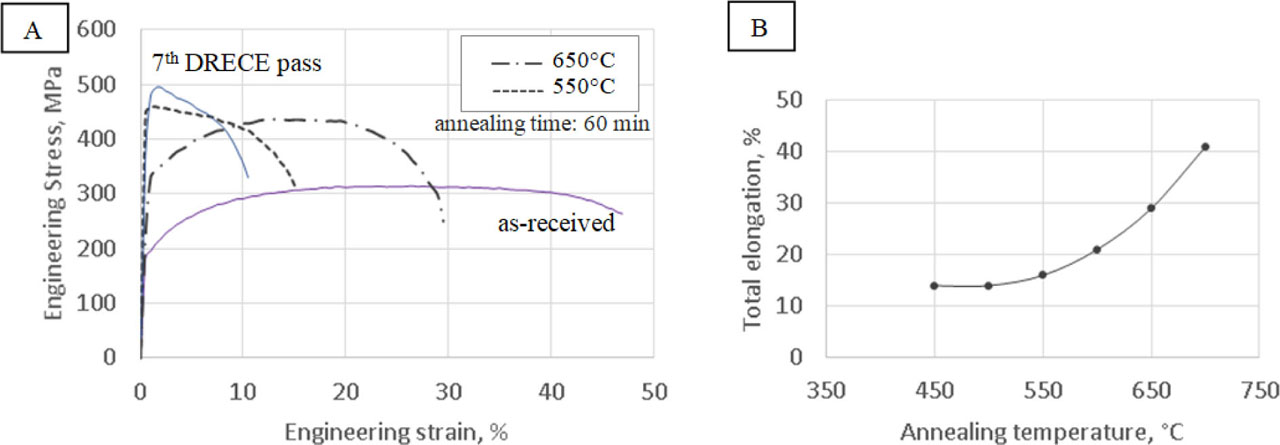
(A) Comparison of the stress–strain curves of the DRECE-processed low-carbon steel strips; (B) The curve depicting the change in total elongation against annealing temperature. DRECE, dual rolls equal channel extrusion
Table 1
Mechanical properties of steel strips after selected passes in the SPD and annealing processes; the results are presented as measurement ± expected error
| Condition | UTS, MPa | YS, MPa | TEL, % | UE, % |
|---|---|---|---|---|
| As received | 314 ± 6 | 180 ± 4 | 47 ± 4 | 20 ± 2.0 |
| After 1st DRECE pass | 393 ± 10 | 385 ± 8 | 14 ± 4 | 1.2 ± 0.1 |
| After 3rd DRECE pass | 415 ± 6 | 390 ± 8 | 12 ± 3 | 1.1 ± 0.1 |
| After 7th DRECE pass | 495 ± 3 | 487 ± 9 | 9 ± 5 | 1.1 ± 0.1 |
| After annealing at 450°C | 479 ± 5 | 462 ± 6 | 14 ± 2 | 2.0 ± 0.7 |
| After annealing at 500°C | 470 ± 3 | 459 ± 5 | 14 ± 4 | 2.4 ± 0.6 |
| After annealing at 550°C | 459 ± 4 | 448 ± 3 | 16 ± 4 | 2.8 ± 0.9 |
| After annealing at 600°C | 451 ± 4 | 428 ± 7 | 21 ± 3 | 5.1 ± 1.0 |
| After annealing at 650°C | 436 ± 2 | 415 ± 3 | 29 ± 2 | 7.5 ± 1.5 |
| After annealing at 700°C | 340 ± 6 | 188 ± 4 | 41 ± 2 | 15.7 ± 1.2 |
[i] DRECE, dual rolls equal channel extrusion; TEL, total elongation to failure; UTS, ultimate tensile strength; UE, uniform elongation; YS, yield strength.
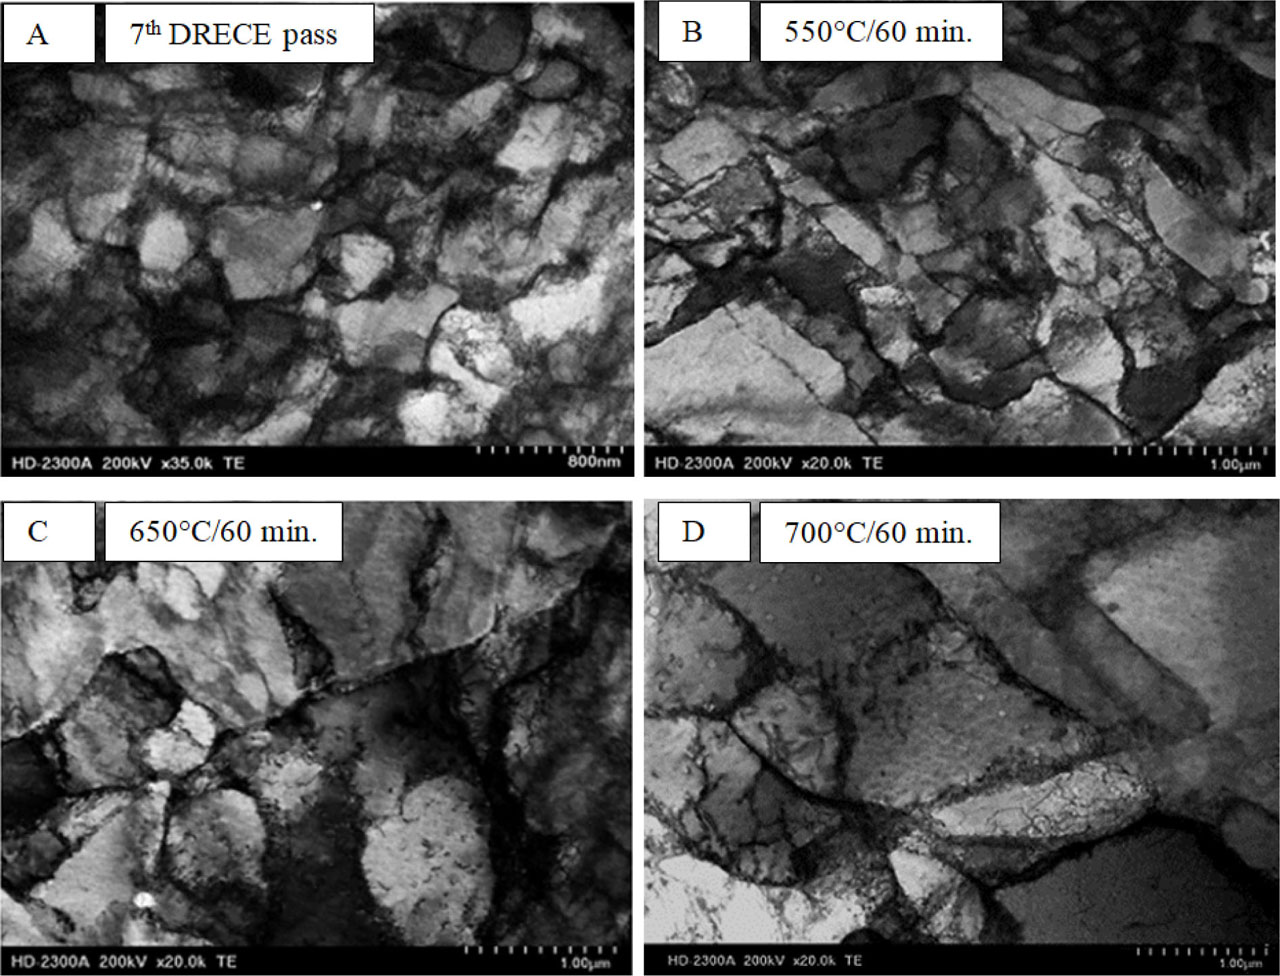
Fig. 2
STEM photographs of low-carbon steel annealed for 60 min in different temperature variants after seven DRECE passes; deformed sample (A), annealed at 550°C (B), 650°C (C), 650°C (D). DRECE, dual rolls equal channel extrusion; STEM, scanning transmission electron microscopy
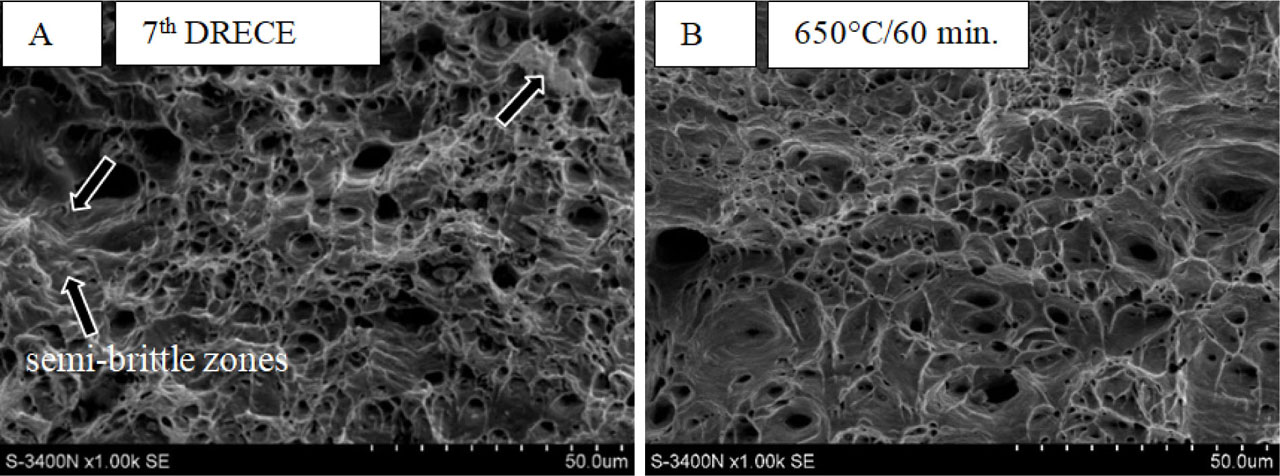
Fig. 3
Fracture surfaces of samples after static tensile test: (A) after seven DRECE passes (B) annealed at 650°C. DRECE, dual rolls equal channel extrusion