
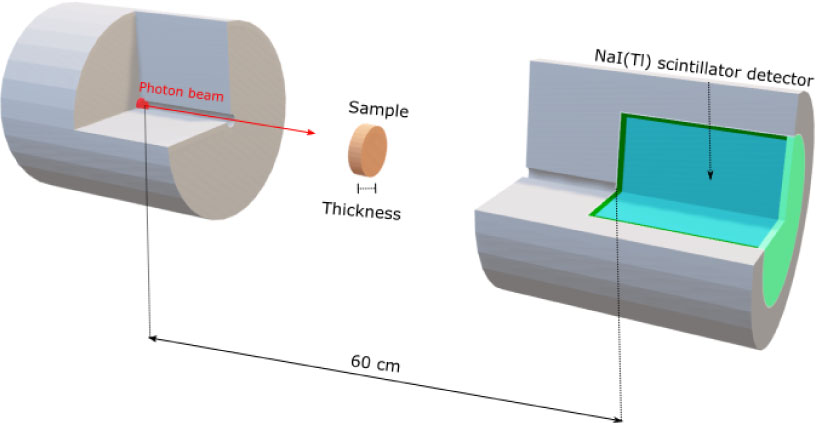
Fig. 1
The principal geometry for the present simulations by using Geant4.
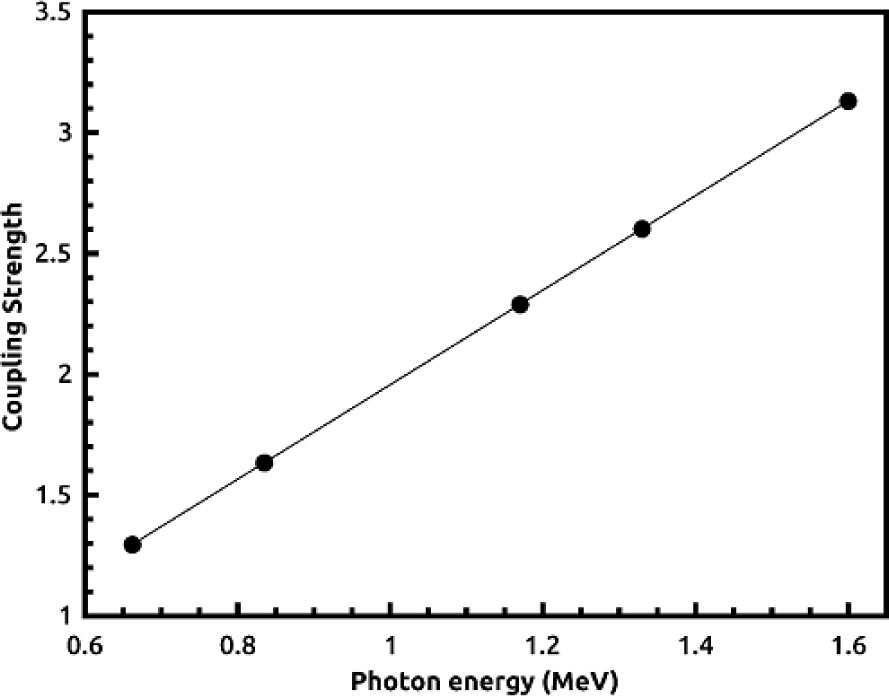
Fig. 2
Coupling strength as a function of photon energy.
Table 1
Studied elements along with their symbols, atomic numbers, atomic mass, and Z/A ratios.
| Element | Symbol | Z | A | Z/A |
|---|---|---|---|---|
| Zinc | Zn | 30 | 65.38 | 0.459 |
| Tellurium | Te | 52 | 127.60 | 0.408 |
| Barium | Ba | 56 | 137.33 | 0.408 |
| Bismuth | Bi | 83 | 208.98 | 0.397 |
[i] Z/A ratio, the ratio of the atomic number Z to the atomic weight A.
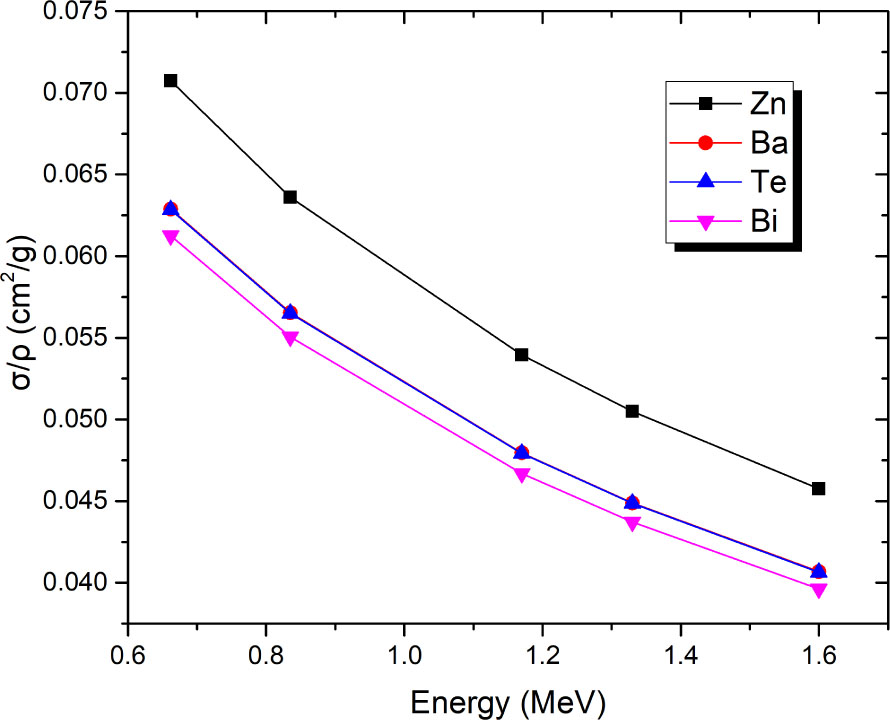
Fig. 3
K–N mass attenuation coefficients (σ/ρ) versus photon beam energy.
Table 2
Photon energy versus coupling constant (α), K–N electronic cross section (eσ), and electronic mass energy-transfer (eσtr) cross sections.
| Source | Energy (MeV) | Coupling Strength (α) | eσ (cm2/electron) | eσtr (cm2/electron) |
|---|---|---|---|---|
| Cs-137 | 0.662 | 1.2955 | 2.56E–25 | 9.78E–26 |
| Mn-54 | 0.835 | 1.6341 | 2.30E–25 | 9.55E–26 |
| Co-60 | 1.170 | 2.2896 | 1.95E–25 | 9.02E–26 |
| Co-60 | 1.330 | 2.6027 | 1.83E–25 | 8.76E–26 |
| La-140 | 1.600 | 3.1311 | 1.66E–25 | 8.34E–26 |
[i] K–N, Klein–Nishina.
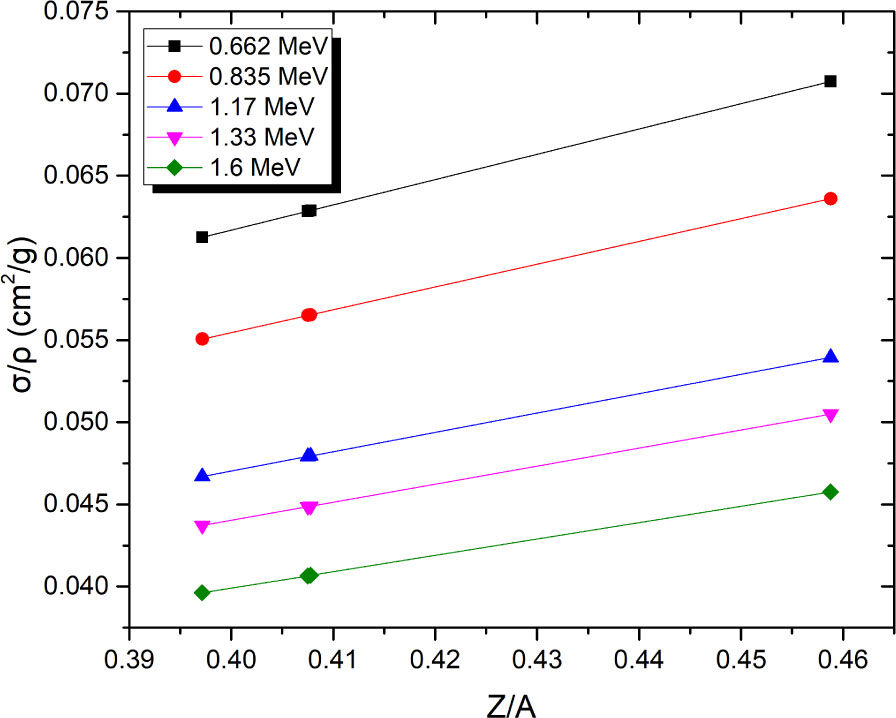
Fig. 4
Variation in the Compton mass attenuation coefficients (σ/ρ) as a function of the atomic number Z and the atomic weight A, i.e., the Z/A ratio.
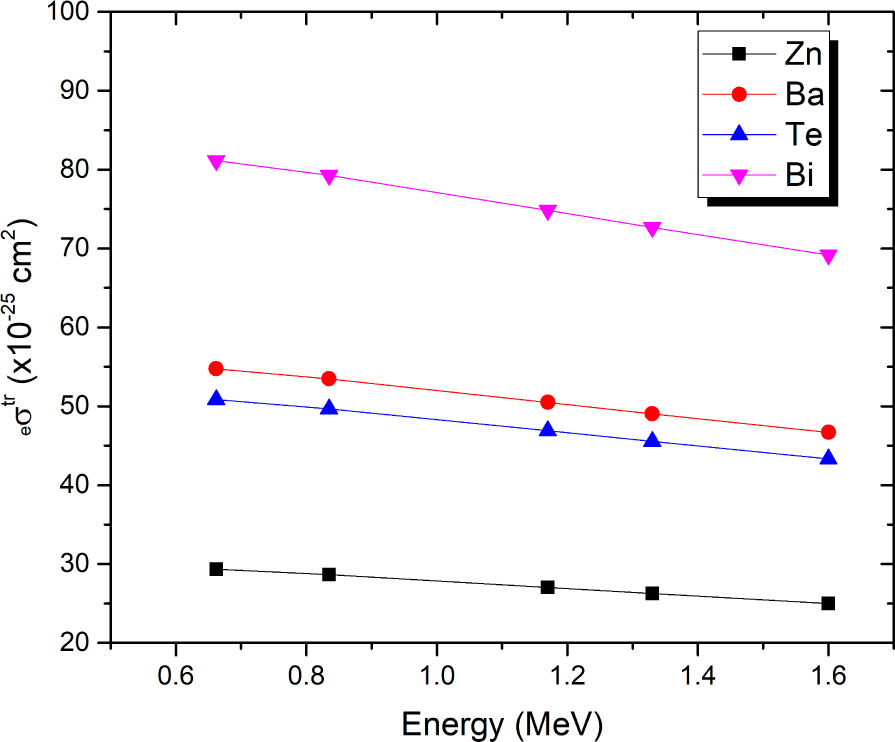
Fig. 5
K–N electron-transfer cross section (eσtr) as a function of the energy of interacting γ-rays. K–N, Klein–Nishina.
Table 3
Compton mass attenuation coefficients for Zn and Ba obtained by using Geant4 simulations and K–N scattering formula.
| Energy (MeV) | Zn | Ba | ||||
|---|---|---|---|---|---|---|
| K–N | Geant4 | Dev.% | K–N | Geant4 | Dev.% | |
| 6.62E–01 | 0.071 | 0.071 | 0.851 | 0.062 | 0.063 | 1.234 |
| 8.35E–01 | 0.063 | 0.064 | 0.944 | 0.056 | 0.057 | 1.231 |
| 1.17E+00 | 0.054 | 0.054 | 0.824 | 0.048 | 0.048 | 1.138 |
| 1.33E+00 | 0.051 | 0.051 | 0.697 | 0.045 | 0.045 | 0.946 |
| 1.60E+00 | 0.046 | 0.046 | 0.504 | 0.041 | 0.041 | 0.782 |
[i] Dev.%, percentage deviation; K–N, Klein–Nishina.
Table 4
Compton mass attenuation coefficients for Te and Bi elements obtained by using Geant4 simulations and K–N scattering formula.
| Energy (MeV) | Te | Bi | ||||
|---|---|---|---|---|---|---|
| K–N | Geant4 | Dev.% | K–N | Geant4 | Dev.% | |
| 6.62E–01 | 0.062 | 0.063 | 1.079 | 0.060 | 0.061 | 1.706 |
| 8.35E–01 | 0.056 | 0.057 | 1.204 | 0.055 | 0.055 | 1.714 |
| 1.17E+00 | 0.048 | 0.048 | 0.997 | 0.046 | 0.047 | 1.501 |
| 1.33E+00 | 0.045 | 0.045 | 0.951 | 0.044 | 0.044 | 1.339 |
| 1.60E+00 | 0.041 | 0.041 | 0.721 | 0.040 | 0.040 | 1.070 |
[i] Dev.%, percentage deviation; K–N, Klein–Nishina.
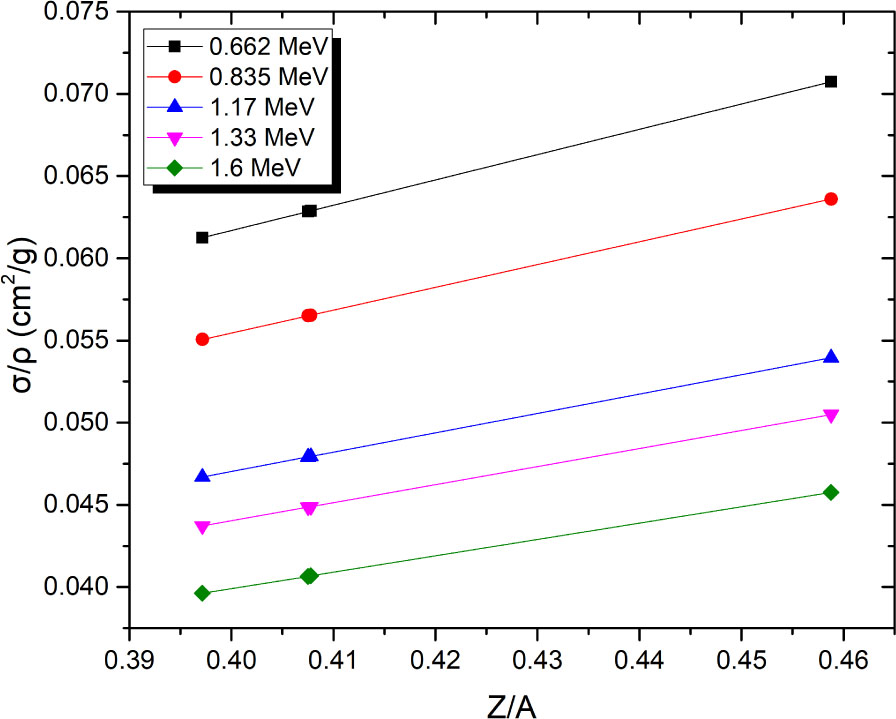
Fig. 6
Change in the K–N mass energy-transfer coefficients as a function of the Z/A ratio of the elements. K–N, Klein–Nishina; Z/A ratio, the ratio of the atomic number Z to the atomic weight A.