
Fig. 1
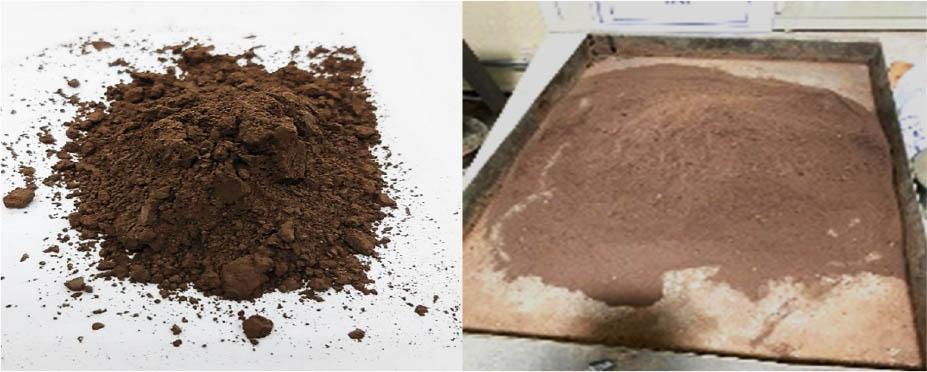
Fig. 2
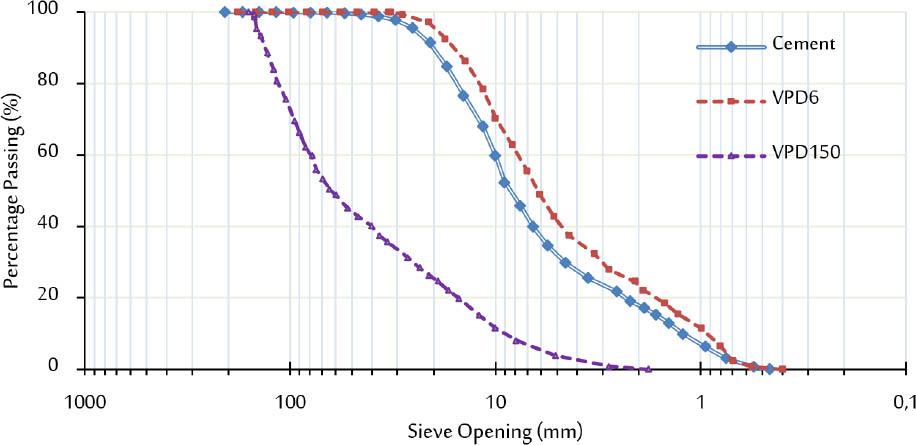
Fig. 3
Fig. 4
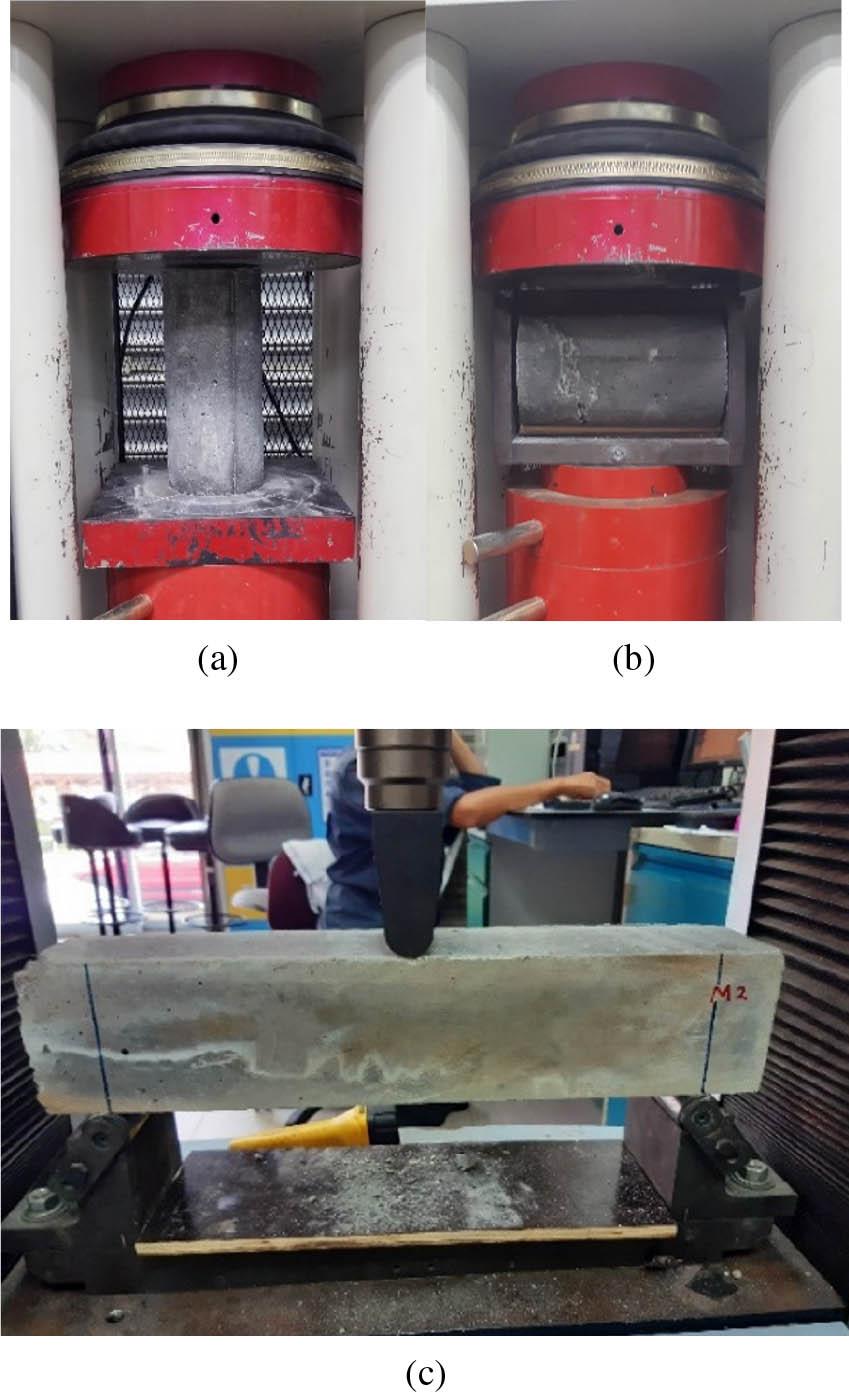
Fig. 5
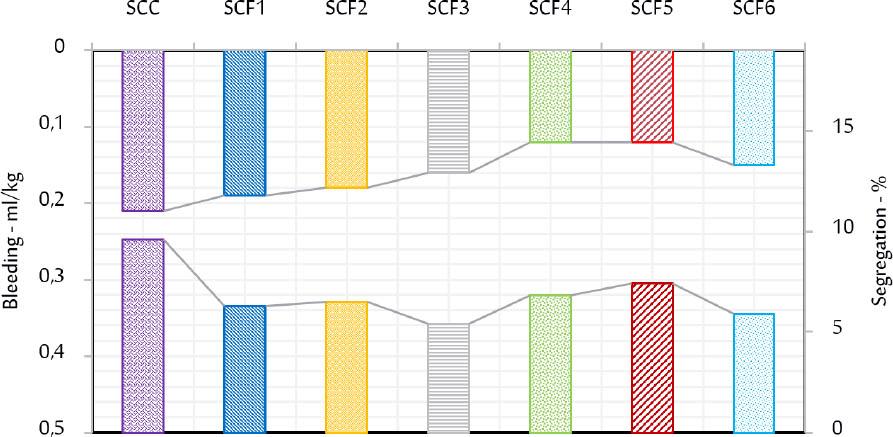
Fig. 6
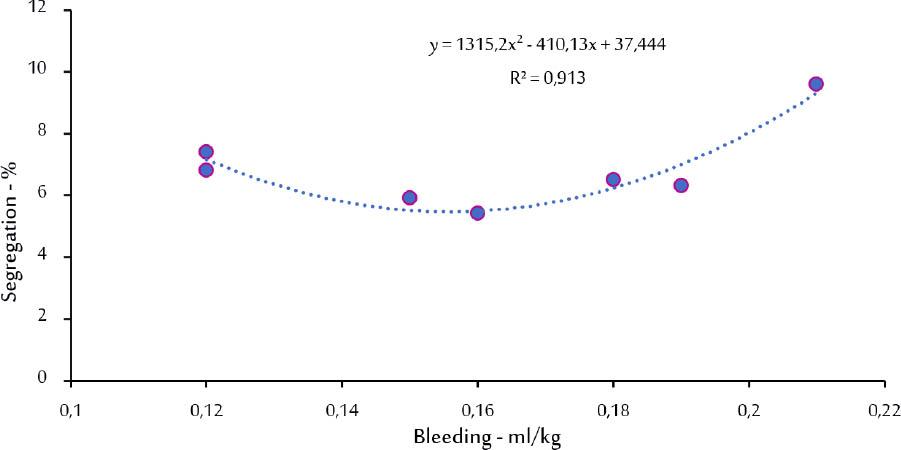
Fig. 7
Fig. 8
Fig. 9
Fig. 10
Fig. 11
Fig. 12
Fig. 13
Fig. 14
Fig. 15
Physical properties of VPP and cement_
| Property | VPP | Cement |
|---|---|---|
| Relative density | 2.61 | 3.10 |
| Surface area (cm2/g) Blaine method | 3.970 | 3.530 |
| Median diameter (μm) | 6.3 | 9.2 |
Chemical composition of VPP and cement_
| Oxide | VPP % | Cement % |
|---|---|---|
| SiO2 | 46.5 | 20.05 |
| Al2O3 | 17.59 | 4.93 |
| Fe2O3 | 7.33 | 3.90 |
| CaO | 12.52 | 61.57 |
| MgO | 6.94 | 0.81 |
| Na2O | 2.58 | 0.08 |
| TiO2 | 1.41 | 0.24 |
| K2O | 1.17 | 1.33 |
| P2O5 | 0.71 | 0.08 |
| SO3 | 0.42 | 3.06 |
| MnO | 0.14 | 0.19 |
| Cl | 0.01 | – |
| LOI | 1.61 | 2.10 |
| SiO2 + Al2O3 + Fe2O3 | 76.01 | – |
The SCC mixtures fresh state characteristics_
| Mixture | L-box | Slump flow | Segregation | Bleeding | Density |
|---|---|---|---|---|---|
| Ratio | (mm) | % | (ml/cm2) | (kg/m3) | |
| SCC | 0.92 | 690 | 9.6 | 0.21 | 2,336 |
| SCF1 | Restricted | 450 | 6.3 | 0.19 | 2,269 |
| SCF2 | Restricted | 480 | 6.5 | 0.18 | 2,321 |
| SCF3 | Restricted | 520 | 5.4 | 0.16 | 2,315 |
| SCF4 | Restricted | 490 | 6.8 | 0.12 | 2,276 |
| SCF5 | Restricted | 480 | 7.4 | 0.12 | 2,304 |
| SCF6 | Restricted | 510 | 5.9 | 0.15 | 2,219 |
The absorption and porosity of SCC mixtures_
| SCC | SCF1 | SCF2 | SCF3 | SCF4 | SCF5 | SCF6 | |
|---|---|---|---|---|---|---|---|
| Porosity % | 15 | 16.10 | 16.02 | 16.90 | 16.30 | 16.74 | 18.12 |
| Absorption % | 7.33 | 7.64 | 7.42 | 7.88 | 7.71 | 7.84 | 9.03 |
Copolymer-based SP properties_
| Properties | Information |
|---|---|
| Chemical base | Modified polycarboxylate in water |
| Color | Liquid/turbid to light yellowish |
| Density | 1.070 (20°C) |
| Chloride ion content | <0.1% w/w |
| Alkaligehalte | <0.5% w/w |
Physical properties of VPD and cement_
| SF | |||||
|---|---|---|---|---|---|
| Item |
| ||||
| Hooked end SF1 | Flat end SF2 | Hooked end SF3 | Micro SF4 | Micro SF5 | |
| Specific gravity | 7.85 | 7.85 | 7.85 | 7.85 | 7.85 |
| Length (mm) | 60 | 50 | 30 | 21 | 13 |
| Diameter (deq) (mm) | 0.92 | 0.9 | 0.55 | 0.35 | 0.2 |
| Aspect ratio | 65 | 56 | 55 | 60 | 65 |
| Young’s modulus (Es) (GPa) | 210 | 210 | 210 | 200 | 200 |
| Tensile strength (ft) (MPa) | 1,160 | 1,160 | 1,160 | 1,100–1,300 | 1,100–1,300 |
Properties of concrete mixture_
| Mixture | Cement | VPP | Gravel | Sand | SF1 | SF2 | SF3 | SF4 | SF5 | Water | SP |
|---|---|---|---|---|---|---|---|---|---|---|---|
| (kg/m3) | |||||||||||
| SCC | 350 | 150 | 801 | 822 | – | – | – | – | – | 220 | 6.5 |
| SCF1 | 350 | 150 | 801 | 795 | 78.4 | – | – | – | – | 220 | 6.5 |
| SCF2 | 350 | 150 | 801 | 795 | – | 78.4 | – | – | – | 220 | 6.5 |
| SCF3 | 350 | 150 | 801 | 795 | – | – | 78.4 | – | – | 220 | 6.5 |
| SCF4 | 350 | 150 | 801 | 795 | – | – | – | 78.4 | – | 220 | 6.5 |
| SCF5 | 350 | 150 | 801 | 795 | – | – | – | – | 78.4 | 220 | 6.5 |
| SCF6 | 350 | 150 | 801 | 795 | 15.6 | 15.6 | 15.6 | 15.6 | 15.6 | 220 | 6.5 |