
Fig. 1
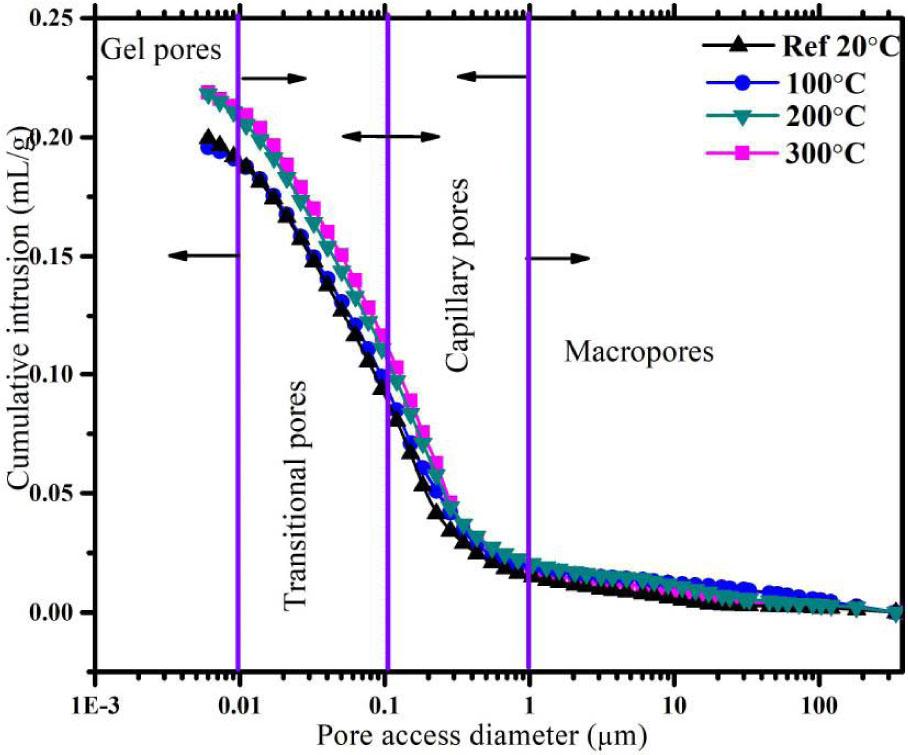
Fig. 2
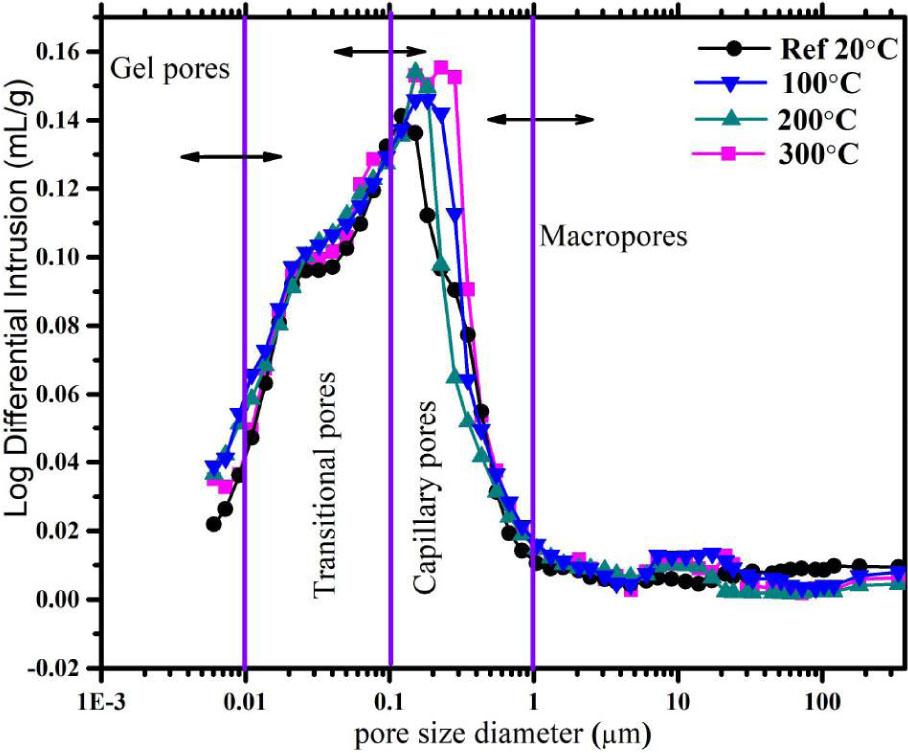
Fig. 3
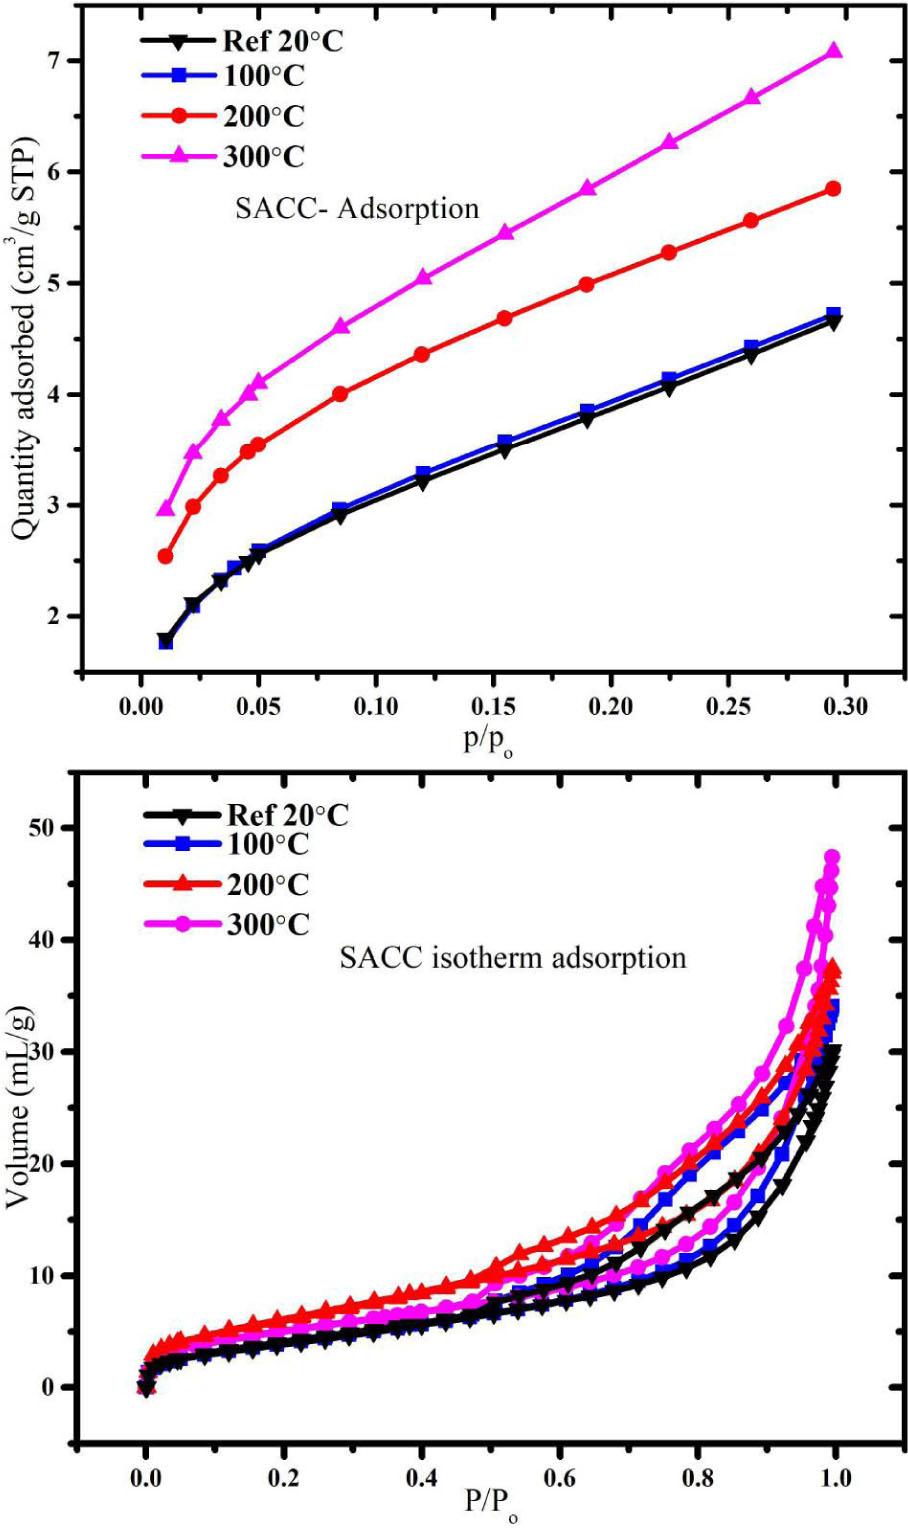
Fig. 4
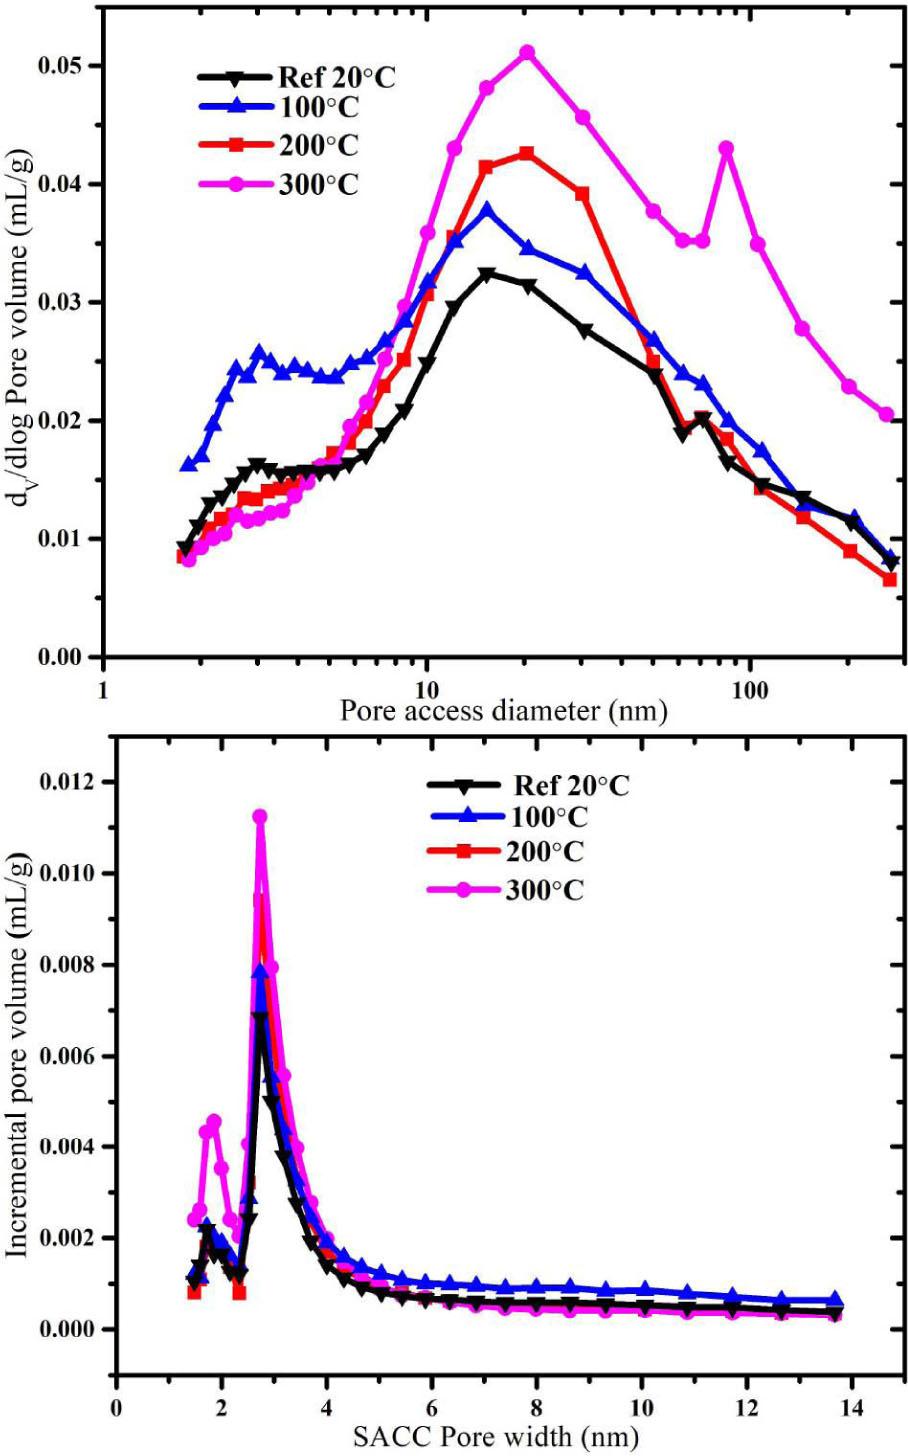
Fig. 5
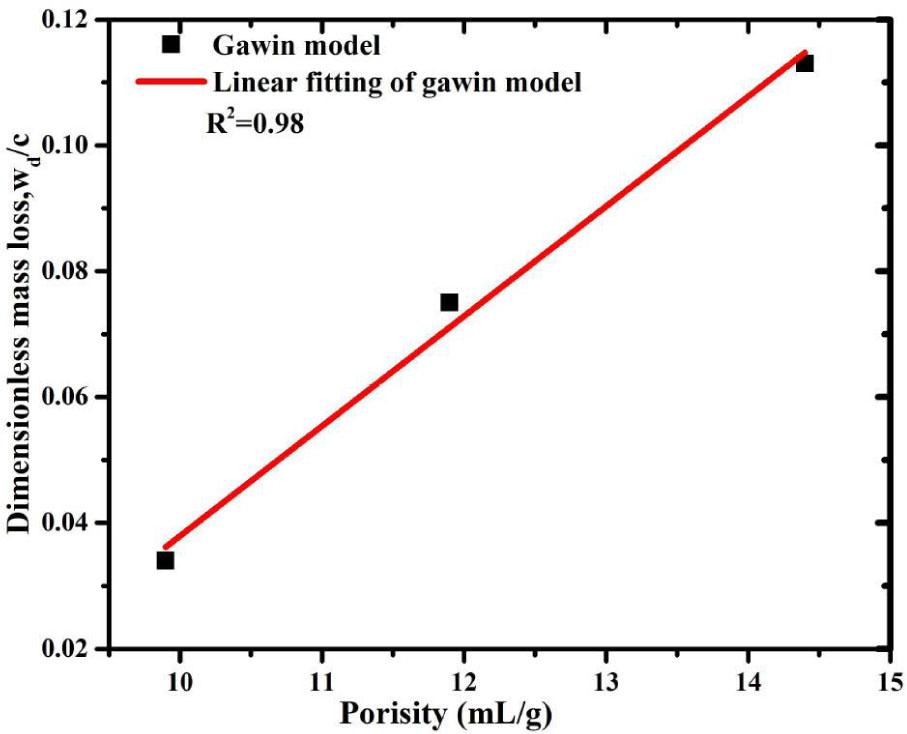
Fig. 6
Pore size distribution parameters of specimens (N2 adsorption)_
| Temperature (°C) | Average Micropore porosity (ml/g) | Average threshold diameter (nm) | Most probable pore size (nm) | Average peak value (ml/g) |
|---|---|---|---|---|
| 20 | 0.066 | 9.92 | 5.20 | 0.051 |
| 100 | 0.055 | 11.96 | 5.50 | 0.042 |
| 200 | 0.050 | 13.57 | 5.50 | 0.037 |
| 300 | 0.043 | 14.49 | 5.20 | 0.032 |
Pore size distribution parameters of specimens (MIP)_
| Temperature (°C) | Average porosity (ml/g) | PHg | Threshold diameter (nm) | Most probable aperture (nm) | |
|---|---|---|---|---|---|
| Capillary pores (10 – 200 nm) | Air voids (> 200 nm) | ||||
| 20 (ref.) | 2.89 | 0.20 | 2.98 | 100 | 27.26 |
| 100 | 3.30 | 0.60 | 4.76 | 130 | 59.03 |
| 200 | 4.38 | 0.90 | 5.53 | 7500 | 98.91 |
| 300 | 4.98 | 1.89 | 7.71 | 20000 | 118.40 |
Chemical proportions of cement in concrete
| Oxides | |||||||||||
|---|---|---|---|---|---|---|---|---|---|---|---|
| CaO | Al2O3 | SO3 | SiO2 | Fe2O3 | MgO | TiO2 | K2O | SrO | Na2O | Cl | P2O5 |
| 519.4 | 86.2 | 86.2 | 40.5 | 80.0 | 13.1 | 5.1 | 6.8 | 59.9 | 0.5 | 1.3 | 0.5 |
| 45.28% | 17.51% | 15.76% | 9.19% | 2.50% | 1.90% | 0.75% | 0.48% | 0.17% | 0.19%0.11 | % | 0.10% |
Mix proportions of SACC
| Cement kg/m3 | Water kg/m3 | Aggregate kg/m3 | Sand kg/m3 | Water reducer % |
|---|---|---|---|---|
| 430 | 160 | 975 | 835 | 1% |
The relationship between the total porosity of concrete and the mass loss of dimensionless chemically bound water_
| Temperature (°C) | Total porosity (ml/g) | Dimensionless chemically bound water loss (wd/c) |
|---|---|---|
| 100 | 9.9 | 0.034 |
| 200 | 11.9 | 0.075 |
| 300 | 14.4 | 0.113 |
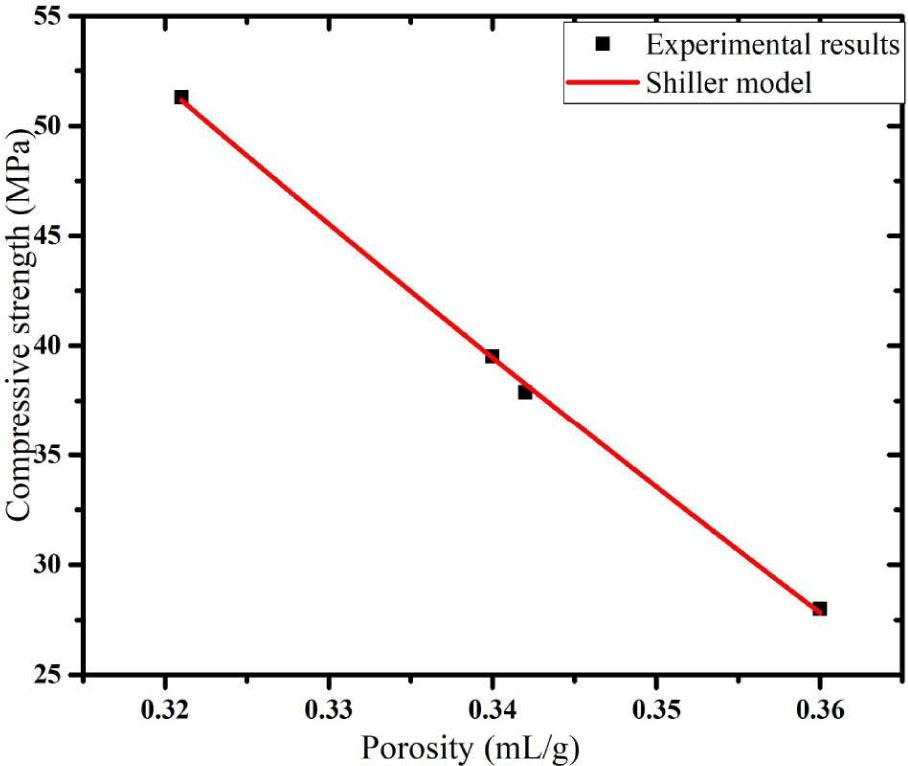
Compressive strength results of the SACC
| Specimens types | Temperature (°C) | |||
|---|---|---|---|---|
| 20 Ref | 100 | 200 | 300 | |
| Compressive strength | 51.31 | 39.52 | 37.88 | 28 |
| R/% | 0 | 22.97 | 26.17 | 45.42 |