
Fig. 1
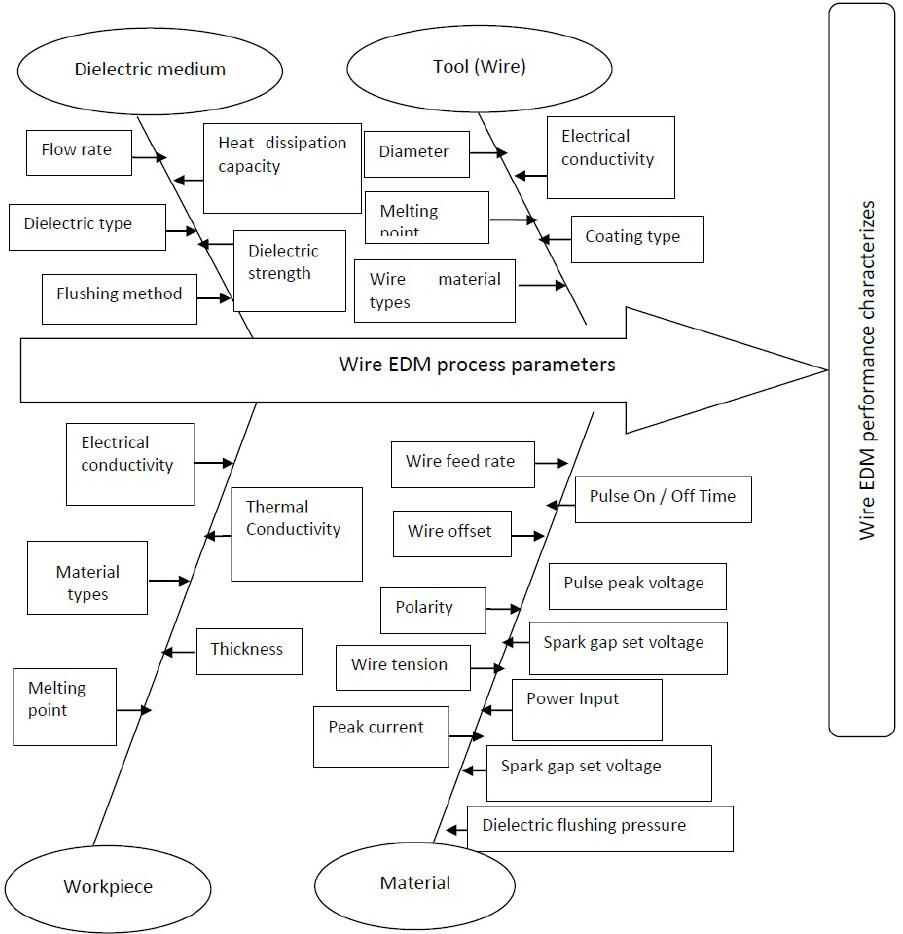
Fig. 2
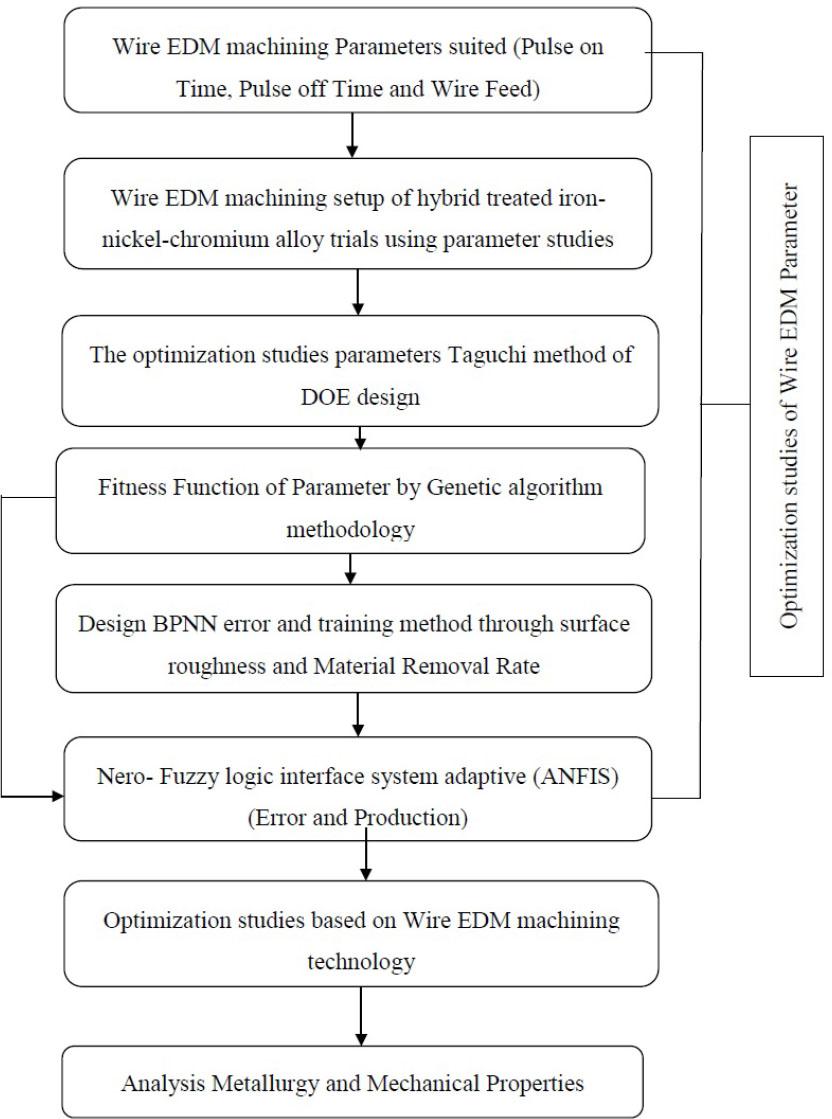
Fig. 3
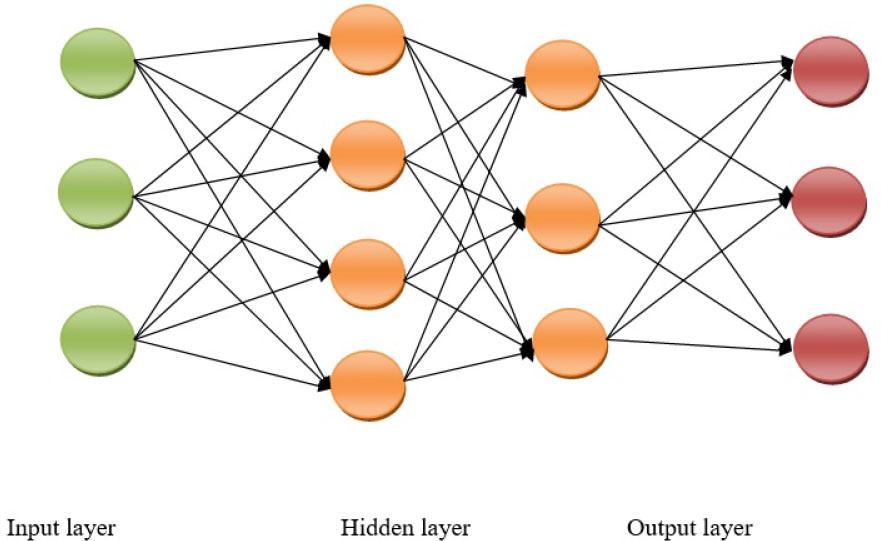
Fig. 4
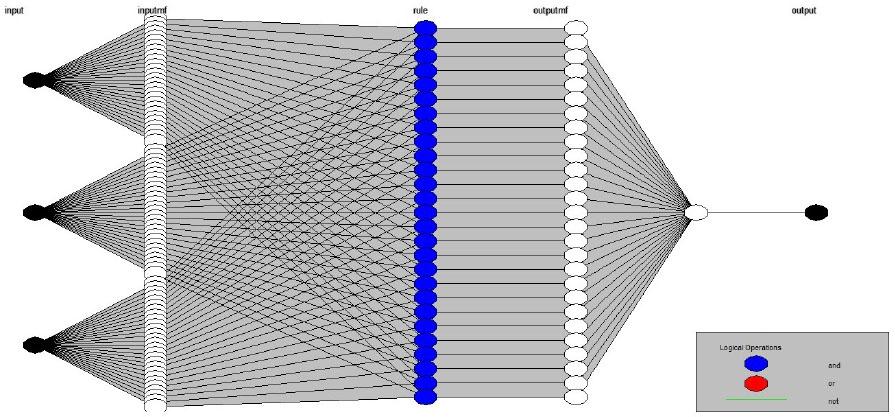
Fig. 5
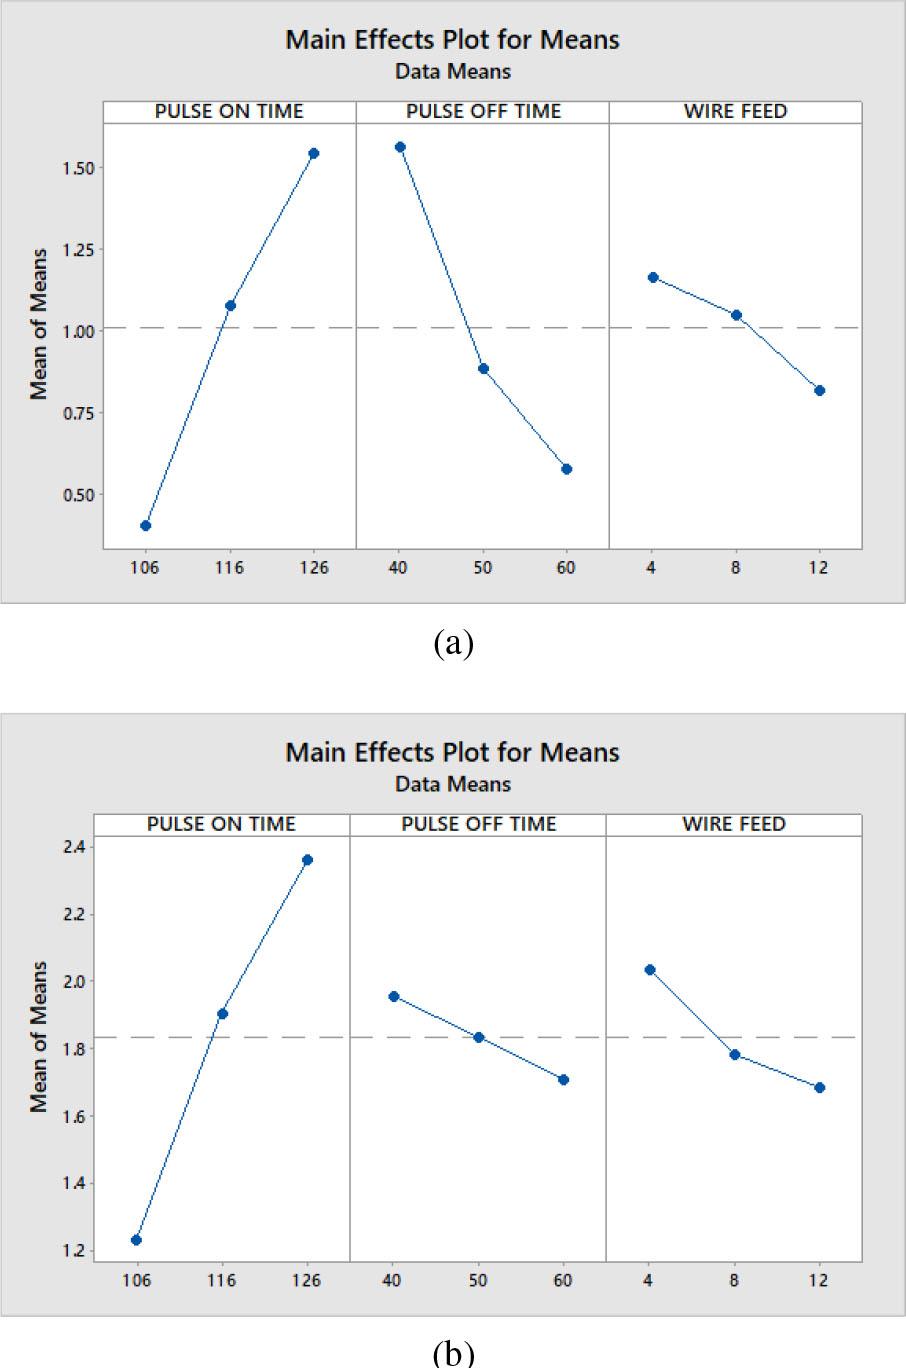
Fig. 6
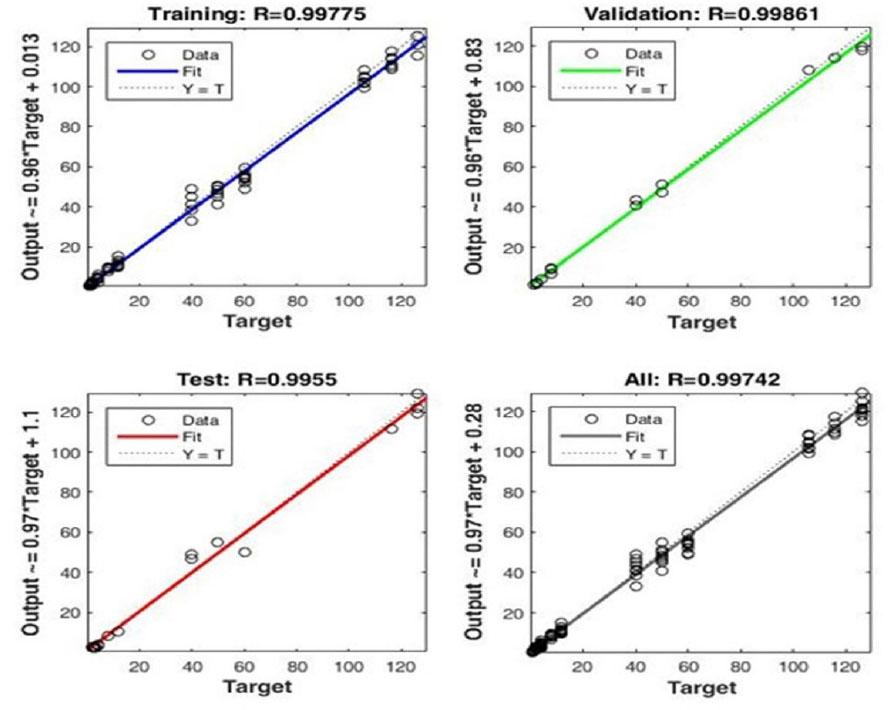
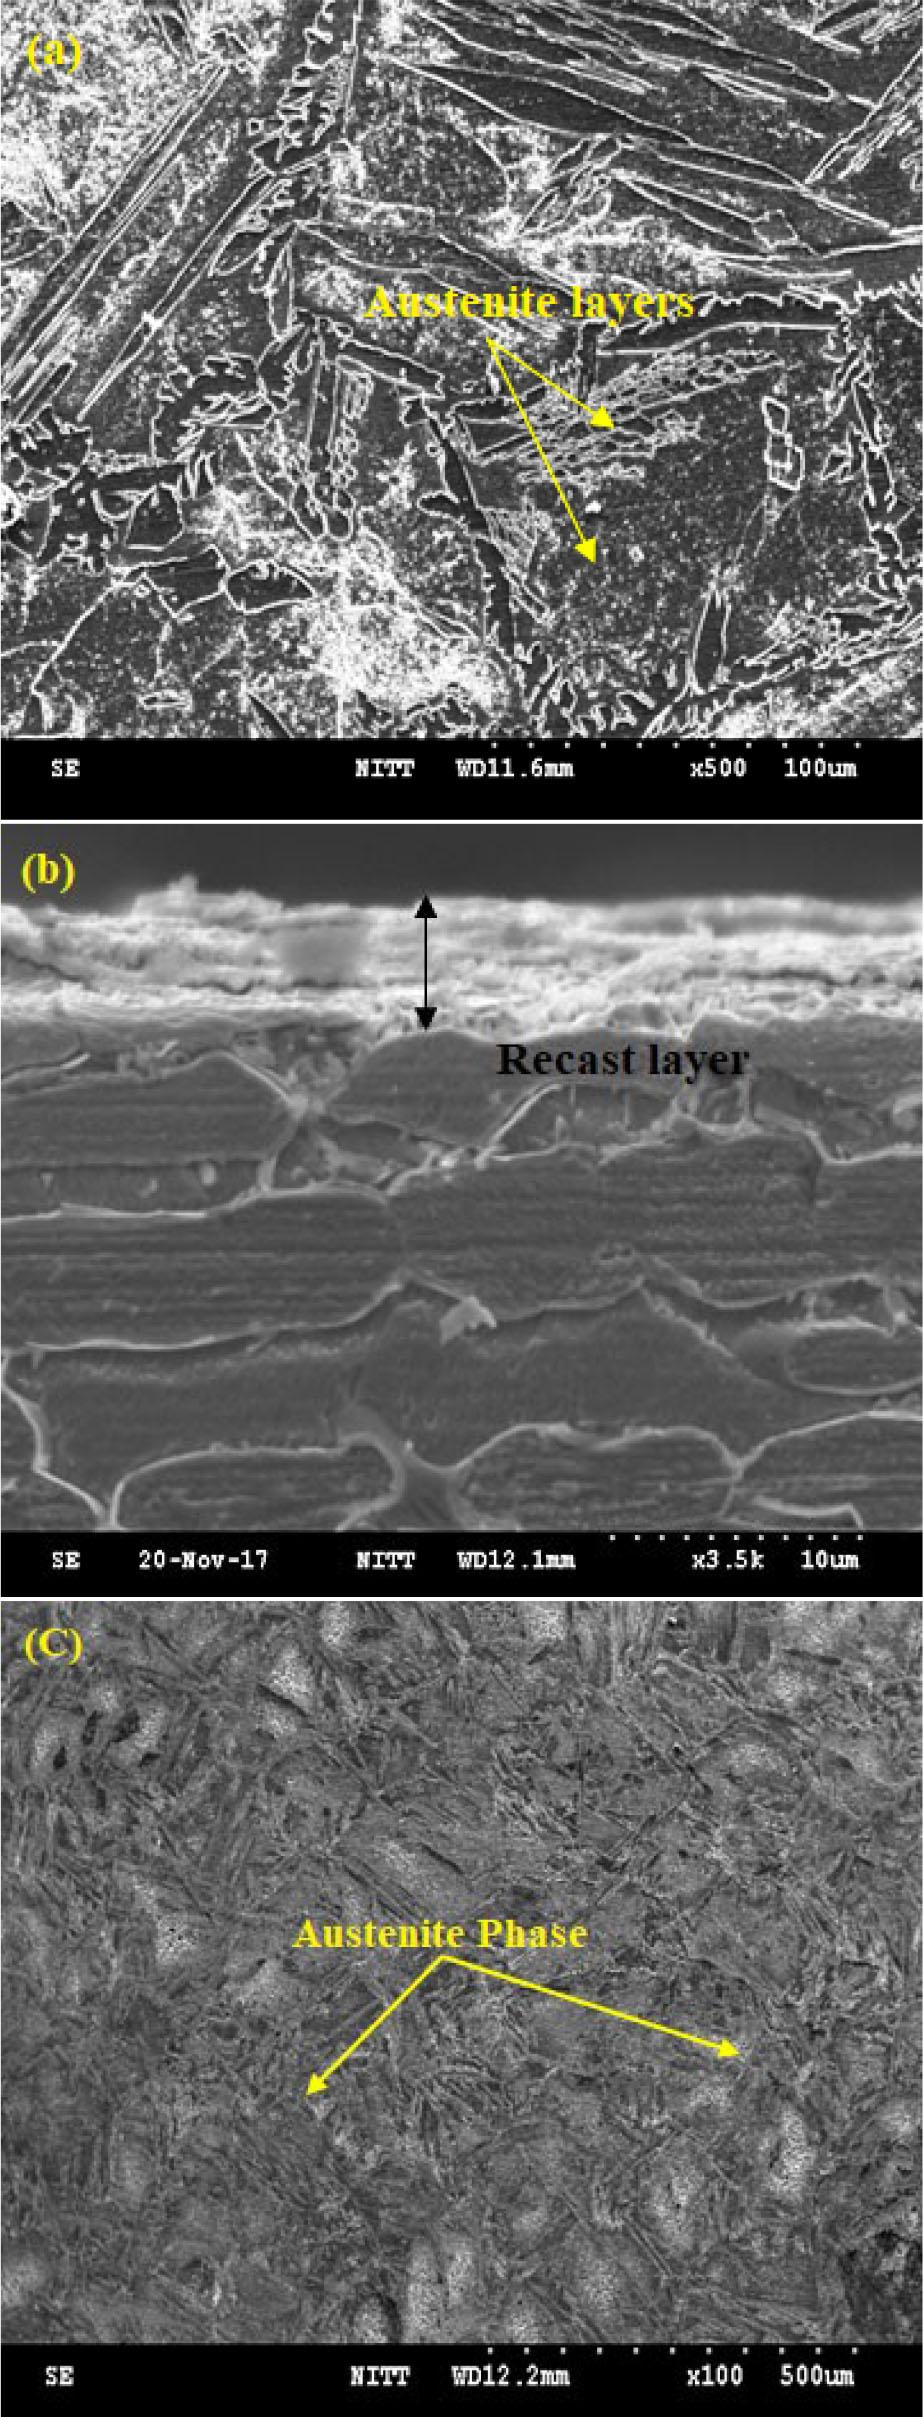
Fig. 7
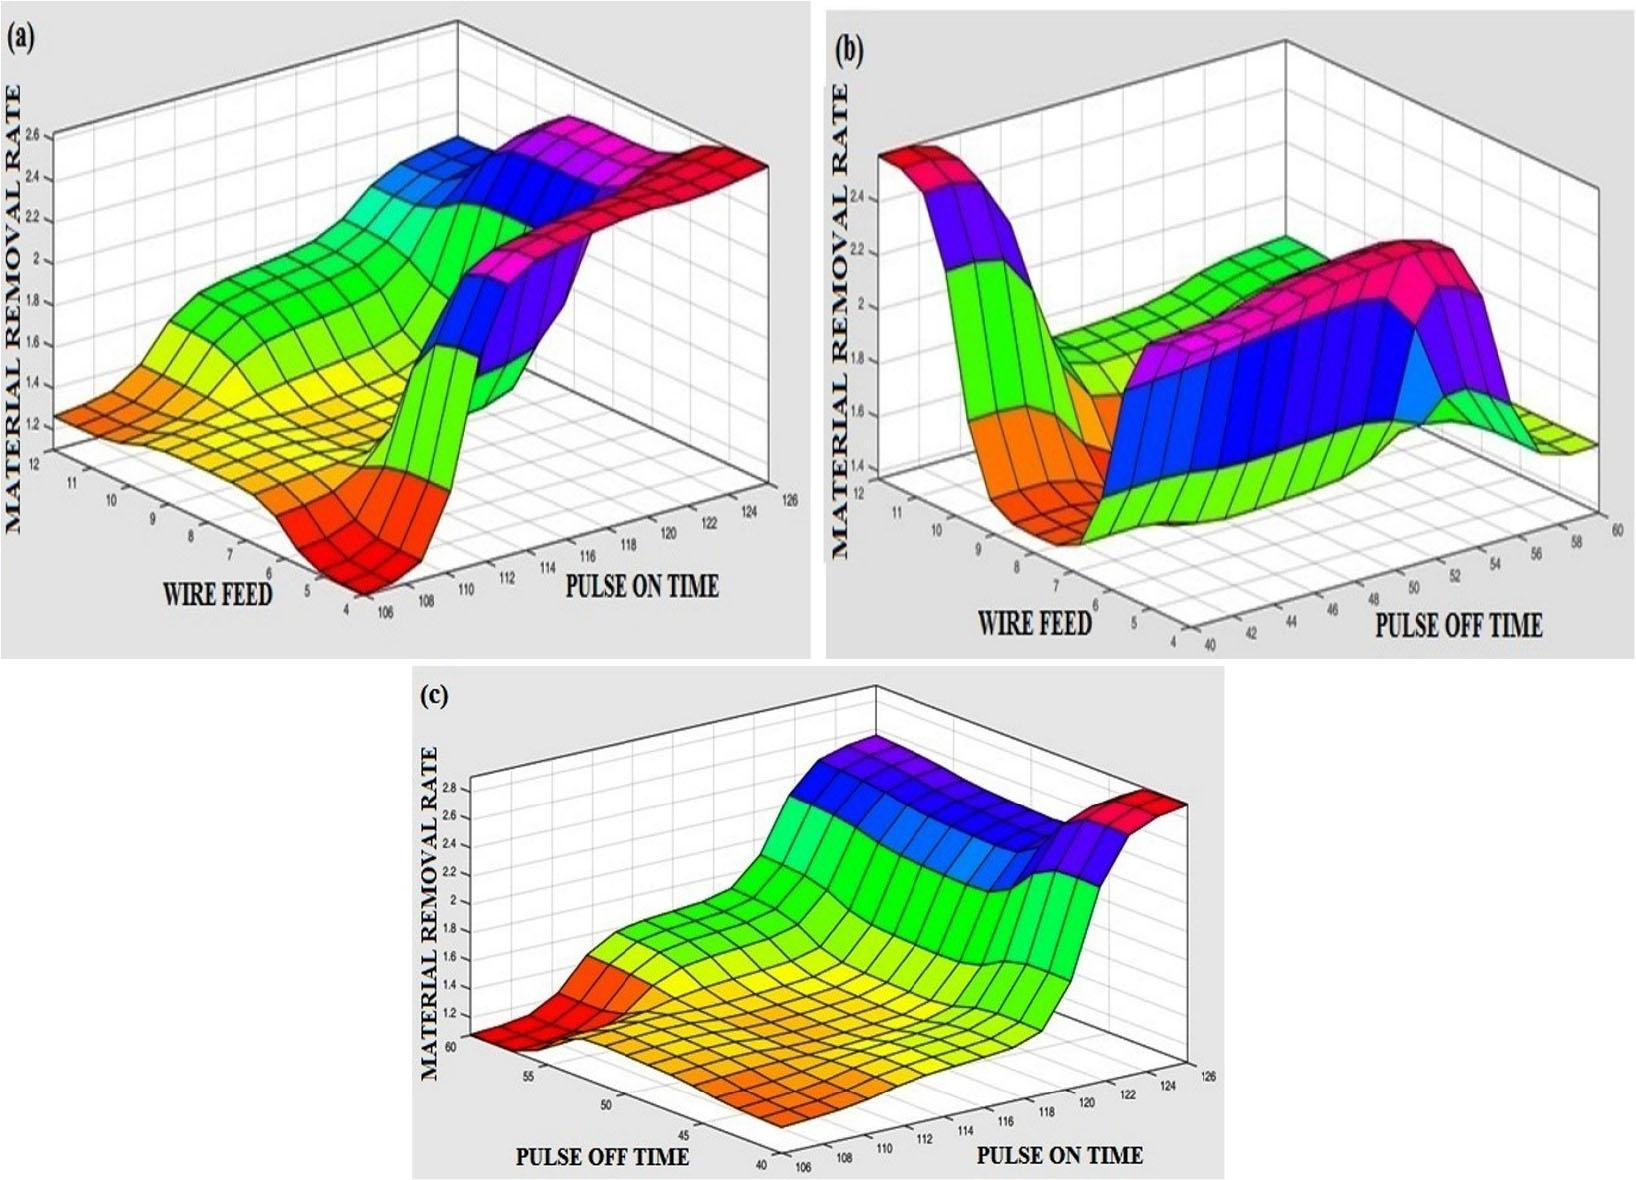
Fig. 8
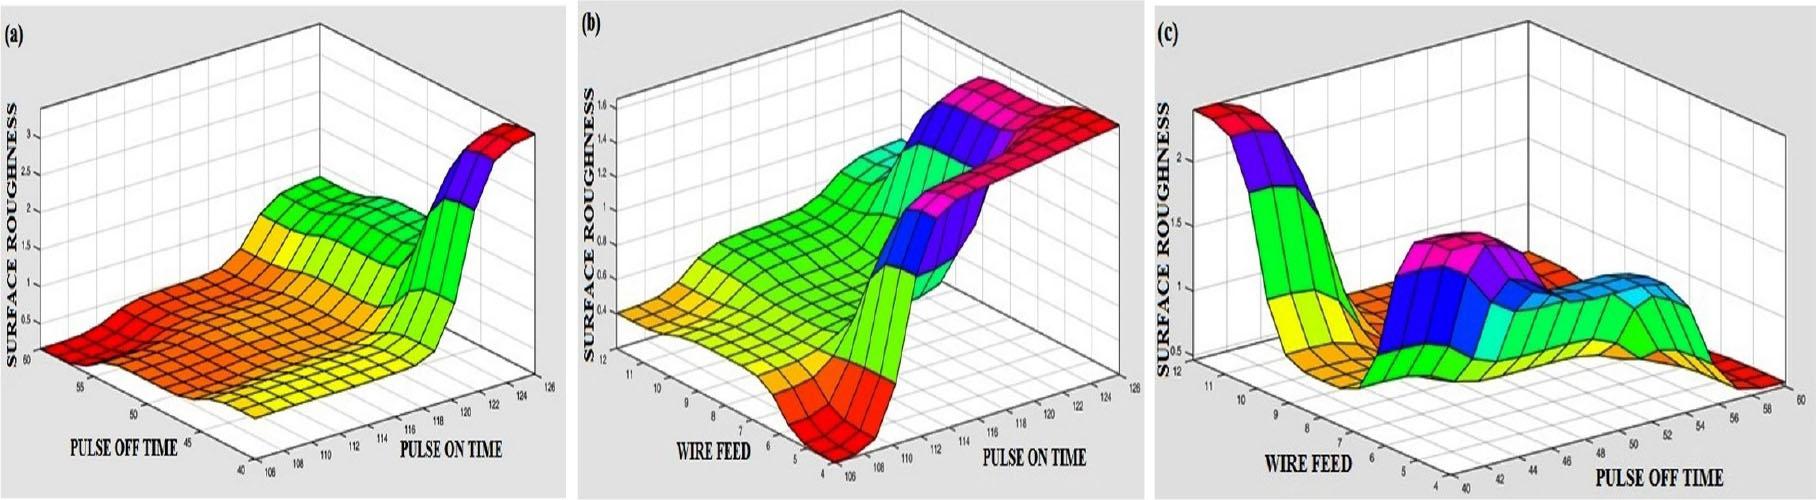
Fig. 9
EDM process parameter of Taguchi L27 orthogonal array
| Experimental trials | Factor | ||
|---|---|---|---|
| A | B | C | |
| 1 | 1 | 1 | 1 |
| 2 | 1 | 1 | 2 |
| 3 | 1 | 1 | 3 |
| 4 | 1 | 2 | 1 |
| 5 | 1 | 2 | 2 |
| 6 | 1 | 2 | 3 |
| 7 | 1 | 3 | 1 |
| 8 | 1 | 3 | 2 |
| 9 | 1 | 3 | 3 |
| 10 | 2 | 1 | 1 |
| 11 | 2 | 1 | 2 |
| 12 | 2 | 1 | 3 |
| 13 | 2 | 2 | 1 |
| 14 | 2 | 2 | 2 |
| 15 | 2 | 2 | 3 |
| 16 | 2 | 3 | 1 |
| 17 | 2 | 3 | 2 |
| 18 | 2 | 3 | 3 |
| 19 | 3 | 1 | 1 |
| 20 | 3 | 1 | 2 |
| 21 | 3 | 1 | 3 |
| 22 | 3 | 2 | 1 |
| 23 | 3 | 2 | 2 |
| 24 | 3 | 2 | 3 |
| 25 | 3 | 3 | 1 |
| 26 | 3 | 3 | 2 |
| 27 | 3 | 3 | 3 |
Cumulative experimental data of EDM process_
| SI.NO | Pulse on time T ON (μ sec) | Pulse off time T OFF (μ sec) | Wire feed WF (m/min) | Material removal rate MRR (mm/min) | Surface roughness SR (μm) |
|---|---|---|---|---|---|
| 1 | 106 | 40 | 4 | 0.68 | 1.385 |
| 2 | 106 | 40 | 8 | 0.71 | 1.255 |
| 3 | 106 | 40 | 12 | 0.505 | 1.175 |
| 4 | 106 | 50 | 8 | 0.48 | 1.35 |
| 5 | 106 | 50 | 12 | 0.405 | 1.265 |
| 6 | 106 | 50 | 4 | 0.2 | 1.105 |
| 7 | 106 | 60 | 12 | 0.315 | 1.35 |
| 8 | 106 | 60 | 4 | 0.165 | 1.14 |
| 9 | 106 | 60 | 8 | 0.165 | 1.08 |
| 10 | 116 | 40 | 12 | 2.405 | 2.57 |
| 11 | 116 | 40 | 4 | 2.205 | 2.39 |
| 12 | 116 | 40 | 8 | 0.75 | 1.435 |
| 13 | 116 | 50 | 4 | 1.54 | 2.525 |
| 14 | 116 | 50 | 8 | 0.58 | 1.38 |
| 15 | 116 | 50 | 12 | 0.66 | 1.72 |
| 16 | 116 | 60 | 8 | 0.47 | 1.63 |
| 17 | 116 | 60 | 12 | 0.625 | 1.85 |
| 18 | 116 | 60 | 4 | 0.5 | 1.625 |
| 19 | 126 | 40 | 8 | 3.4 | 2.9 |
| 20 | 126 | 40 | 12 | 1.26 | 1.85 |
| 21 | 126 | 40 | 4 | 2.2 | 2.66 |
| 22 | 126 | 50 | 12 | 0.91 | 2.08 |
| 23 | 126 | 50 | 4 | 1.66 | 2.635 |
| 24 | 126 | 50 | 8 | 1.54 | 2.445 |
| 25 | 126 | 60 | 4 | 1.34 | 2.855 |
| 26 | 126 | 60 | 8 | 1.345 | 2.56 |
| 27 | 126 | 60 | 12 | 0.29 | 1.295 |
(a) 1st EDM Process parameter of alloy 20 materials; (b) 2nd EDM Process parameter of alloy 20 materials
| No | MRR (mm/min) | SR (μm) | ||||
|---|---|---|---|---|---|---|
| EOP | BPOP | ERROR | EOP | BPOP | ERROR | |
| 1 | 0.68 | 0.5643 | 11.57 | 1.385 | 1.3627 | 2.23 |
| 2 | 0.71 | 0.7451 | −3.51 | 1.255 | 1.2712 | −1.62 |
| 4 | 0.48 | 0.4921 | −1.21 | 1.35 | 1.3215 | 2.85 |
| 10 | 2.405 | 2.4184 | −1.34 | 2.57 | 2.3954 | 17.46 |
| 14 | 0.58 | 0.5683 | 1.17 | 1.38 | 1.4725 | −9.25 |
| 17 | 0.625 | 1.0514 | −42.64 | 1.85 | 2.3891 | −53.91 |
| 22 | 0.91 | 0.9244 | −1.44 | 2.08 | 2.0176 | 6.24 |
| 23 | 1.66 | 1.7587 | −9.87 | 2.635 | 2.7871 | −15.21 |
| 25 | 1.34 | 1.3572 | −1.72 | 2.855 | 2.8142 | 4.08 |
Regression ratio of material removal rate
| Source | DF | Adj SS | Adj MS | F-Value | P-Value |
|---|---|---|---|---|---|
| Regression | 3 | 13.1260 | 4.3753 | 21.32 | 0.000 |
| Pulse on time t on (μ sec) | 1 | 7.8095 | 7.8095 | 38.06 | 0.450 |
| Pulse off time t on (μ sec) | 1 | 5.0545 | 5.0545 | 24.63 | 0.300 |
| Wire feed | 1 | 0.2620 | 0.2620 | 1.28 | 0.250 |
| Error | 23 | 4.7195 | 0.2052 | ||
| Total | 26 | 17.8454 |
Results of BPNN-ANFIS optimization
| Sl. No. | Input parameters | Output parameters | |||
|---|---|---|---|---|---|
| Pulse on time (μ sec) | Pulse off time (μ sec) | Wire feed (m/min) | Optimal value (mm) | Machining performance | |
| 1. | 110 | 80 | 10 | 0.184 | Material removal rate |
| 2. | 106 | 60 | 10 | 1.95 | Surface roughness |
EDM process parameters and error of confirmation experiment
| Input parameters | Output parameters | ||||
|---|---|---|---|---|---|
| Pulse on time (μ sec) | Pulse off time (μ sec) | Wire feed (m/min) | Material removal rate (mm/min) | Surface roughness (μm) | |
| Experiment predicted by | 106 | 60 | 8 | 0.155 | 1.08 |
| BPNN-ANFIS model | 105.7 | 59 | 8 | 0.1675 | 1.1182 |
| Error % | −1.5 | −3.5 | |||
BPNN parameters and interlayer details
| Name | Number | No. | MRR | SR |
|---|---|---|---|---|
| parameter. Show | 50 | 1st | 9 | 9 |
| Maximum parameter. Epochs | 1000 | |||
| Number of input parameter | 3 | 2nd | 8 | 10 |
| Number of output parameter | 1 |
Process parameters employed for EDM
| Parameter | Unit | Factor | Level | ||
|---|---|---|---|---|---|
| 1 | 2 | 3 | |||
| Pulse on time | (μ sec) | A | 106 | 116 | 126 |
| Pulse off time | (μ sec) | B | 40 | 50 | 60 |
| Wire feed | (m/min) | C | 4 | 8 | 12 |
Regression ratio of surface roughness SR (μm)
| Source | DF | Adj SS | Adj MS | F-Value | P-Value |
|---|---|---|---|---|---|
| Regression | 3 | 1.96406 | 0.65469 | 16.14 | 0.000 |
| Pulse on time t on (μ sec) | 1 | 1.76964 | 1.76964 | 43.62 | 0.420 |
| Pulse off time t on (μ sec) | 1 | 0.08050 | 0.08050 | 1.98 | 0.470 |
| Wire feed | 1 | 0.11392 | 0.11392 | 2.81 | 0.210 |
| Error | 23 | 0.93314 | 0.04057 | ||
| Total | 26 | 2.89719 |
Chemical composition of alloy 20 (in wt%)
| Si | S | P | Mn | C | Nb | Mo | Cu | Cr | Fe | Ni |
|---|---|---|---|---|---|---|---|---|---|---|
| 1 | 0.035 | 0.045 | 2 | 0.07 | 1 | 3 | 4 | 21 | 29.8 | 38 |