
Table 1
Indicator description.
| Indicator | Description | Period |
|---|---|---|
| Employment rate | The percentage of employed persons, 15–64 years (% of total population) | 2011–2023 |
| Gini Coefficient | Gini Coefficient for disposable income before social transfers (pensions included in social transfers) (takes values between 0 and 100) | 2011–2023 |
| Women managers | Share of women holding senior management positions (%) | 2012–2023 |
| Tertiary education | Share of the population aged 25–34 who have completed tertiary education, ISCED level 5–8 (%) | 2011–20223 |
| Social protection expenses | Social protection expenditure (% of GDP) | 2011–2022 |
| R&D expenditures | Gross domestic expenditure on research and experimental development – GERD (% of GDP) | 2011–2022 |
| Trade openness | The sum of imports and exports (% of GDP) | 2011–2023 |
| Remittances | Personal remittances received (% of GDP) | 2011–2022 |
Source: Author’s contribution.
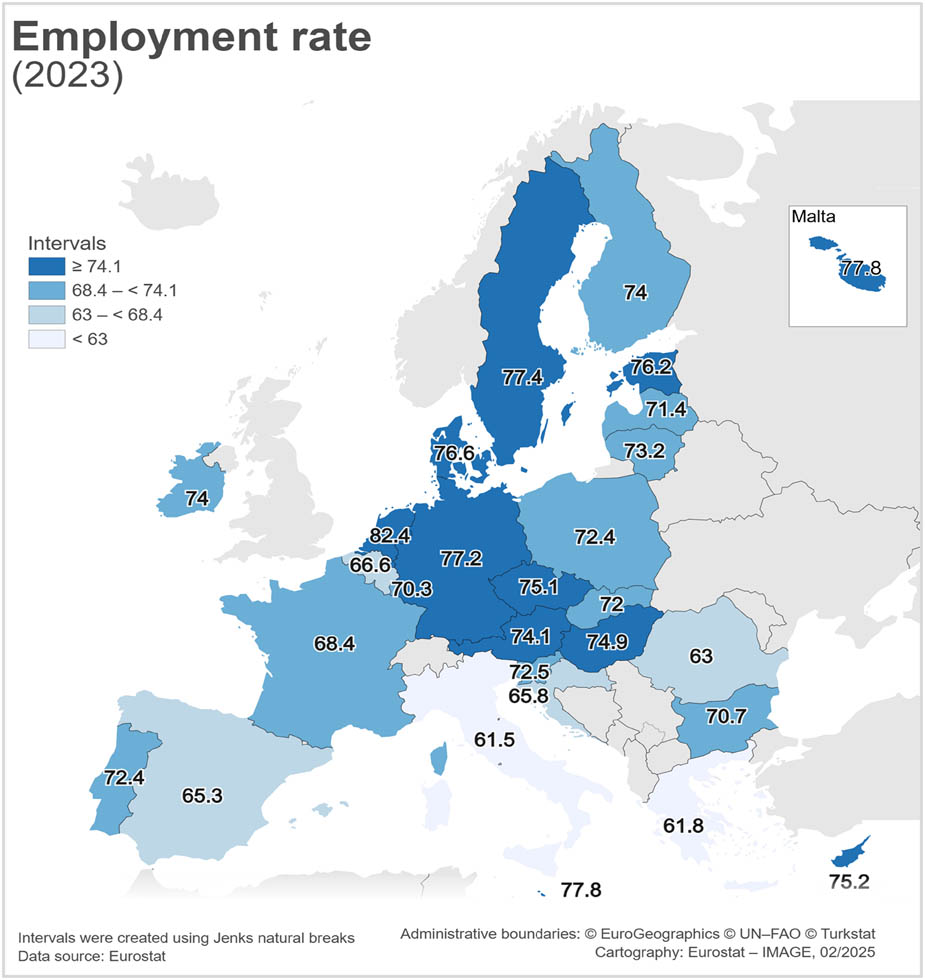
Figure 1
Employment rate (%), EU member states in 2023.
Source: Author’s estimation, based on the Eurostat Database.
Table 2
Causality testing and model identification for panel data analysis.
| Explanatory variable | Granger causality | Pooled OLS | FE | RE |
|---|---|---|---|---|
| Gini coefficient | 11.76*1 | −0.129* | −0.210** | −0.201* |
| Women managers | 5.91*1 | 0.039* | 0.050* | 0.049* |
| Trade openness | 7.64*1 | 0.059* | 0.118* | 0.075* |
| Research and Development expenditures | 5.23*1 | 0.137* | 0.030 | 0.064* |
| Tertiary education | 23.08*1 | 0.064* | 0.201* | 0.189* |
| Remittances | 14.05*1 | 0.006 | 0.008 | 0.004 |
| Social protection expenses | 9.31*2 | −0.045 | −0.028 | −0.036 |
| Constant | − | 4.348* | 3.657* | 3.883* |
Source: Author’s estimations in STATA16, based on the Eurostat and UNCTAD data.
Note: *statistical significance at 5%, **statistical significance at 10%, 1first lag, 2second lag.
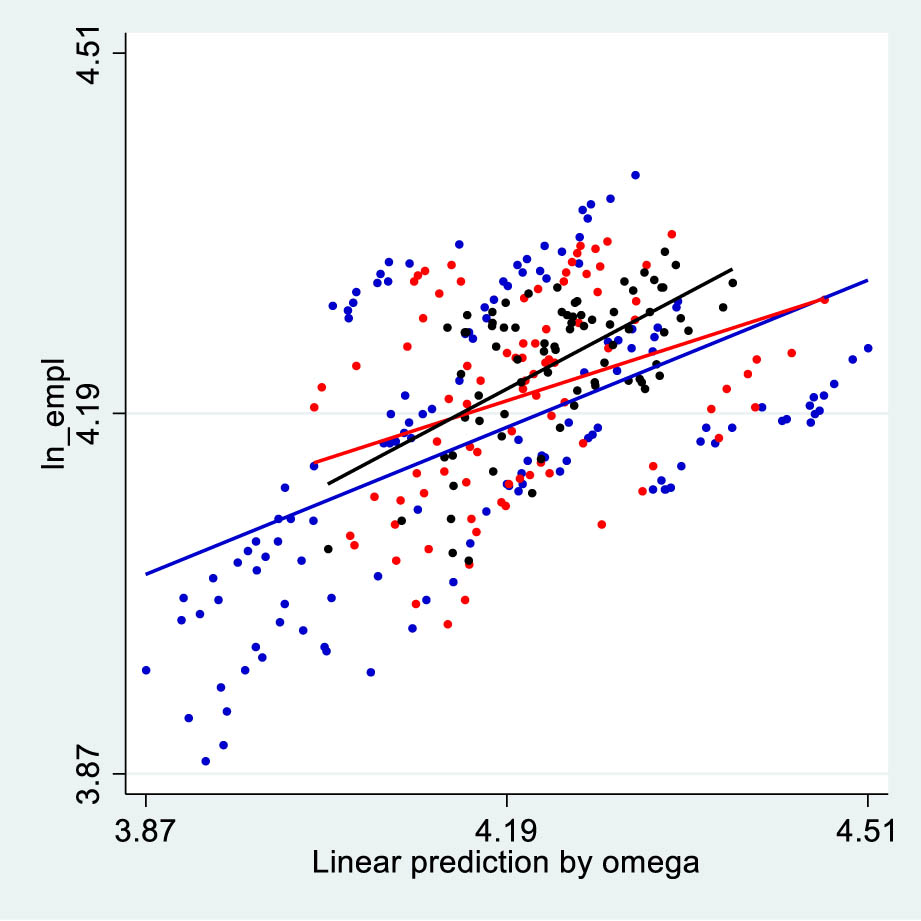
Figure 2
The heterogeneous slopes for the three clusters.
Source: Author’s estimation, using Stata 16.
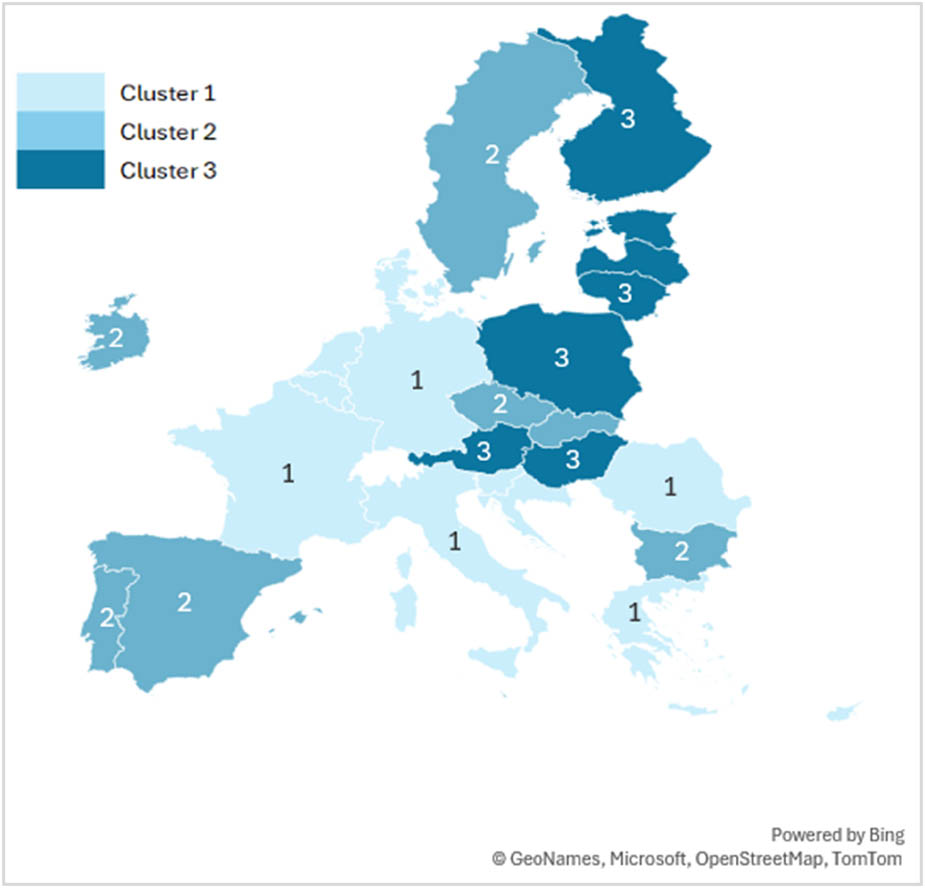
Figure 3
Country clusters, based on employment rate and its influencing factors.
Source: Author’s estimation, based on the Eurostat Database.
Table 3
Estimation results.
| Explanatory variable | Cluster 1 | Cluster 2 | Cluster 3 |
|---|---|---|---|
| Gini coefficient | −0.181* | 0.180* | −0.366* |
| Women managers | −0.0003 | 0.036* | 0.086* |
| Trade openness | 0.203* | 0.045 | 0.006 |
| Research and Development expenditures | 0.054* | −0.005 | −0.003 |
| Tertiary education | 0.157* | 0.413* | −0.036 |
| Remittances | 0.043* | 0.015 | −0.075* |
| Social protection expenses | −0.045 | −0.140* | −0.079** |
| Constant | 3.169* | 2.104* | 5.797* |
| No. of countries | 12 | 8 | 7 |
| No of observations | 132 | 88 | 77 |
| R 2 within | 0.79 | 0.85 | 0.84 |
Source: Author’s estimations in STATA16, based on the Eurostat and UNCTAD data.
Note: *statistical significance at 5%, **statistical significance at 10%.