
Table 1
Main variables extracted from Facebook posts using the CrowdTangle platform, covering the period from March 2020 to June 2022, with posts selected by choosing “Covid” as a keyword.
| Variable name | Explanation |
|---|---|
| Post Created Date | Date the post was created (used as an index for the database) |
| Page Name | Name of the page that posted |
| Page Category | Page category by industry |
| Page Description | Short description of the page |
| Type | Post type (video, status, Photo, Link) |
| Total Iteractions | Total number of interactions |
| Likes | Number of likes of the post |
| Comments | Post comment count |
| Shares | Number of shares of the post |
| Post Views | Number of views |
| URL | The link present in the post |
| Message | Post text |
Source: CrowdTangle data.
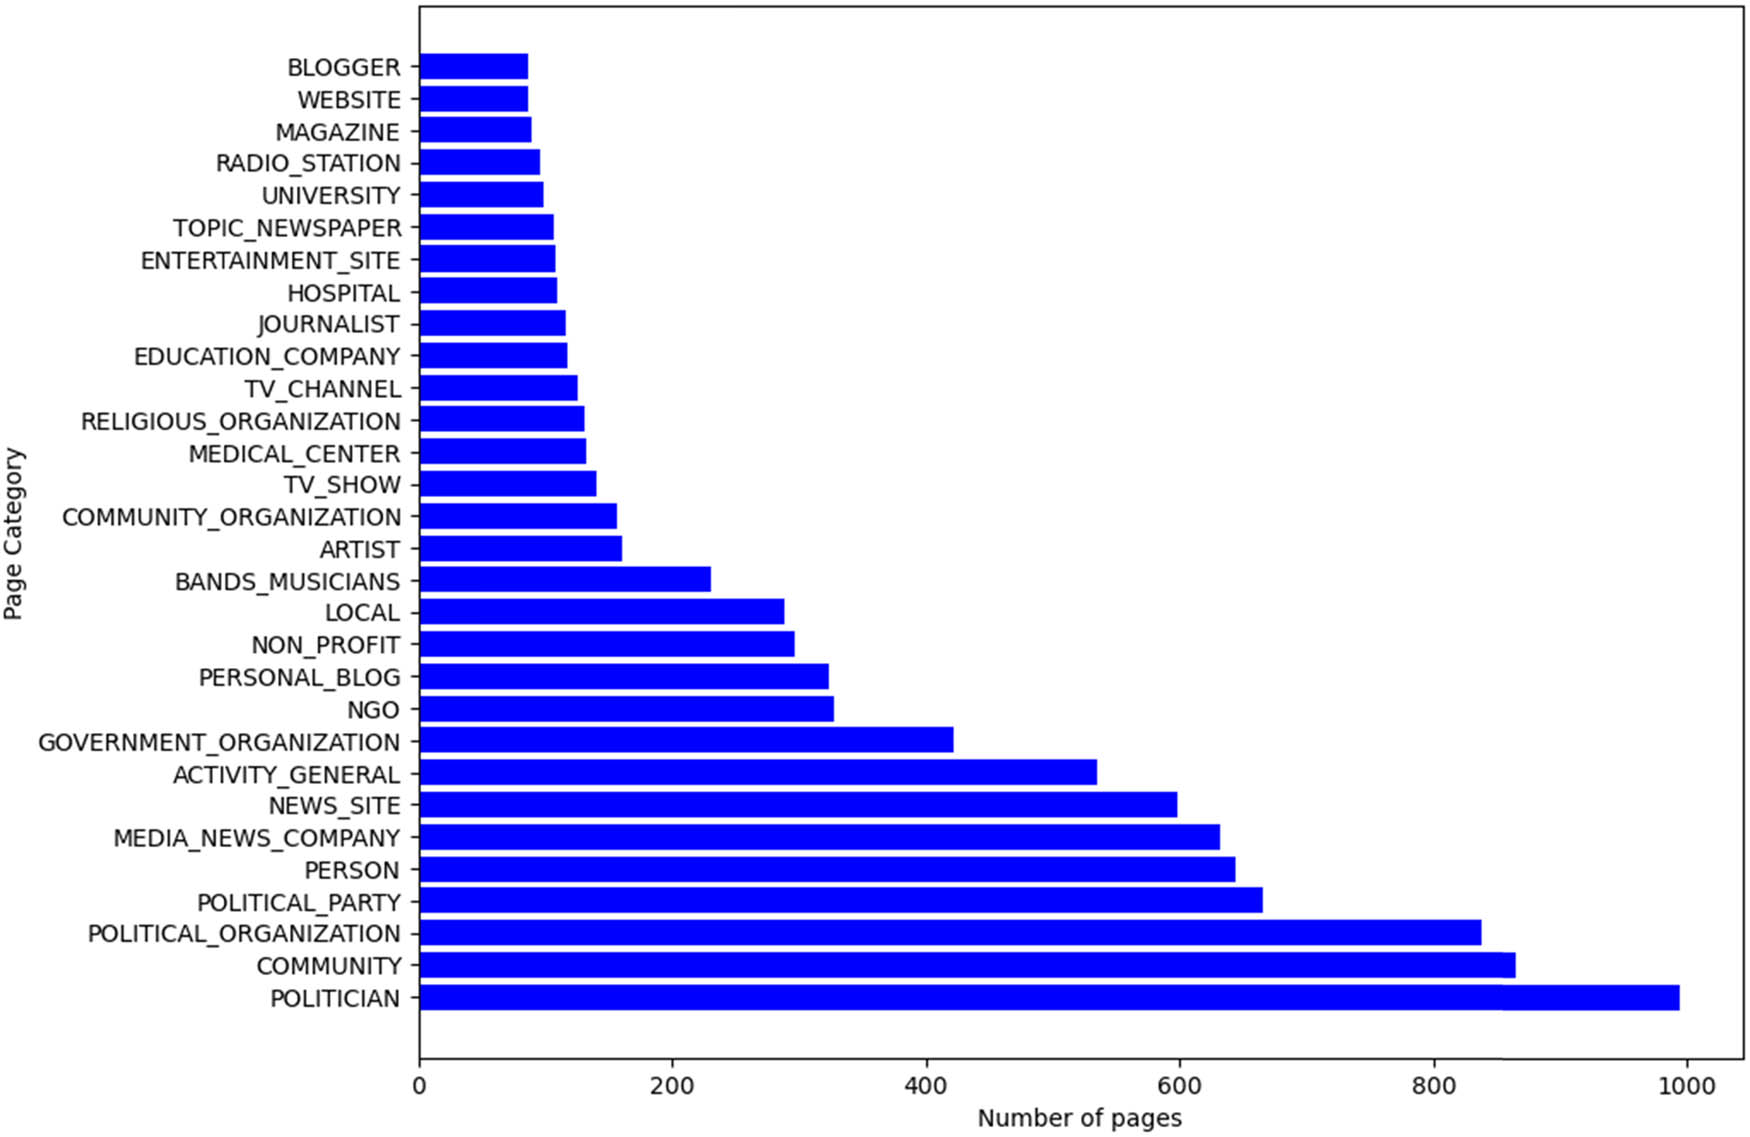
Figure 1
Pages grouped by their level of activity in the top 30 categories.
Source: Author’s contribution, https://github.com/QuantLet/Covid-RO/tree/main/EDA.
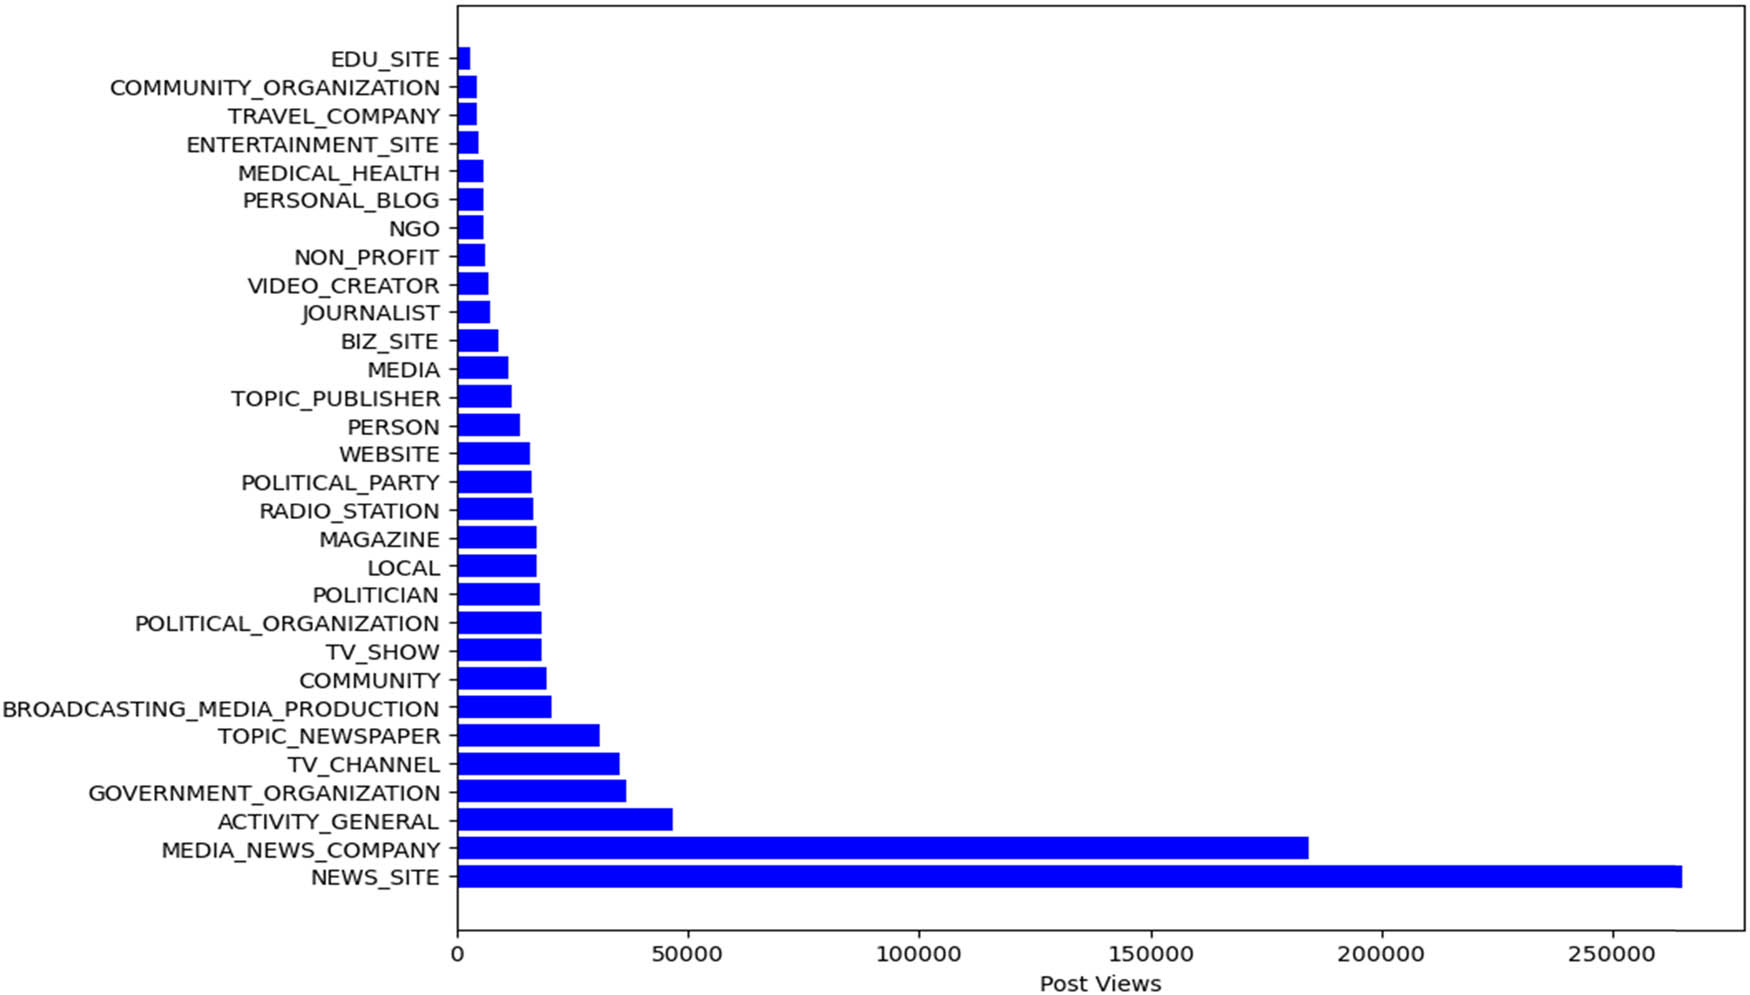
Figure 2
The number of views received by posts from different categories of Facebook pages related to COVID-19 in Romania.
Source: Author’s contribution, https://github.com/QuantLet/Covid-RO/tree/main/EDA.
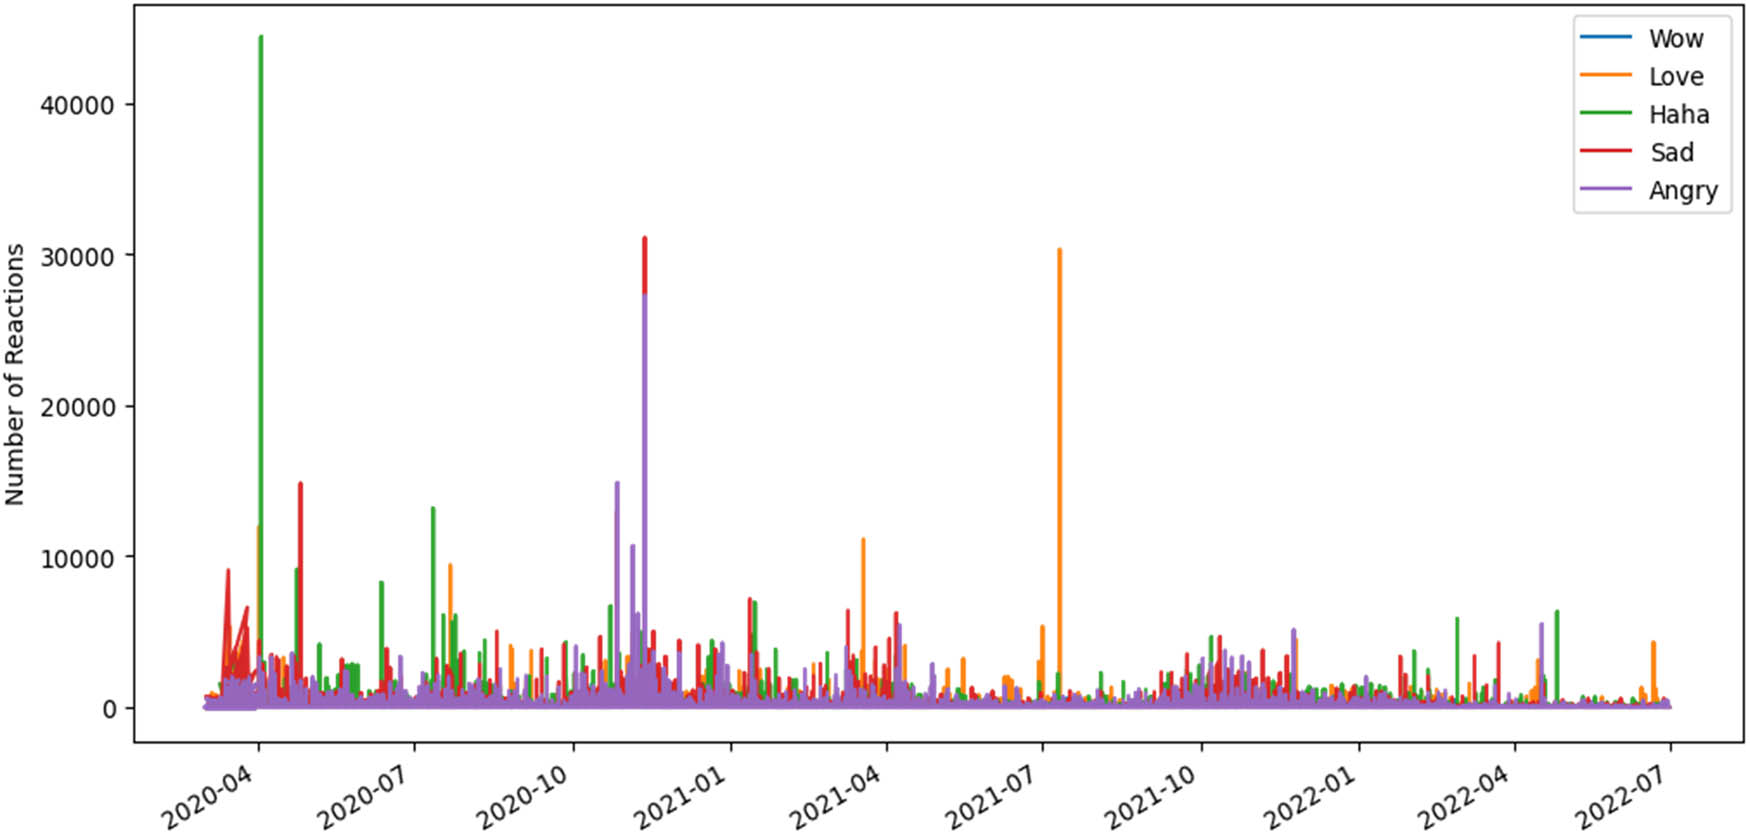
Figure 3
Public’s reaction to Facebook posts over time.
Source: Author’s contribution, https://github.com/QuantLet/Covid-RO/tree/main/EDA.
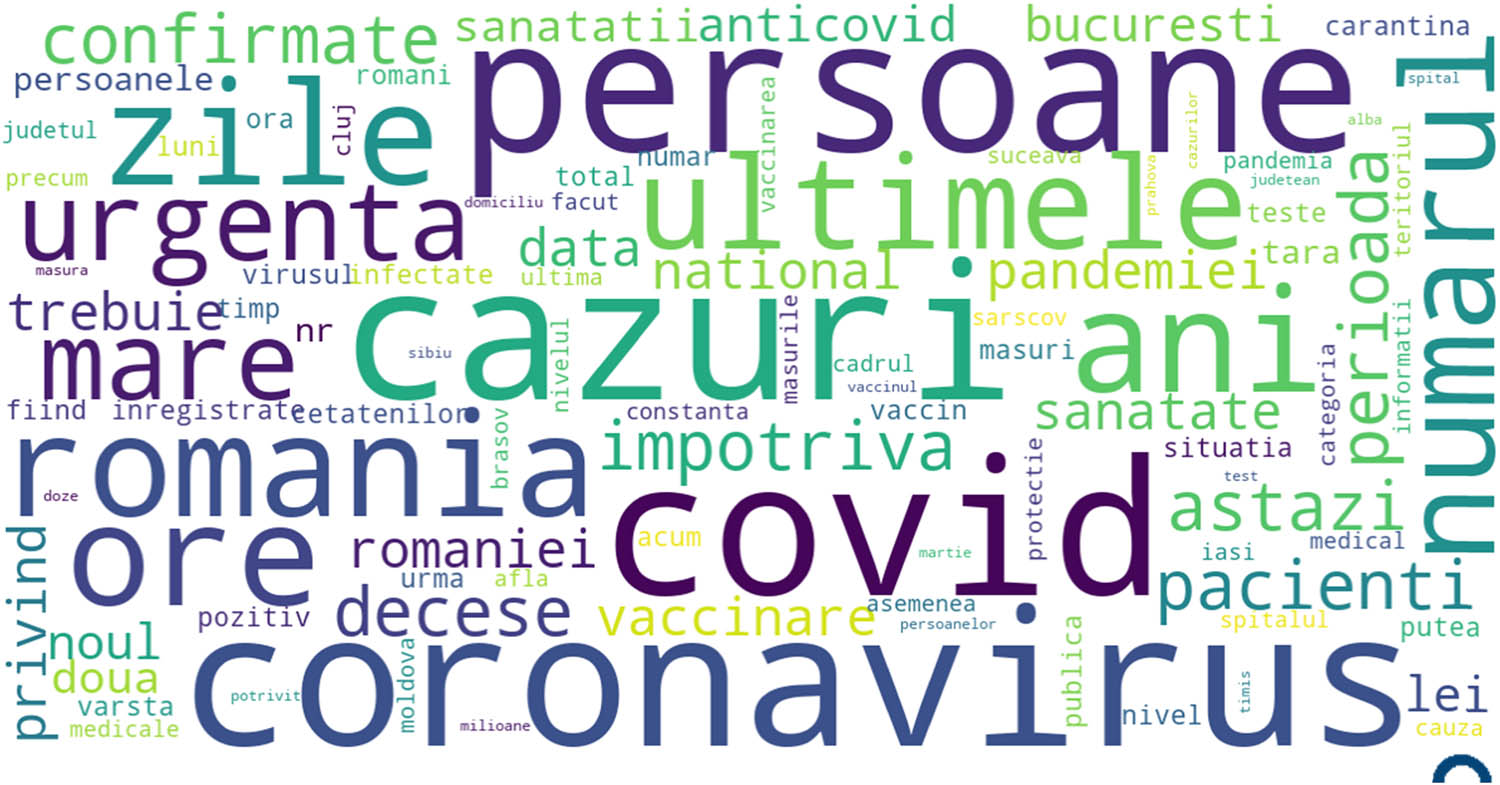
Figure 4
WorldCloud of top 100 most used words extracted from Facebook posts.
Source: Author’s contribution, https://github.com/QuantLet/Covid-RO/blob/main/LDA/WorldCloud.ipynb.
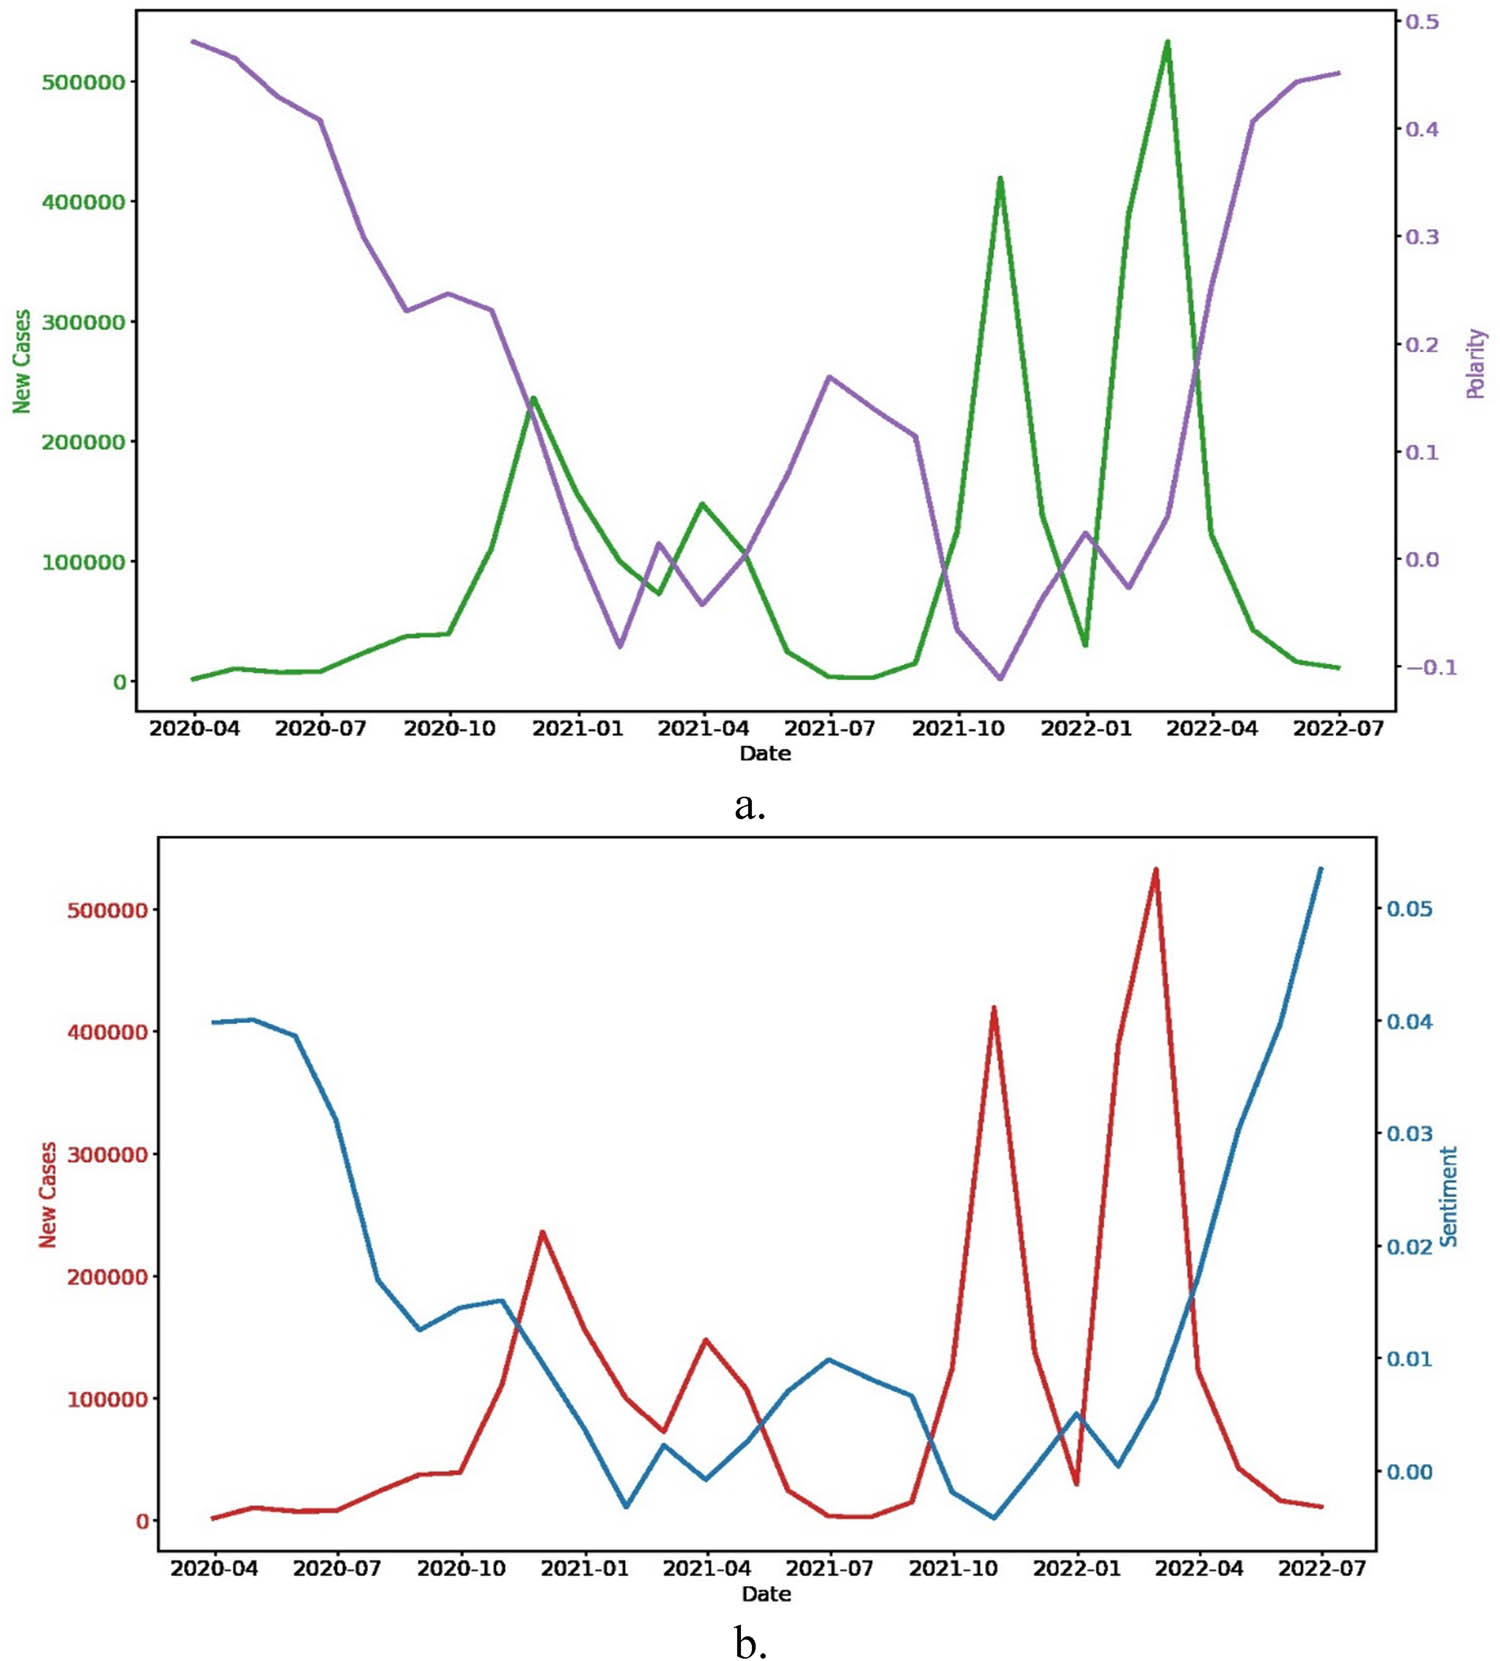
Figure 5
COVID-19 cases vs (a) Polarity and (b) Sentiment extracted from Facebook posts.
Source: Author’s contribution, https://github.com/QuantLet/Covid-RO/blob/main/LDA/Sentiment Analysis.ipynb.
Table 2
Topics identified through LDA.
| Topic | Words and probabilities |
|---|---|
| Number of cases | 0.056*“covid” + 0.040*“cases” + 0.030*“people” + 0.025*“hours” + 0.025*“recent” + 0.014*“deaths” + 0.013*“patients” + 0.011*“coronavirus” + 0.010*“number” + 0.010*“county” |
| Financial aspects | 0.027*“lei” + 0.026*“days” + 0.013*“person” + 0.012*“covid” + 0.010*“room” + 0.009*“euro” + 0.008*“rate” + 0.007*“hotel” + 0.007*“test” + 0.006*“period” |
| Health measures | 0.021*“covid” + 0.005*“Romania” + 0.004*“anticovid” + 0.004*“years” + 0.004*“against” + 0.003*“now” + 0.003*“vaccine” + 0.003*“done” + 0.003*“must” + 0.003*“health” |
Topics in Romanian: Topic 1 “0.056*“covid” + 0.040*“cazuri” + 0.030*“persoane” + 0.025*“ore” + 0.025*“ultimele” + 0.014*“decese” + 0.013*“pacienti” + 0.011*“coronavirus” + 0.010*“numarul” + 0.010*“judetul”; Topic 2 ‘0.027*“lei” + 0.026*“zile” + 0.013*“persoana” + 0.012*“covid” + 0.010*“camera” + 0.009*“euro” + 0.008*“tariful” + 0.007*“hotel” + 0.007*“test” + 0.006*“perioada”; Topic 3 ‘0.021*“covid” + 0.005*“romania” + 0.004*“anticovid” + 0.004*“ani” + 0.004*“impotriva” + 0.003*“acum” + 0.003*“vaccin” + 0.003*“facut” + 0.003*“trebuie” + 0.003*“sanatatii”.”
Source: Author’s contribution, https://github.com/QuantLet/Covid-RO/tree/main/LDA.
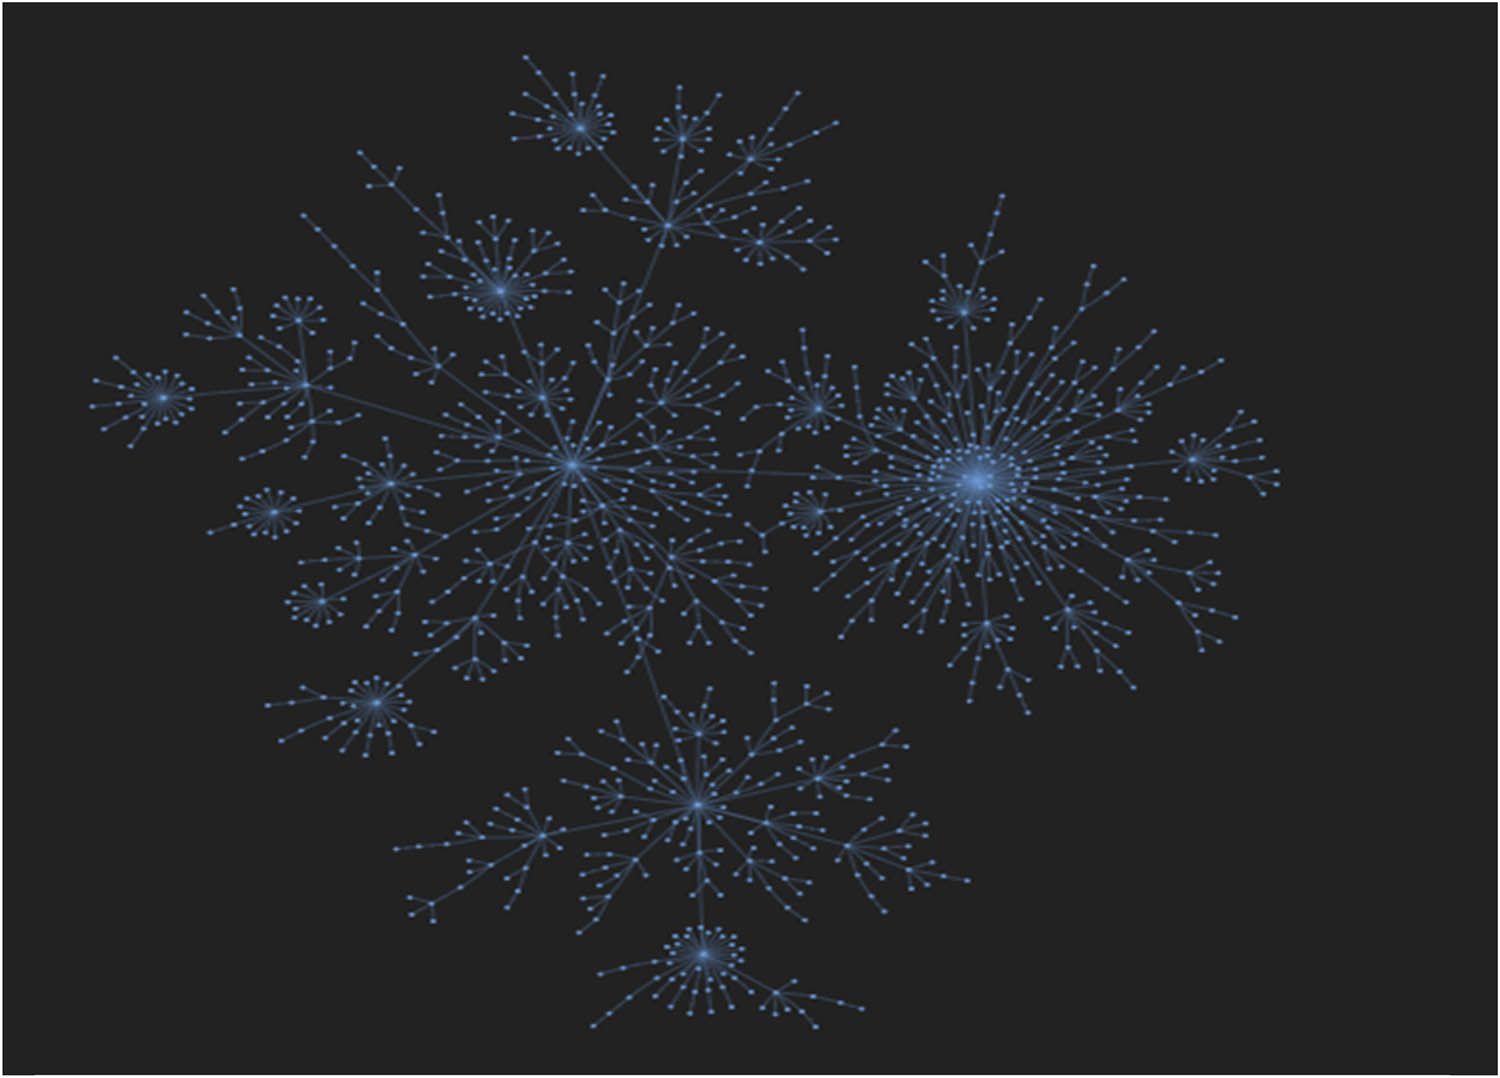
Figure 6
Social Network graph.
Source: Author’s contribution, https://github.com/QuantLet/Covid-RO/blob/main/SNA/Social Network Analysis.ipynb.
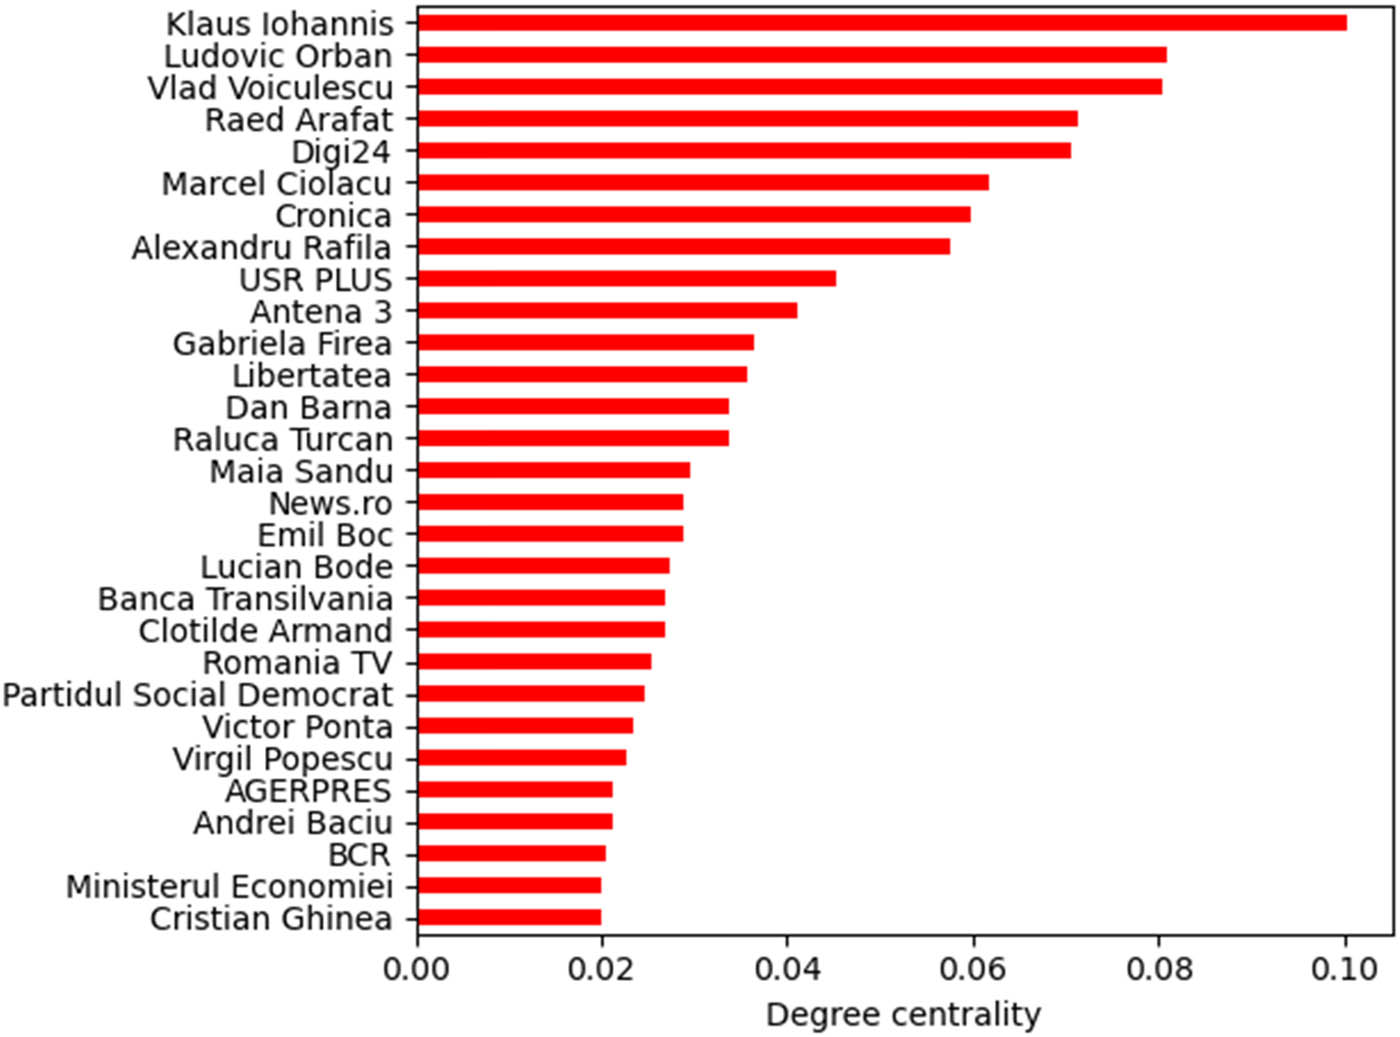
Figure 7
Degree of centrality, top 30 nodes in the network.
Source: Author’s contribution, https://github.com/QuantLet/Covid-RO/blob/main/SNA/Social Network Analysis.ipynb.
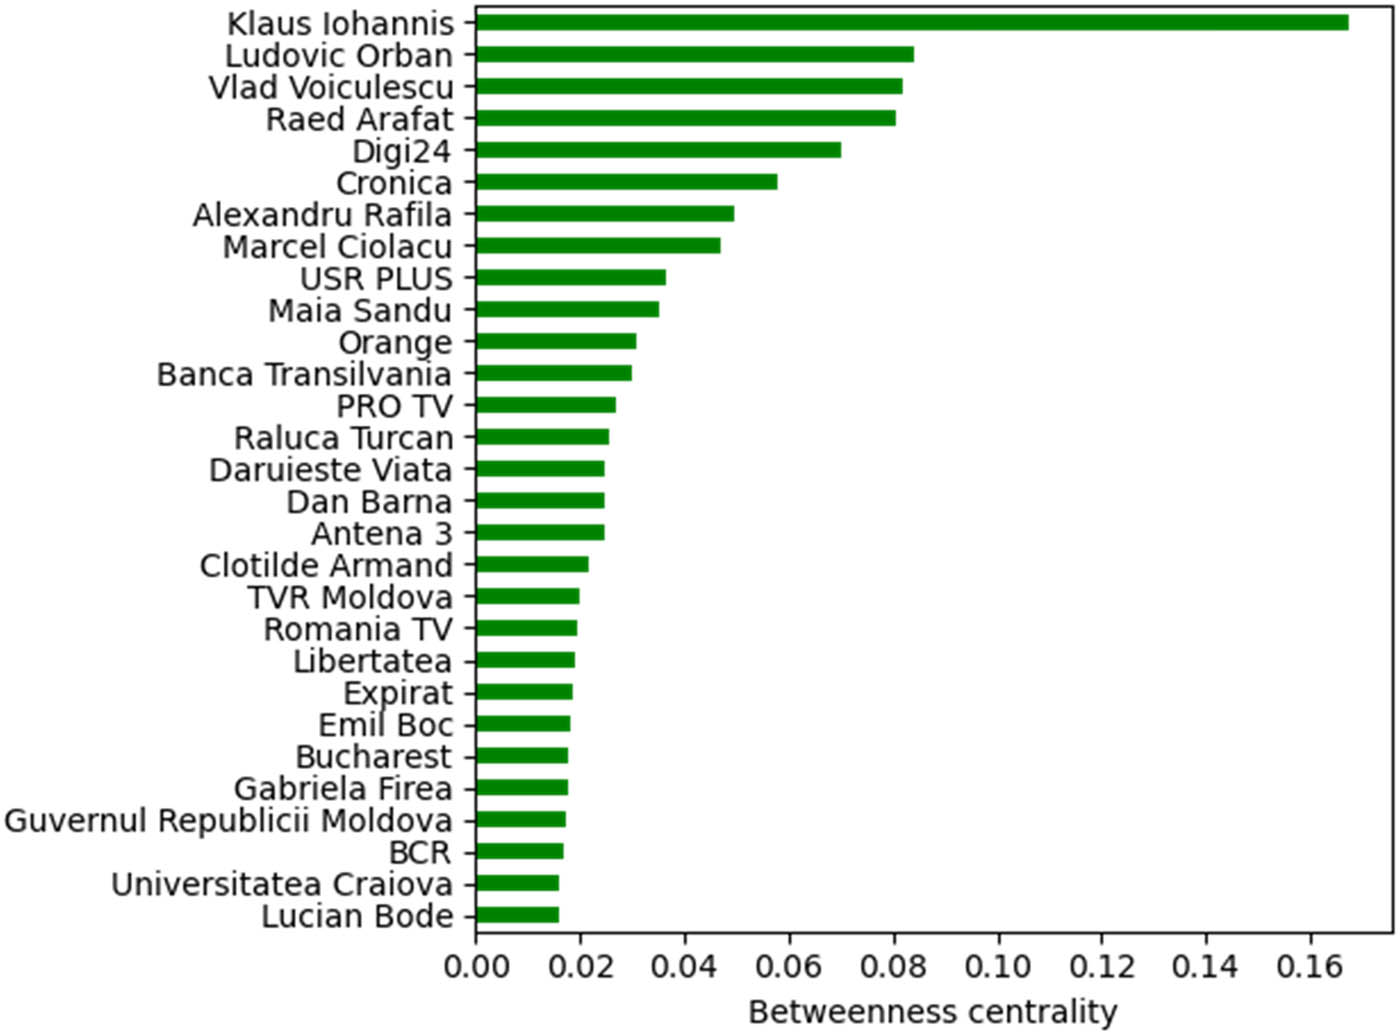
Figure 8
Betweenness centrality, top 30 nodes.
Source: Author’s contribution, https://github.com/QuantLet/Covid-RO/blob/main/SNA/Social Network Analysis.ipynb.
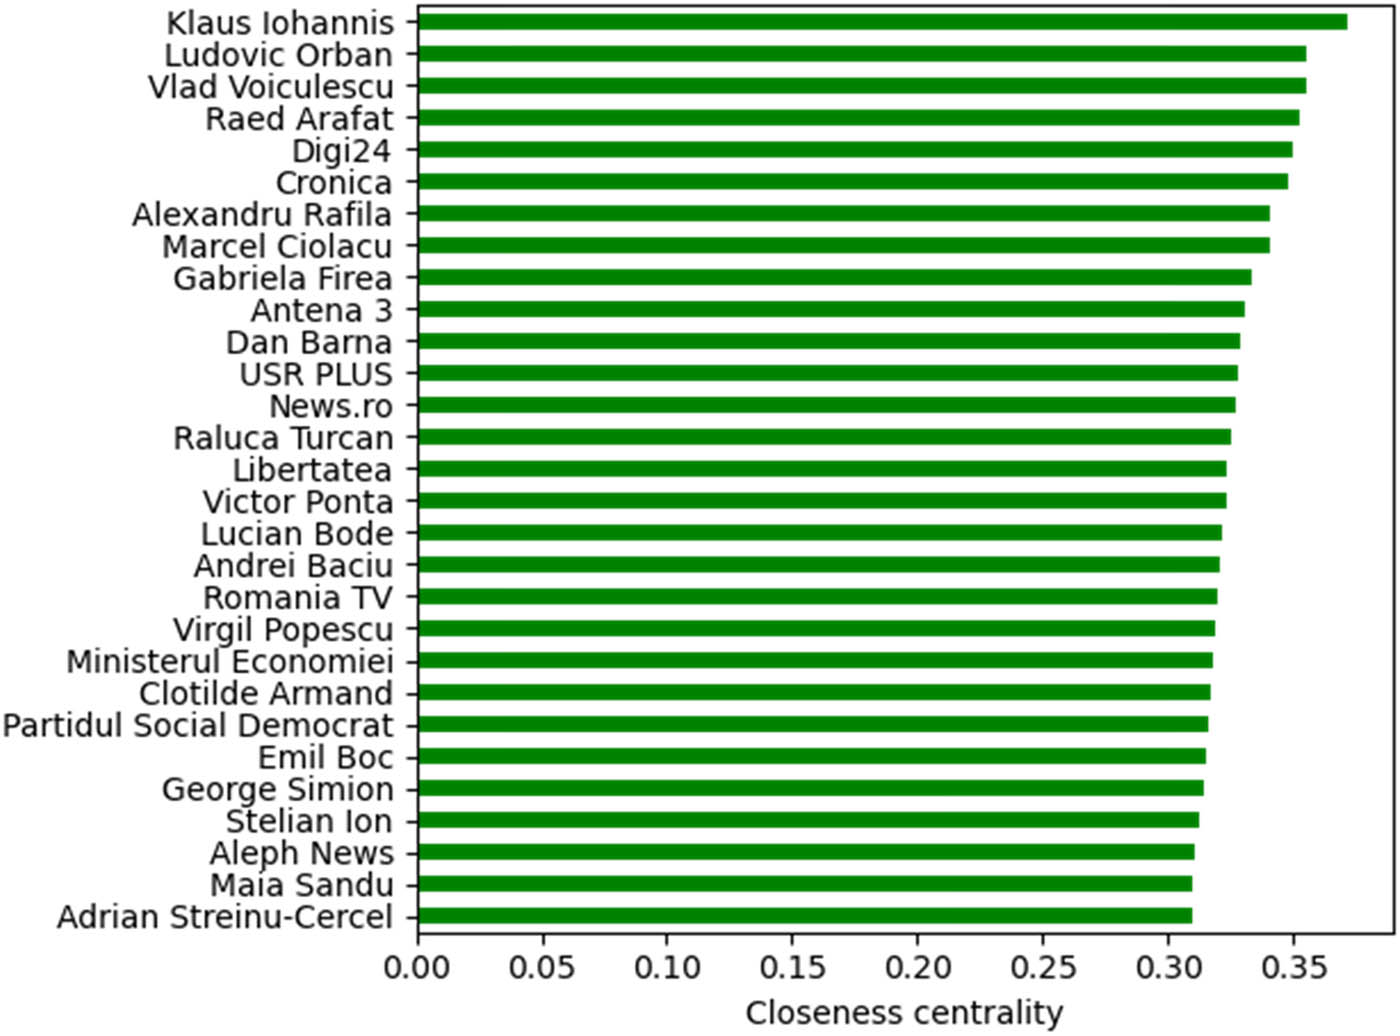
Figure 9
Closeness centrality, top 30 nodes.
Source: Author’s contribution, https://github.com/QuantLet/Covid-RO/blob/main/SNA/Social Network Analysis.ipynb.
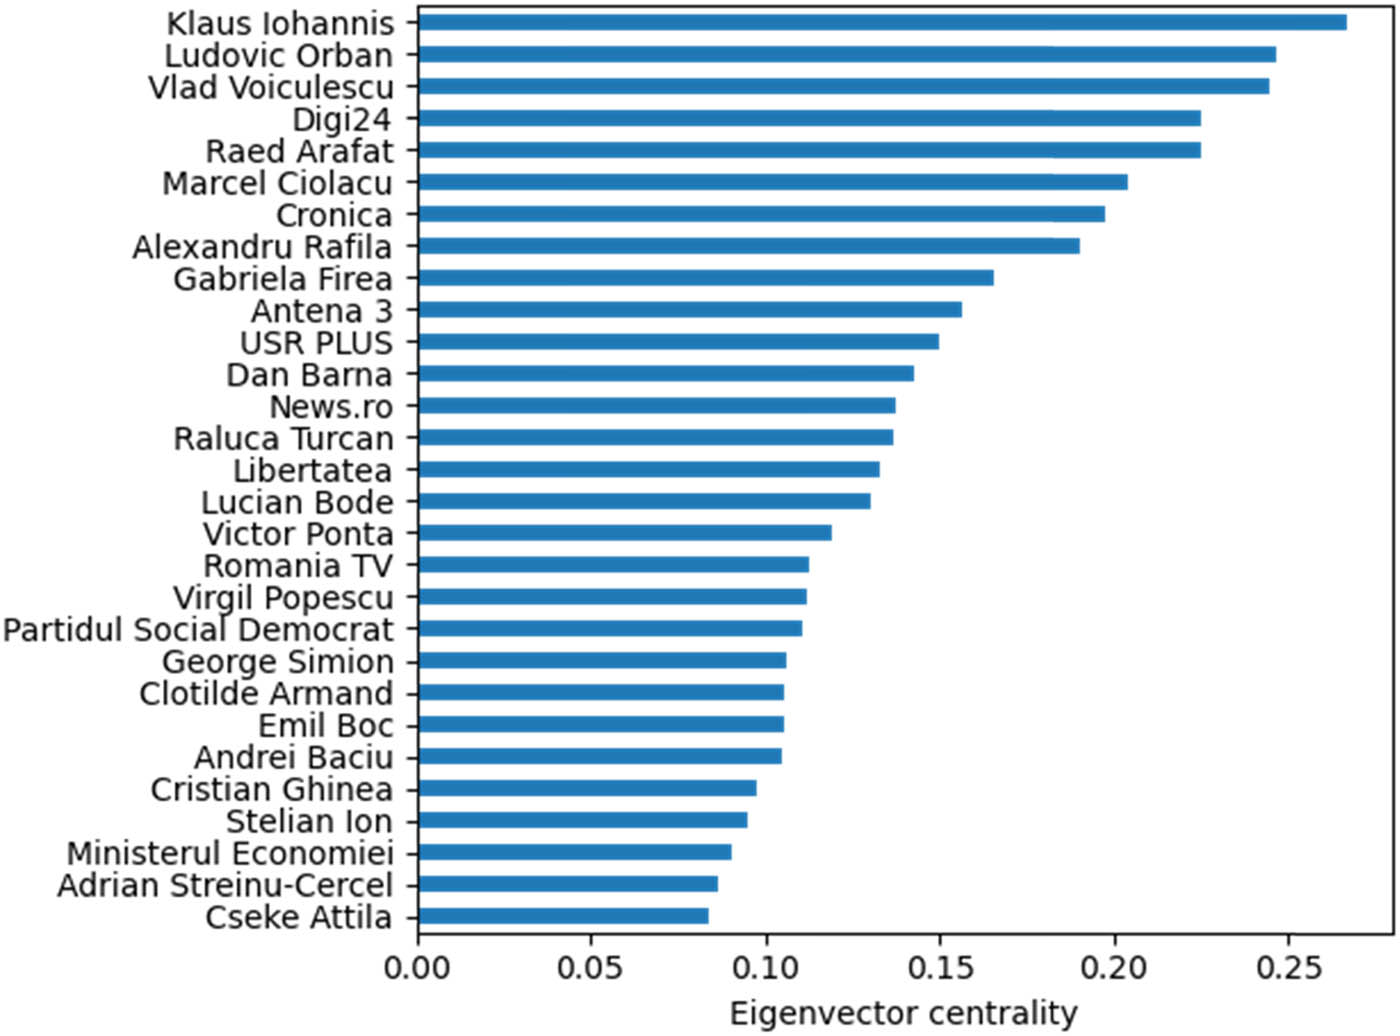
Figure 10
Top 30 eigenvector centrality scores.
Source: Author’s contribution, https://github.com/QuantLet/Covid-RO/blob/main/SNA/Social Network Analysis.ipynb.