
The number of studies on landscapes and tourism (Kulczyk & Woźniak 2022) and the sensory dimension of the tourism experience is growing. Despite this interest, empirical research on this issue remains limited (Buzova et al. 2021). The senses of touch, sight, sound, smell, and taste are underrepresented in the research conducted within the scope of the social sciences, although some attention has been given to the senses of sight and sound.
The most influential concept related to this issue is Urry’s “Tourist Gaze”, in which he claimed that tourists are directed towards features of the landscape, focusing on seeing as a visual practice (Urry 1990). In other works, he paid more attention to the mobile and globalized world (Urry 2002); gazing was highlighted as being embodied and multidimensional, and implied other sensescapes (Urry & Larsen 2011; Larsen 2014). A tourist experience involves a broad array of senses that go beyond sightseeing, such as soundscapes, smellscapes, tastescapes, and touchscapes (Kirillova et al. 2014).
Recently, geographers have renewed their interest in the senses through nonrepresentational theory, which highlights the “centrality of the sensing body in theories and practices of space and place” (McCormack 2009). Tourism design and destination development can benefit from sensory-informed experiences. Despite its multidisciplinary nature, few studies on the aforementioned subject have been developed (Agapito 2020). A major question is how to model and map sensescapes to create an attractive product that can attract more visitors to a destination by enhancing the tourism experience through the senses.
Therefore, this study aims to explore the potential of geotechnologies to map sensescapes within the context of tourism. The research objectives encompass the following:
- –
to analyse the potential of smart geographic surveys, dashboards, and mapping within the tourism sector;
- –
to understand how geographic smart surveys can be used to generate a more accurate representation of the environment and to gather sensory attributes;
- –
to illustrate the spatial distribution of intangible territory attributes in a walking journey along the Way of Saint James;
- –
to furnish efficient tools for mapping and assuring realistic management processes within the tourism industry.
This paper is divided into four sections. Besides the introduction, the contributions of smart surveys, dashboards, and online mapping are analysed in the first section, along with a review of the main concepts and studies on sensescape mapping. The primary and secondary sources are highlighted in the methodology section, followed by the main results of the smart survey on sensescapes that was carried out in the Barcelos municipality. Finally, the main conclusions, limitations, and need for further research are presented in the last section.
Smart concepts (smart city, smart tourism, smart transportation) are mainly technological concepts (Mandić & Garbin Praničević 2019). The advent of information and communication technologies and cloud computing has grown very quickly in the last few years (Irannezhad & Mahadevan 2021). Geographic Information System (GIS) technology is growing (Medolińska et al. 2017; Adamczyk & Wałdykowski 2022) and is very useful in tourism planning and management practices (Chen 2007; Absalon et al. 2004), particularly due to the development of the internet of things (IoT), mobile applications (apps), geo-tag services, augmented reality (AR), social media, and smart devices (Ye et al. 2020; Omran et al. 2023).
Even if geotechnologies have been growing very quickly in the last few years, traditional GIS has been confined to desktops due to storage and geoprocessing requirements (Meek et al. 2013). Most traditional GIS is being surpassed by web-based GIS, which is built on a client-server architecture (Kulawiak et al. 2019; Go et al. 2020). Spatial data is stored and processed on the server and is available everywhere by using an internet connection. Data queries, for example, using mobile device applications or dashboards, become more intuitive and dynamic. Moreover, there has recently been growth in the availability of technological devices to collect, analyse, and share in loco real-time data (Jordan et al. 2021). Smartphones and mobile gadgets have transformed the way social scientists collect and analyse data; it is now difficult to separate digital technology from tourism research (Ribeiro 2022).
In this study, we seek to address the lack of in situ research along the Portuguese Way of Saint James by using a smart survey, via GIS mobile applications, to directly collect geospatial data in real time. As was previously highlighted, we are unaware of the existence of any studies developed to collect data via smart survey on a mobile device.
This study used primary sources; our method relies on Geographic Information System Modeling of sensescapes. The primary data used was georeferenced, and the information was collected via mobile smart survey. The geographic survey was developed on the Survey 123 tool. This survey was created to collect data on the five senses along the Way of Saint James, with a particular emphasis on the section that runs through Barcelos, a municipality in north-western Portugal. This means conducting a local assessment of the landscape along 34 kilometres. Two researchers involved in the project performed this task (one adult man and one adult woman), collecting the data with an app and using GIS tools for spatial analysis. The results obtained from the analysis of the input from the two observers of the landscape showed that they complemented each other.
The Survey 123 application was developed for real-time data collection. Three main information groups were set up, encompassing a total of 41 attributes:
- (i)
context (3 attributes): date and time, atmospheric conditions, and photographs;
- (ii)
facilities and geoinformation on the main facilities available for pilgrims to use (16 attributes): coffee shop, restaurant, supermarket, accommodation, pharmacy, church, chapel, wayside shrine, stone cross, picnic park, fountain – with potable water, non-potable water, or without information, toilet, recycling points, and rubbish bin;
- (iii)
information on the individuals’ senses impacted along the path (22 attributes):
Sight: forest, agriculture, bucolic landscape, dispersed houses, concentrated houses, and built environment;
Smell: atmospheric pollution, scent of floral elements, smell of animal waste, or food smells;
Sound: vehicle noises, pet sounds, sounds of birds or other wild animals, sound of running water, people talking, pilgrims socializing, and silence;
Taste: food and supermarket (coffee, wine, juice, pastry, typical gastronomy, fast food);
Touch: dirt road, footpath, asphalt, and water.
All the data collected was consistently coordinated through the electronic collecting systems used.
Finally, a spatial analysis was performed using the Geographic Information System. The ArcGIS Pro software was used, namely the geoprocessing tool, to produce raster maps identifying the concentration of senses over the space. Traditionally, researchers use the Kernel density tool for location measurements. More recently, heat maps are being used to express concentrations of measurements that cannot be measured by density (Ke et al. 2021). In tourism, few studies have been done using this cartographic method (Jordan et al. 2021). To examine the geospatial distribution of each sense, heat maps were produced to visualize the hottest areas, which were the ones with the most point features. The magnitude of the values is expressed by the intensity of the colour.
Sensescapes were categorized according to the five human senses: sight, smell, taste, sound, and touch (Table 1).
Categories introduced in the smart survey
| 1: Context | 2: Facility | 3: Five Senses | |
|---|---|---|---|
| Date and Time | Coffee shop | Vision | Forest |
| Atmospheric conditions | Restaurant | Agriculture | |
| Photographs | Supermarket | Bucolic Landscape | |
| Accommodation | Scattered Houses | ||
| Pharmacy | Concentrated Houses | ||
| Church | Built environment | ||
| Chapel | Olfaction | Atmospheric pollution | |
| Wayside shrine | Scent of flora elements | ||
| Stone Cross | Smell of animal waste | ||
| Picnic park | Food smells | ||
| Fountain: potable | Sound | Vehicle noises | |
| non-potable | Pet sounds | ||
| without information | Sounds of birds or other wild animal | ||
| Bathroom | Sound of running Water | ||
| Rubbish bin | People talking | ||
| Information signs | Pilgrims socializing | ||
| Silence | |||
| Gustation | Food and supermarket (coffee, wine, juice, pastry, typical gastronomy, fast food) | ||
| Tactile perception | Dirt road | ||
| Footpath | |||
| Asphalt | |||
| Water | |||
Source: own elaboration
The smart survey allows for the combination of information from the two groups. If, for example, the user is collecting information and has chosen a facility, only information on facilities will be shown in the second step. If the user chooses a particular sense, information related to each sense will be available in the second step (Figure 1).
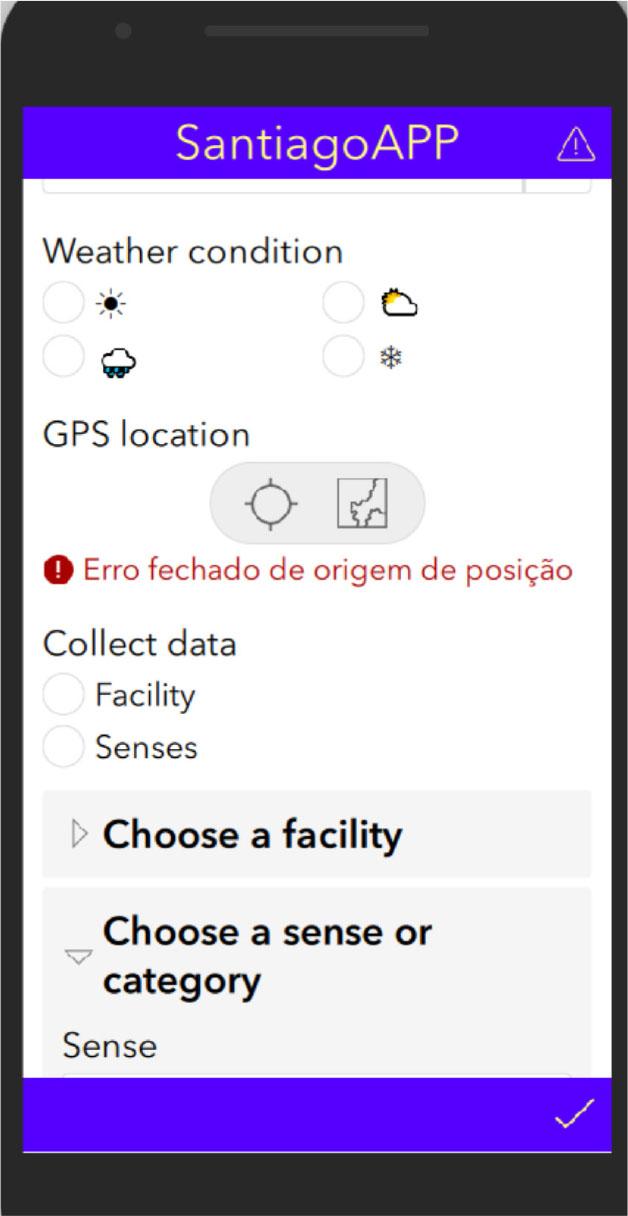
Layout of the App SantiagoAPP
Source: own elaboration
Due to the theoretical research gaps identified, this paper seeks to understand the potential of digitalization to collect sense attributes of landscapes by using smart geographic surveys. Here, technology plays a very important role since it allows us to collect qualitative in loco landscape attributes based on a previous categorization. A geodatabase was developed to perform a spatial analysis and visualize the collected data saved in the cloud. It included alphanumeric data and media data such as photographs. The collected data was uploaded in real time to an online database. Geodata contributed towards online performance, and desktop GIS analysis, using more recent algorithms, was used to model and share useful maps for planning.
The results obtained contribute to research on the five senses and tourism experiences, particularly by using an app built using smart survey (Survey 123) to collect images and qualitative landscape attributes. This method can help in religious tourism planning; in our study, it adds value to the Portuguese Way of Saint James.
The smart survey that was developed allowed researchers to collect 256 (58%) attributes of the five senses and 166 facilities. The main facilities collected were coffee shops, followed by information signs and religious objects (stone crosses and churches). This is due to recent investments in signalling the Way following an increase in the number of pilgrims who walk it (Figure 2).
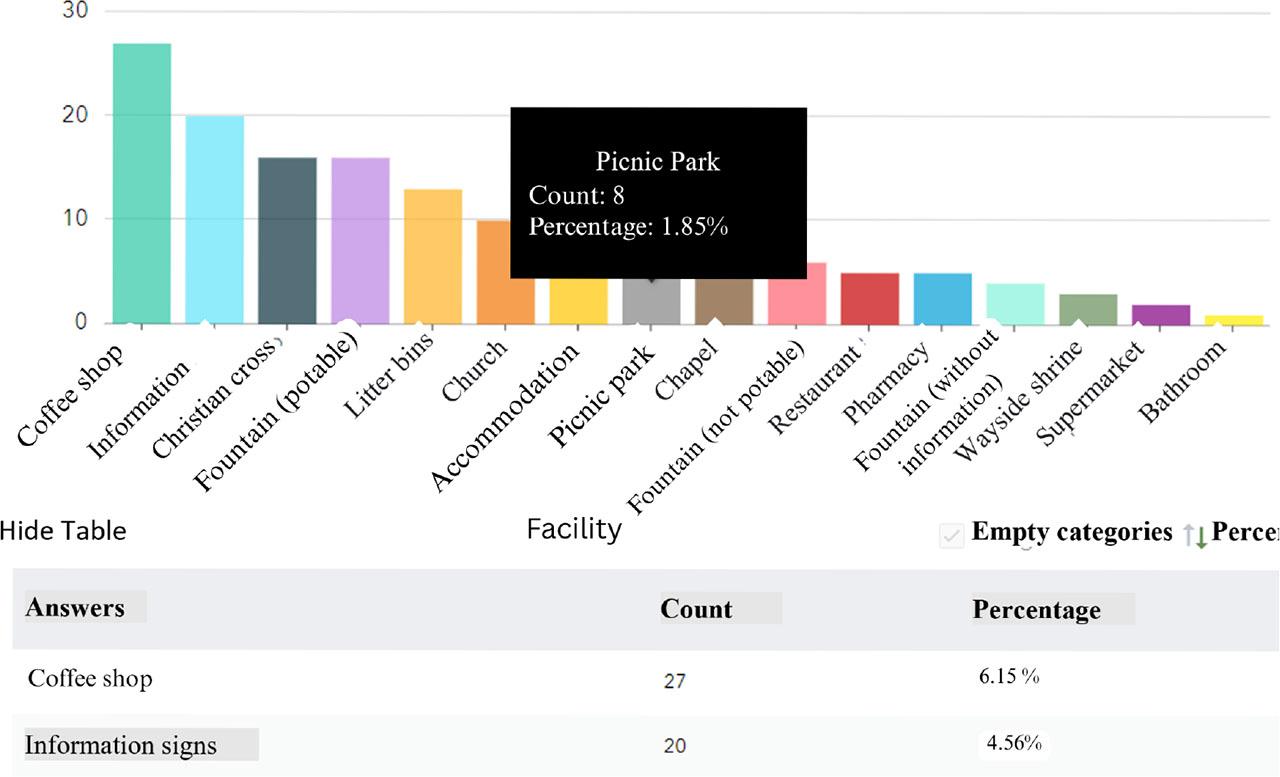
Screenshot of the web application showing the main facilities located near the Way of Saint James in the Barcelos municipality
Source: own elaboration
According to the adopted methodology, the section of the Way that was analysed is dominated by the senses of hearing and vision (44%), followed by tactile perception (12%) (Figure 3). On the other hand, taste is not a very common sense along this path. The annual increase in the number of pilgrims should have an economic impact by attracting services close to the path; however, that has not yet happened. For the kind of tourist who uses walking or cycling as modes of transportation, knowing distances and other information are crucial in order to know where those services are located.
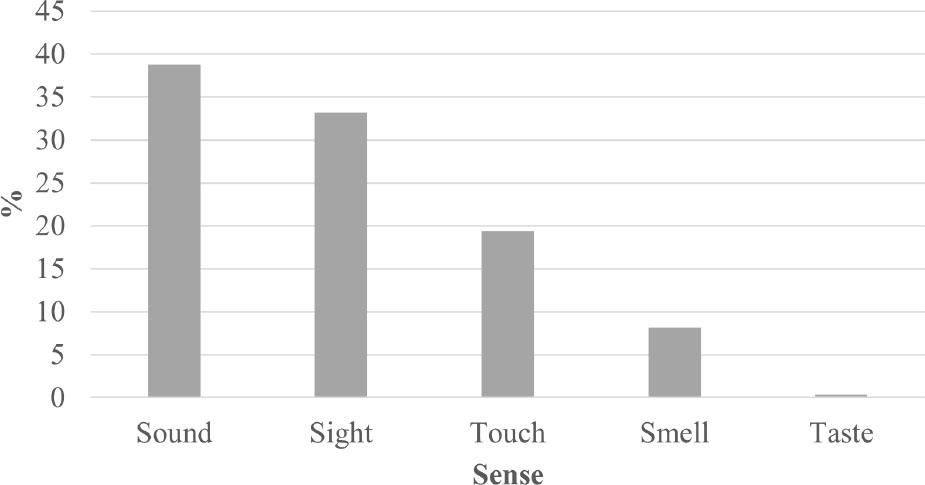
Main sensescapes on the Way of Saint James in the Barcelos municipality
Source: own elaboration
The main characteristics of the surroundings are the sounds of birds and other wild animals due to the rural characteristics of the path, which features significant forested and agricultural areas. Sound is of great interest for relaxation, especially the sound of running water (Figure 4). This is a major characteristic of the path. In contrast to these relaxing sounds, the asphalt roads and vehicle noises create the worst conditions for walking, particularly in the summer when the discomfort caused by high temperatures tends to increase greatly (sometimes up to 35°C). In this part of the Way, pilgrims encounter roads with a lot of traffic, thus increasing the risk of being involved in an accident. The path is also characterized by cobbled parts, which enhances the tactile and visual characteristics. This is particularly true in rural areas with historic houses.
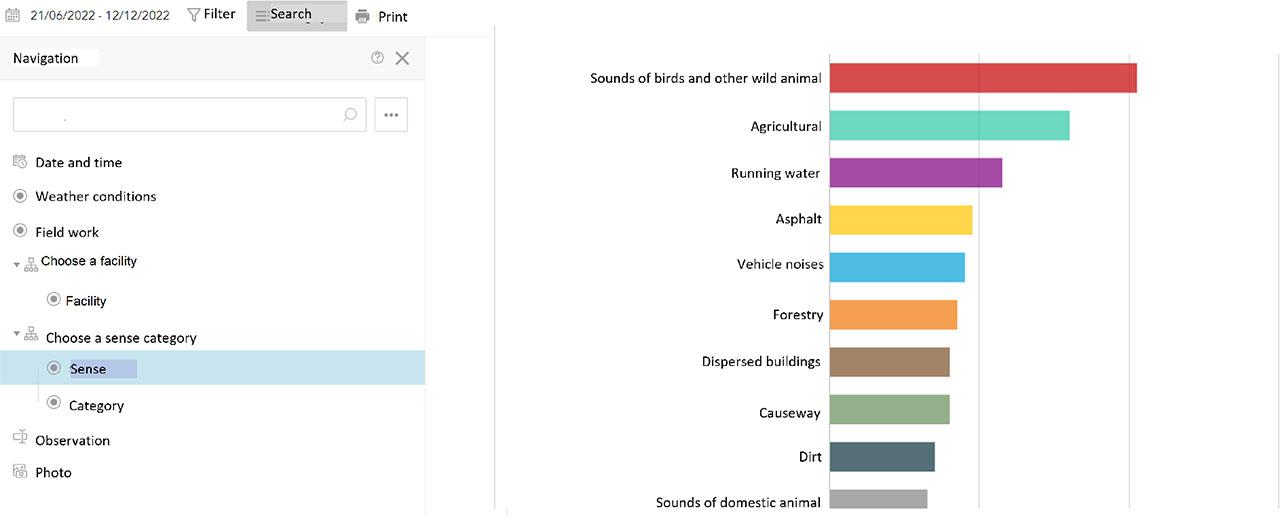
Screenshot of the web application showing the main characteristics of the senses surrounding the Way of Saint James in the Barcelos municipality
Source: own elaboration
Geographic data on the senses and facilities can be easily visualized in the linked dashboard (Figure 5). It is very useful and enables users to convey information, highlighting the main characteristics of the data and, at the same time, presenting location-based analytics through maps, pictures, or graphics in a single intuitive screen.
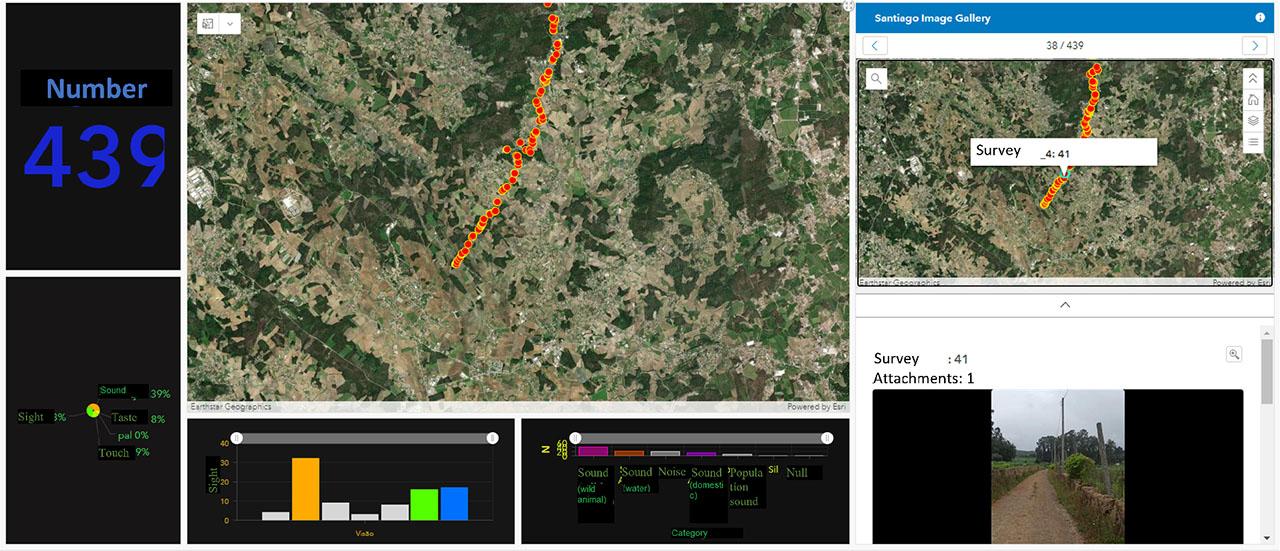
Screenshot of the dashboard layout of the Way of Saint James in the Barcelos municipality
Source: own elaboration
The dashboard allows the researcher to consult the collected data quickly and easily, and to analyse the graphics or text information on any geolocated feature. Pictures are very relevant when doing research; they can help in explaining the mapping of the senses. They provide a way for researchers to revisit the places. Using the collected data on the senses, five heat maps were produced to analyse their geospatial distribution (Figure 6).
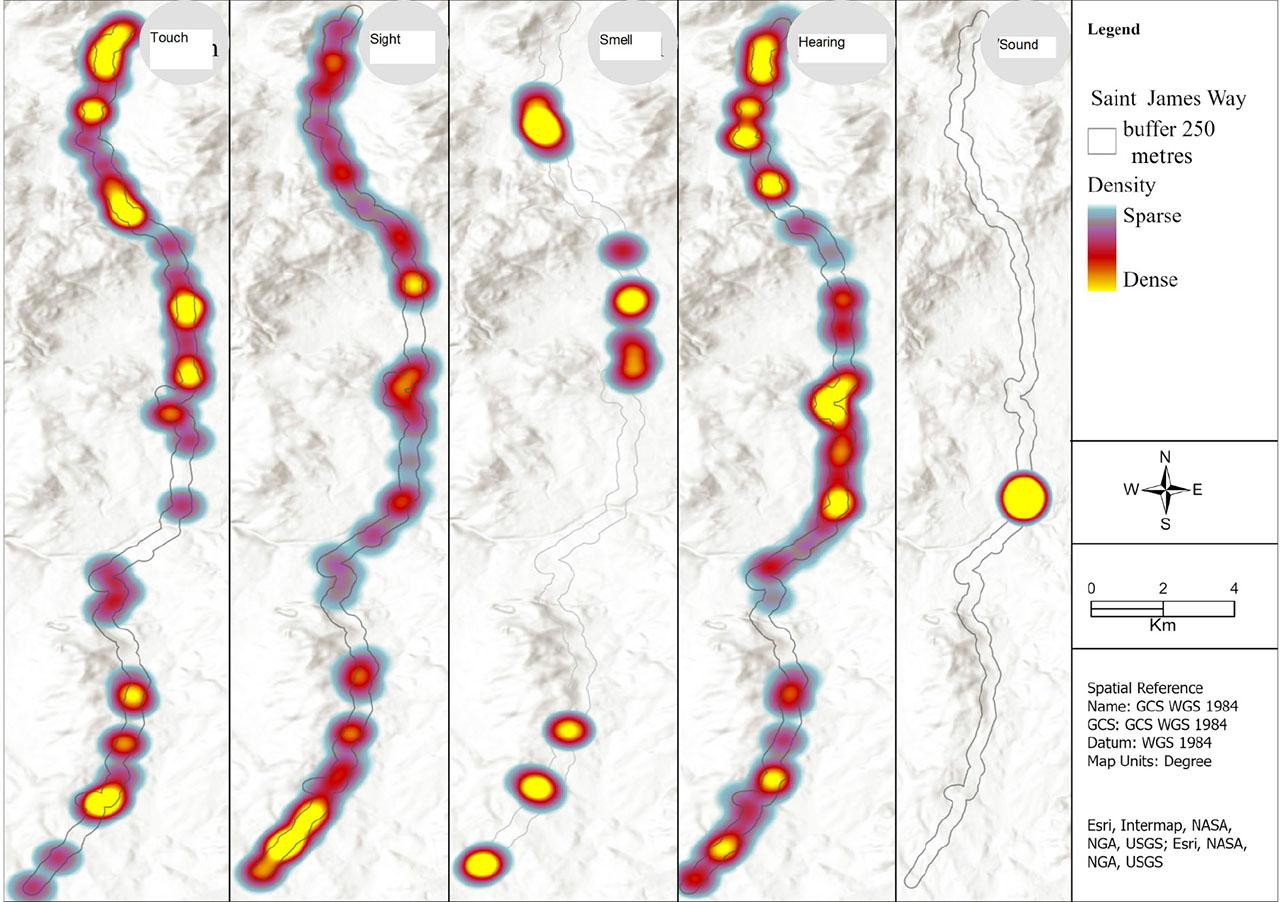
Geospatial distribution of the hottest areas, by predominant sense, in the part of the Way of Saint James located in the Municipality of Barcelos
Source: own elaboration
A buffer of 250 metres around the centreline was built for better perception of the context of the pathway. To visualize the areas where the concentration of the point features is the hottest, we used the heat map method as a means of representation. It displays the relative density of points as raster visualization. This territory has an asymmetric distribution of the senses along the path.
The senses of touch and hearing are the most present in this territory. This is due to the frequent contrast of landscape and surroundings, shifting between natural, semi-urban, and urban landcover. A pilgrim will feel different sensations when walking, since there are frequent changes of pavement, such as dirt, causeway, or asphalt (Figure 7).
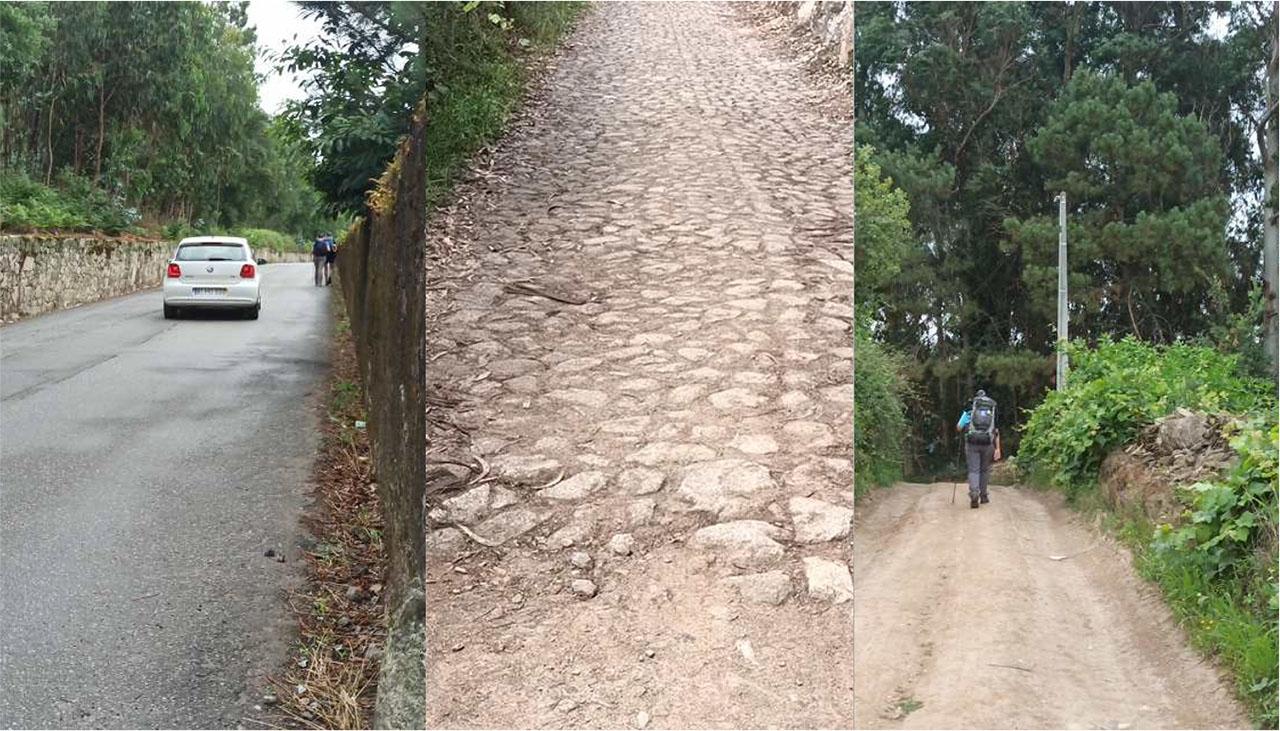
Photos of different pavement contexts of the Way of Saint James in the Barcelos municipality that affect the sense of touch
Source: own elaboration
The different landcovers and rapid changes in the Way also influence the sense of hearing, and the sounds of wild or other animals, running water, people talking, or vehicles can be heard (Figure 8). The map shows that sight is more representative at the south-western part of the Way. Despite fewer features, the pilgrim will have the opportunity to experience different and rich landscape contents when walking along the path. On the other hand, the sense of smell is very concentrated in some clusters along the path. This predominates when walking in rural areas, where domestic animals are raised, and where flowers, trees, and even corn cultures can be found, with their corresponding odours. It is difficult to understand the weak presence of the sense of taste given the importance of this route and the increasing number of pilgrims, especially as the rise in the number of walkers should have already created more economic dynamism. Pilgrims must walk a long way until they reach restaurants or coffee shops, which are mainly concentrated in the urban centre.
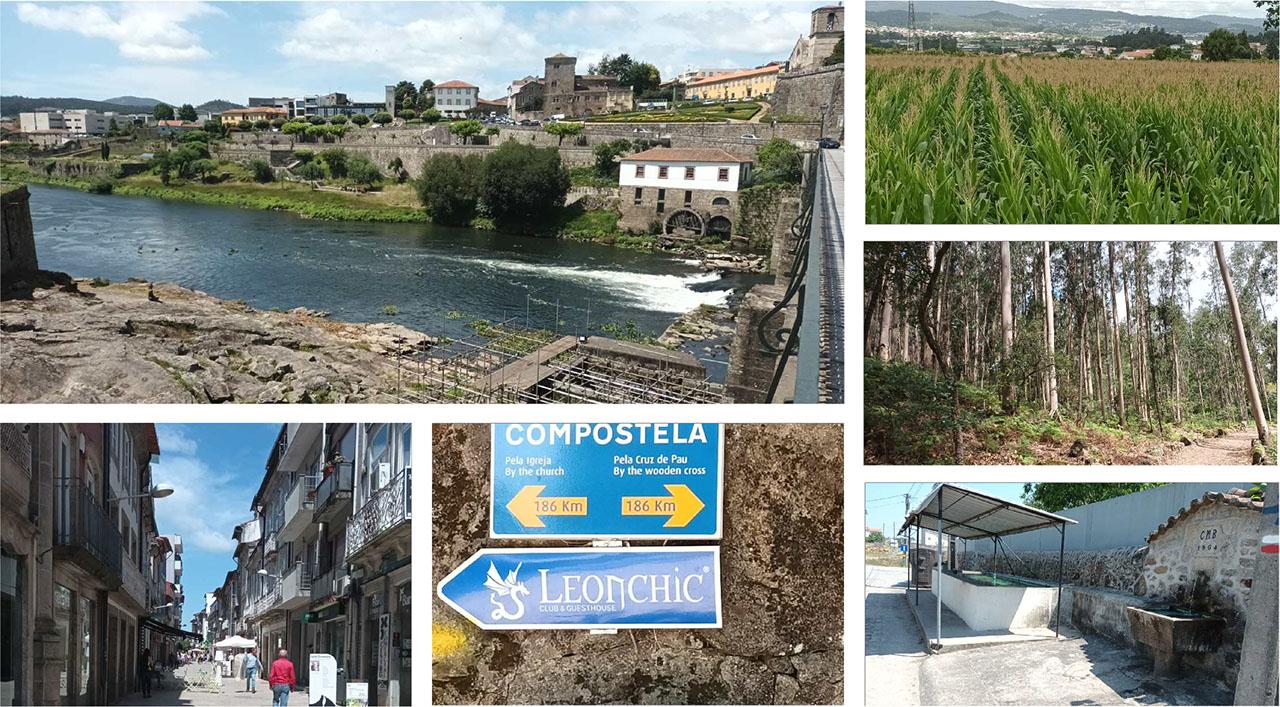
Photos of different landscape contexts of the Way of Saint James in the Barcelos municipality that affect the senses of hearing and sight
Source: own elaboration
This paper has brought an innovative contribution by integrating sensescapes into tourism planning through the enhancement of the potential of smart geographic surveys, dashboards, and mapping. It sought to introduce a methodology that uses technological tools to enhance research on sensescapes, using mobile devices and GIS.
It was demonstrated how a geographic smart survey can be used in a research context to produce a more realistic picture of the surroundings and to collect attributes of the senses, visualize them through a dashboard, and analyse them using GIS tools. This method can be replicated in other territories. Local and regional authorities can apply for European funds to apply this method on long routes. It can help local planners to provide spaces with convenient facilities to accommodate religious tourism pilgrims. It also contributes towards marketing the route according to the predominant sense, thus creating an opportunity to attract new visitors according to their main areas of interest (e.g. landscape for photography lovers).
Although we have highlighted the advantages and advances, our research has a few limitations. First, the observers’ profile can influence the selection of attributes or variables and the way they collect the data on the observed landscape. In fact, the researchers could confirm that walkers have different motivations for following the Way of Saint James, and different pilgrims’ profiles can influence the analysis of the landscape. Some do it alone and others in a group; some walk slowly and others in a hurry. Second, overcoming the issue of seasonality is challenging – the landscape changes throughout the year and researchers must deal with changes in climate. Future research could potentially incorporate the global context, such as sunny, cloudy, or rainy conditions.
A visual analysis through heat maps allows users to detect regularities and anomalies in their territory. Sense heat maps were studied by using technology to map the senses. This is a great contribution to align technology and the senses in an unusual way. It is also a great contribution for planners less familiar with the complexities of the GIS tool of representation. Despite all of this, accuracy and efficiency are maintained, and results are made available to help make decisions in the tourism industry. The adopted methodology can help in the decision-making process, regarding the development and promotion of new tourism products, such as those based on exploring sense perceptions.
Future research can try to increase the number of variables that can be considered for each sense. Additionally, a more holistic approach to landscapes can be made – for example, using categories related to sight besides the one listed (bucolic landscapes: traditional landscapes and non-traditional landscapes). Also, in the case of the sense of smell, the floral elements can also be identified, since some of them can have a relevant impact on the assessment of the Way of Saint James, such as the smell of eucalyptus, wattle, or acacia.