
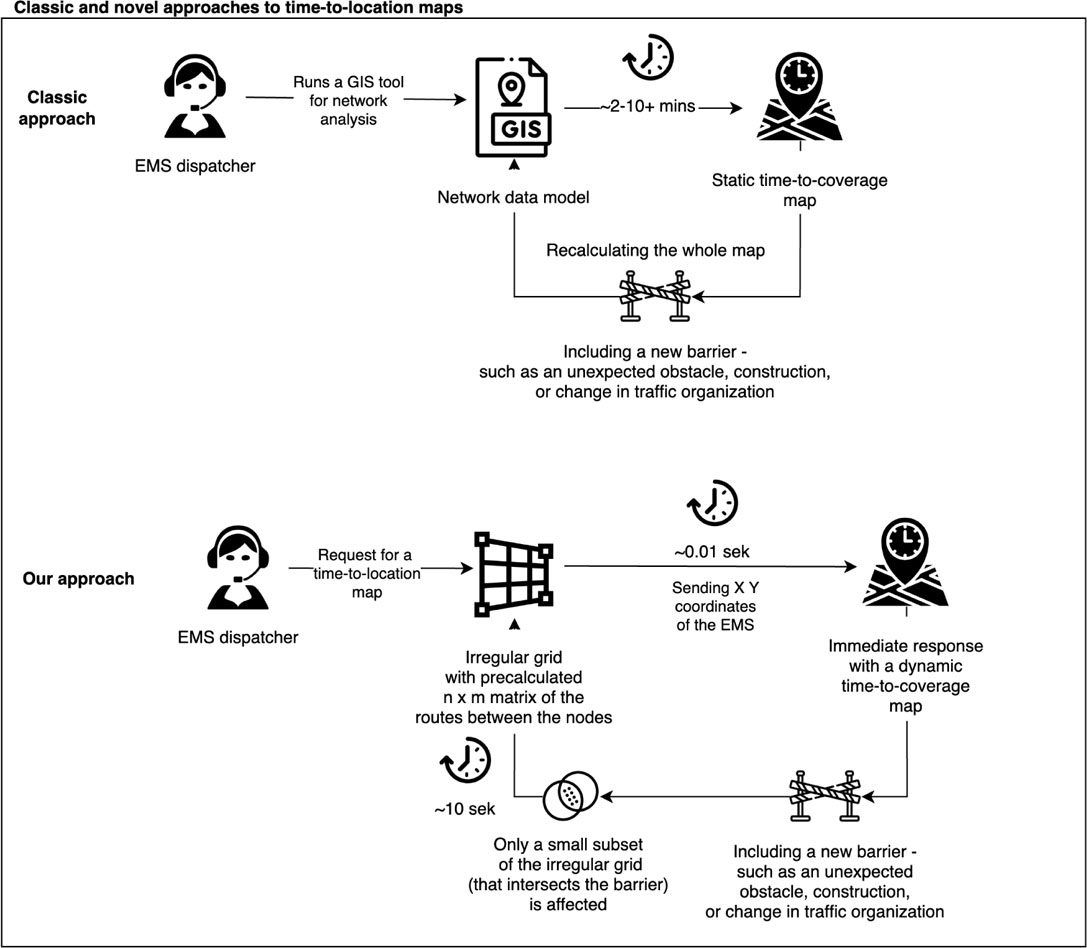
Figure 1.
A schematic comparison of traditional methods for generating static time-to-location maps. This shows isochrones of travel time within a given area, and the approach proposed by the authors, which enables dynamic real-time generation of such maps
Source: own elaboration
Table 1.
Average search time of the distributed dataset depending on the total number of routes stored
| Route Count (mln) | Time (s) |
|---|---|
| 0.5 | 0.7 |
| 1.0 | 1.1 |
| 1.5 | 1.4 |
| 2.0 | 1.8 |
| 2.5 | 2.2 |
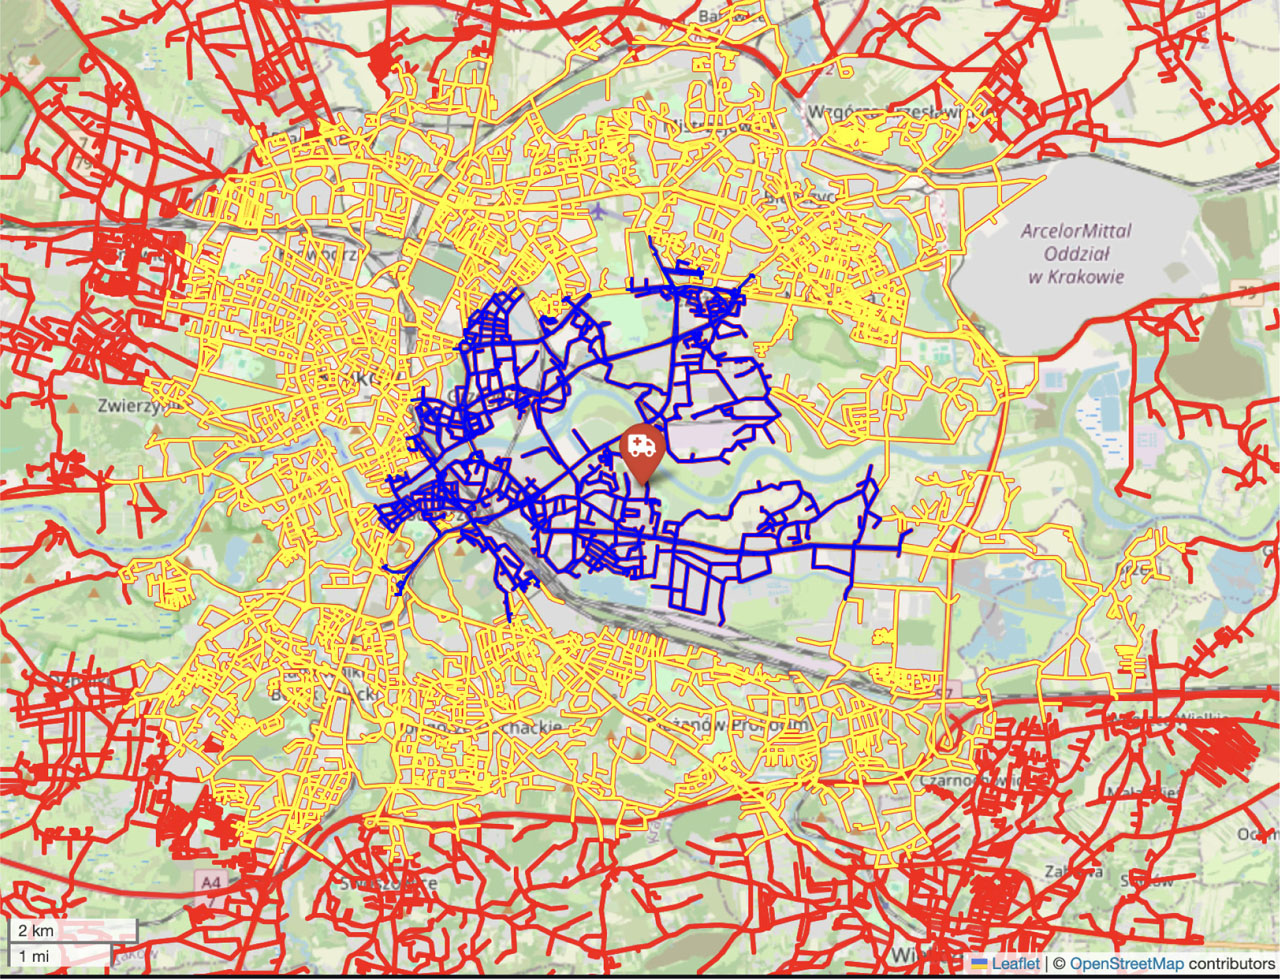
Figure 2.
Temporal coverage map for an ambulance in the centre of the blue area. Blue 5 min, green: 10 min, red 15 min
Source: own elaboration
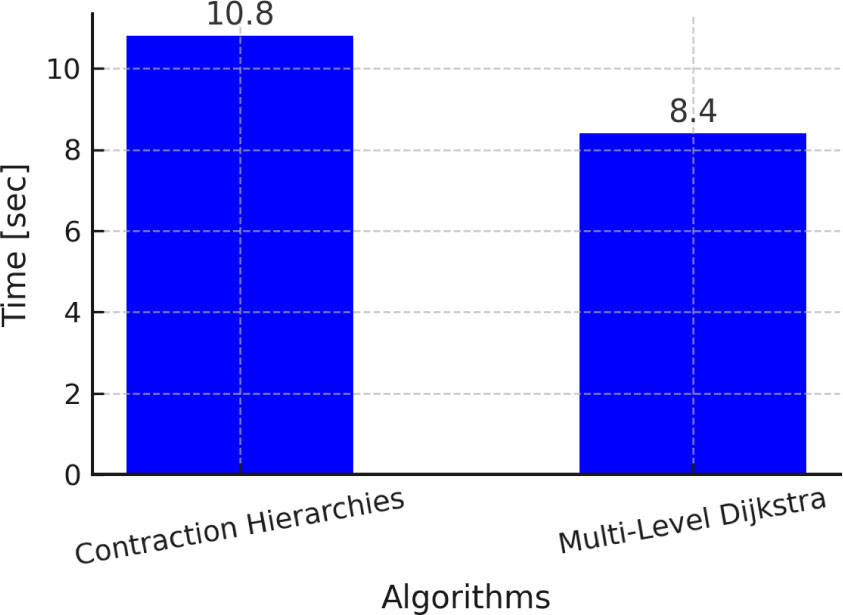
Figure 3.
Average time for downloading and saving routes depending on the route determination algorithm used
Source: own elaboration