
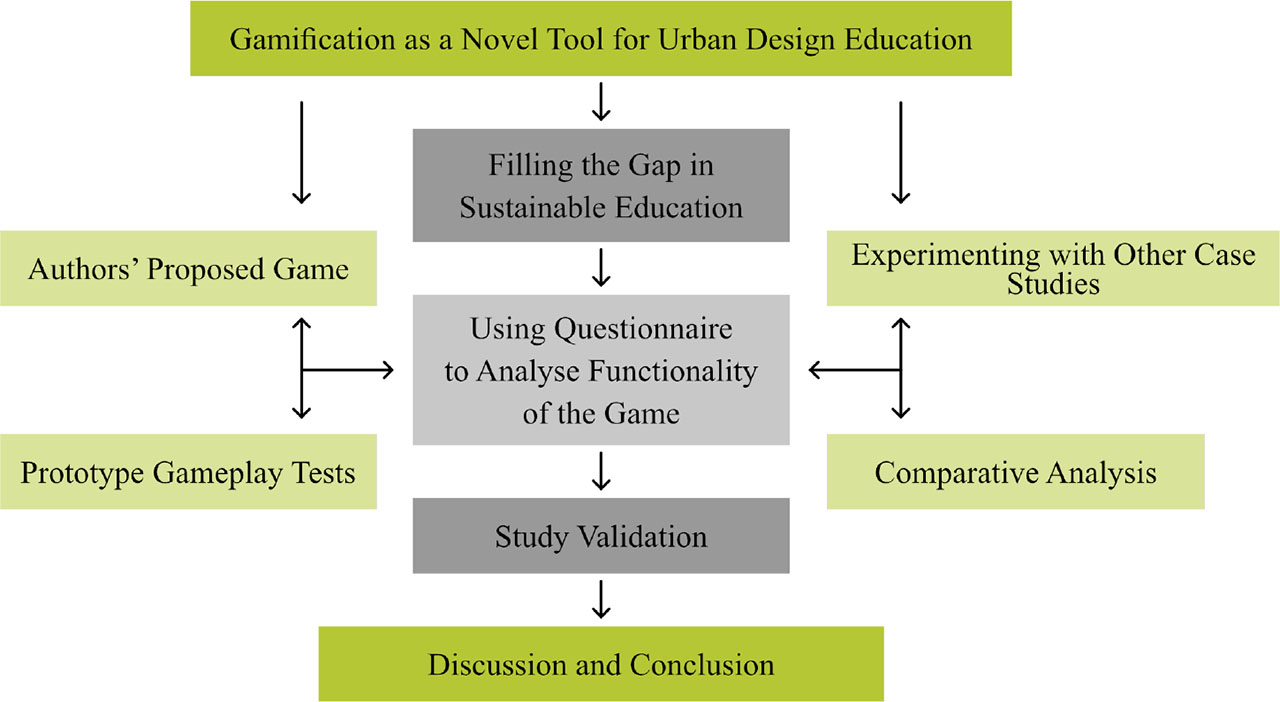
Figure 1.
A diagram of the interrelationships between the issues addressed in the article and the research methods
Source: authors
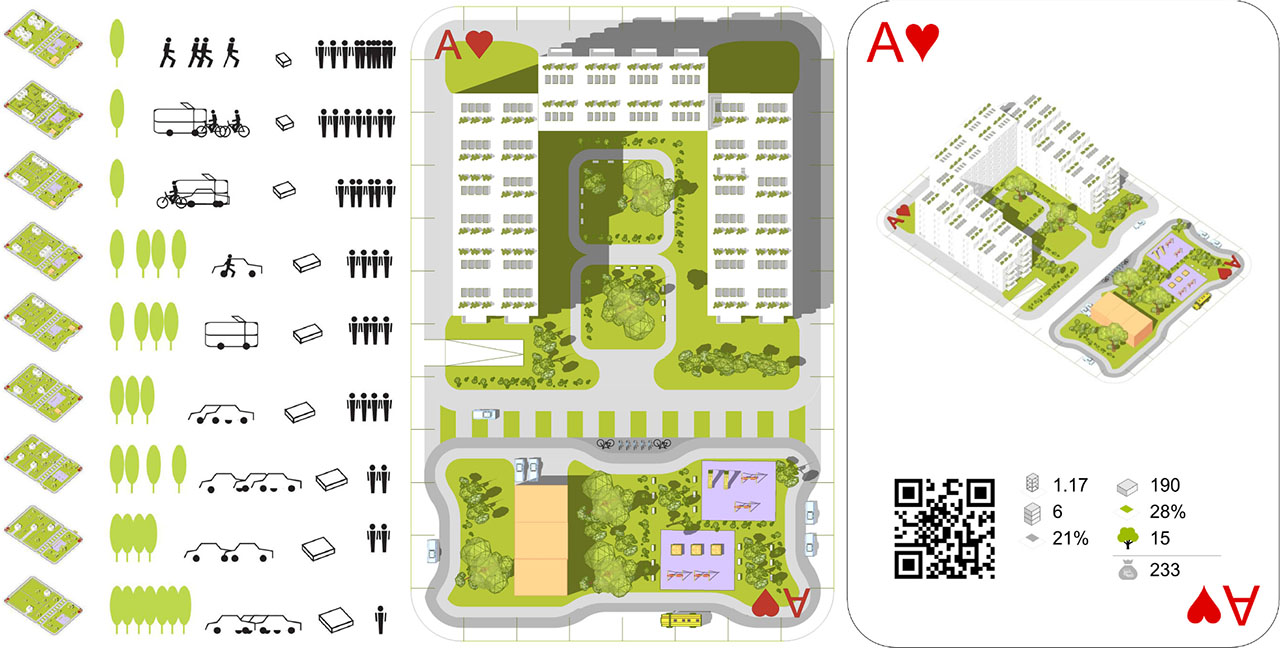
Figure 2.
(A) Diagram showing the density of the increases in development and the change in the indicators' values: number of trees, size of dwelling, type of communication, and population density. (B, C) Ace of Hearts card: from the 2D deck (B) and 3D deck (C) Source: Bradecki et al. 2024
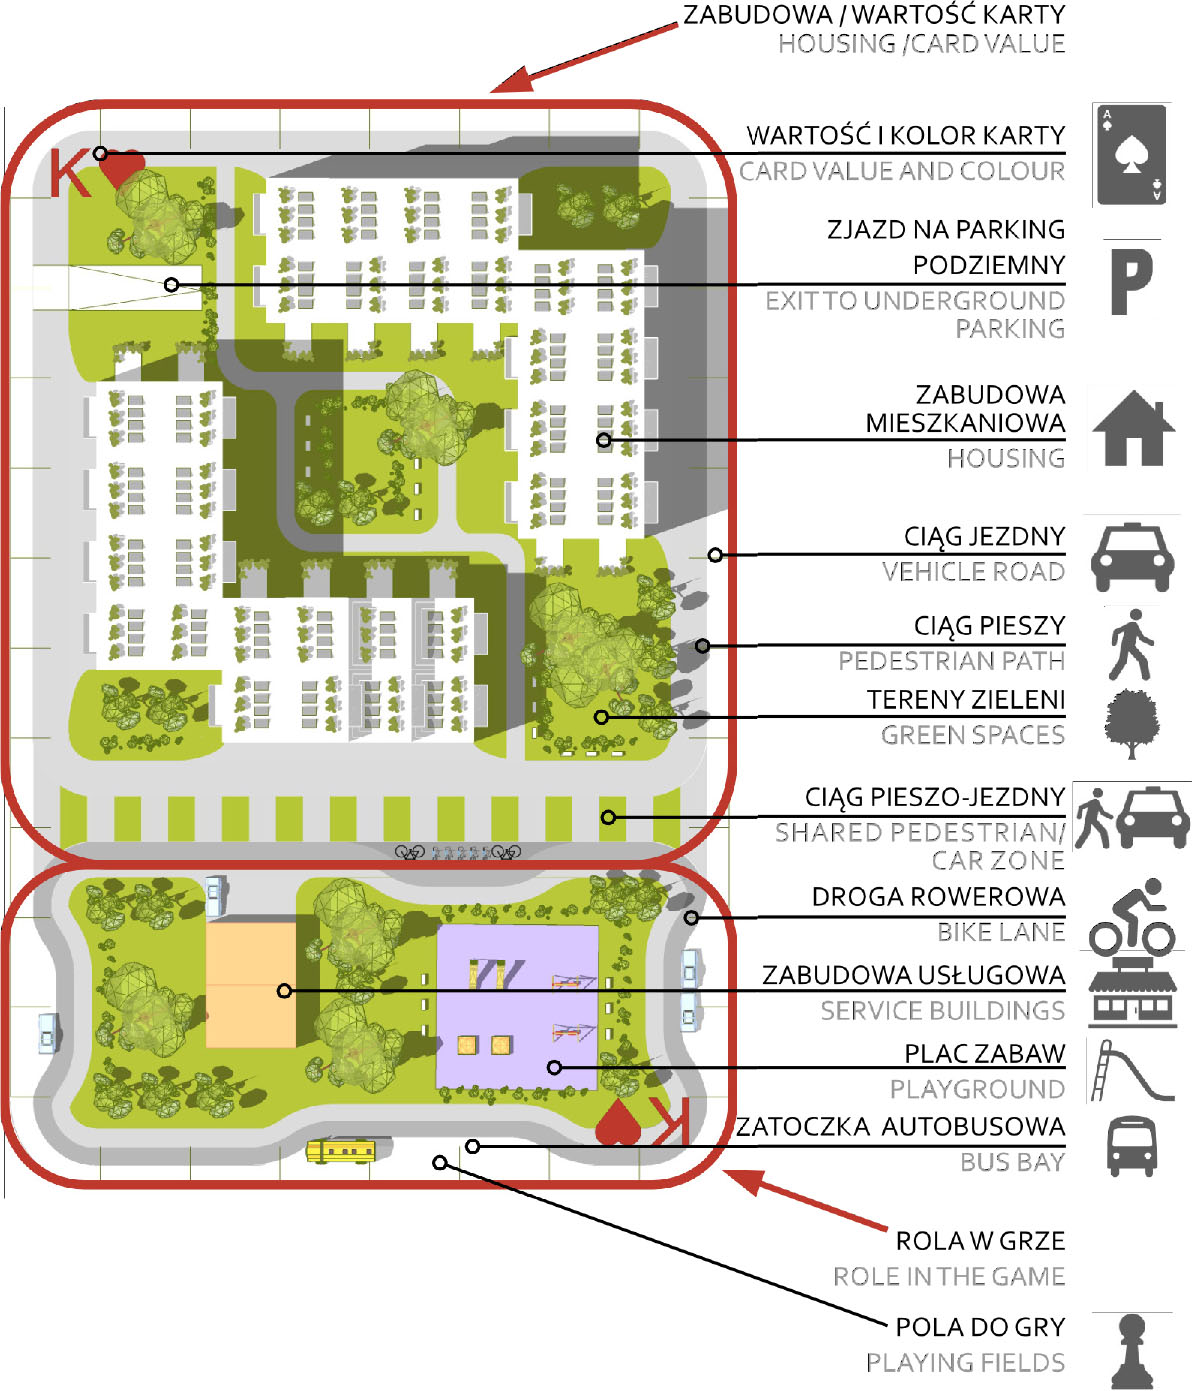
Figure 3.
Elements and content of the cards with explanations
Source: Bradecki et al. 2024
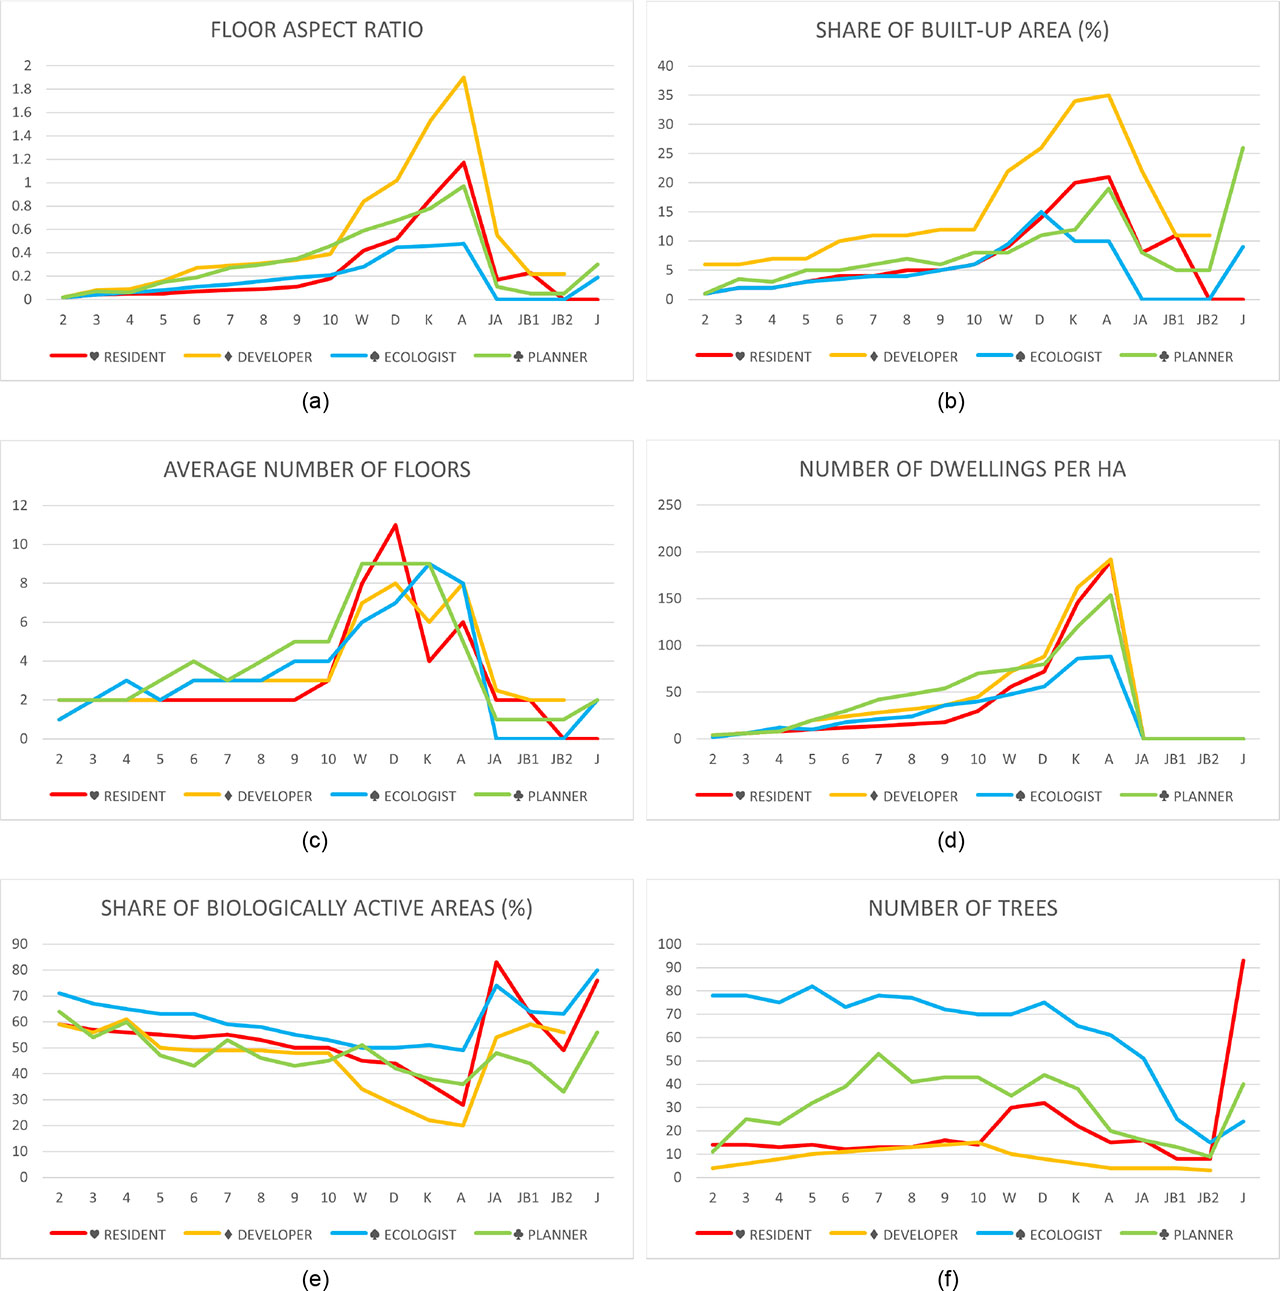
Figure 4.
(A) FAR index graph, (B) Building area percentage ratio graph, (C) Average number of storeys graph, (D) Number of dwellings graph, (E) Biologically active area percentage ratio graph, (F) Number of trees graph
Source: own study, Bradecki et al. 2024
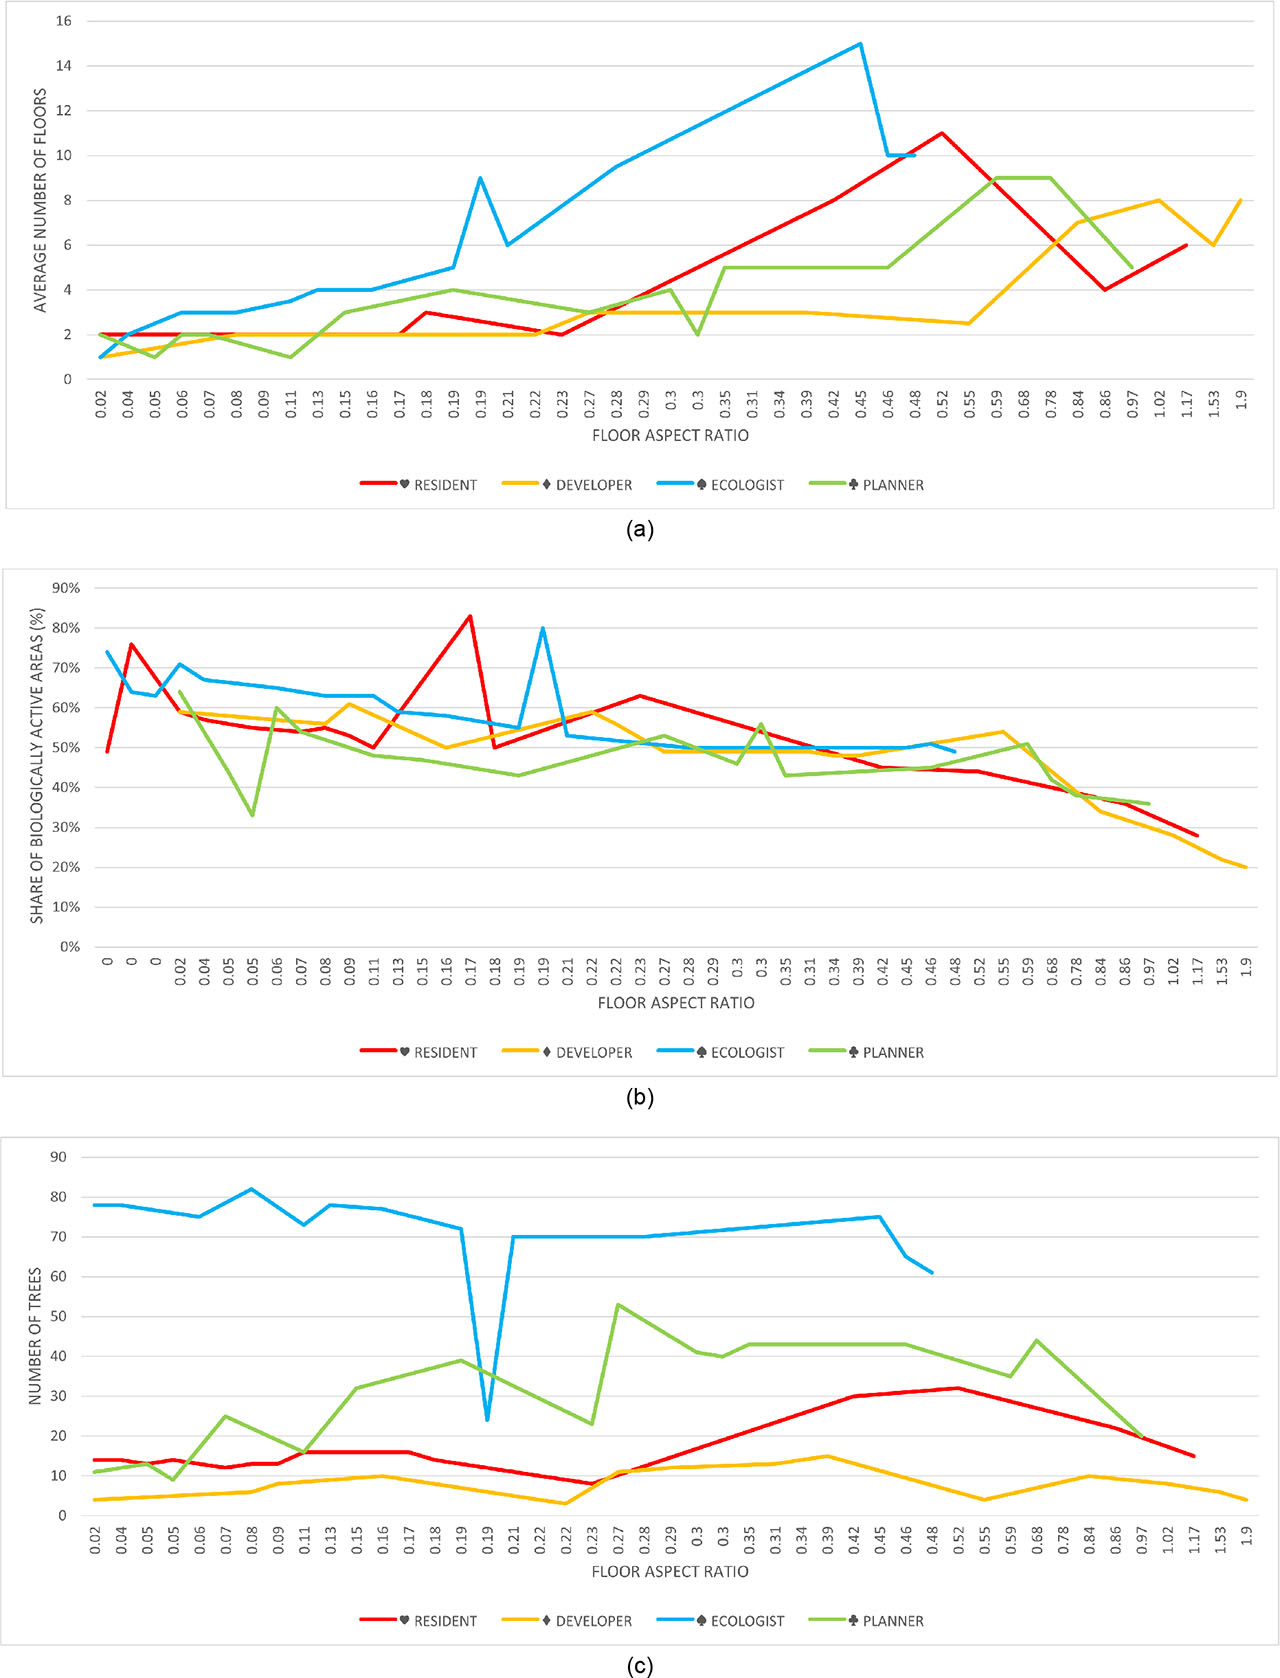
Figure 5.
(A) Graph showing relationship of FAR to floor aspect ratio, (B) Graph showing relationship of FAR to percentage of biologically active area, (C) Graph showing relationship of FAR to number of trees
Source: own study, Bradecki et al. 2024