
Figure 1
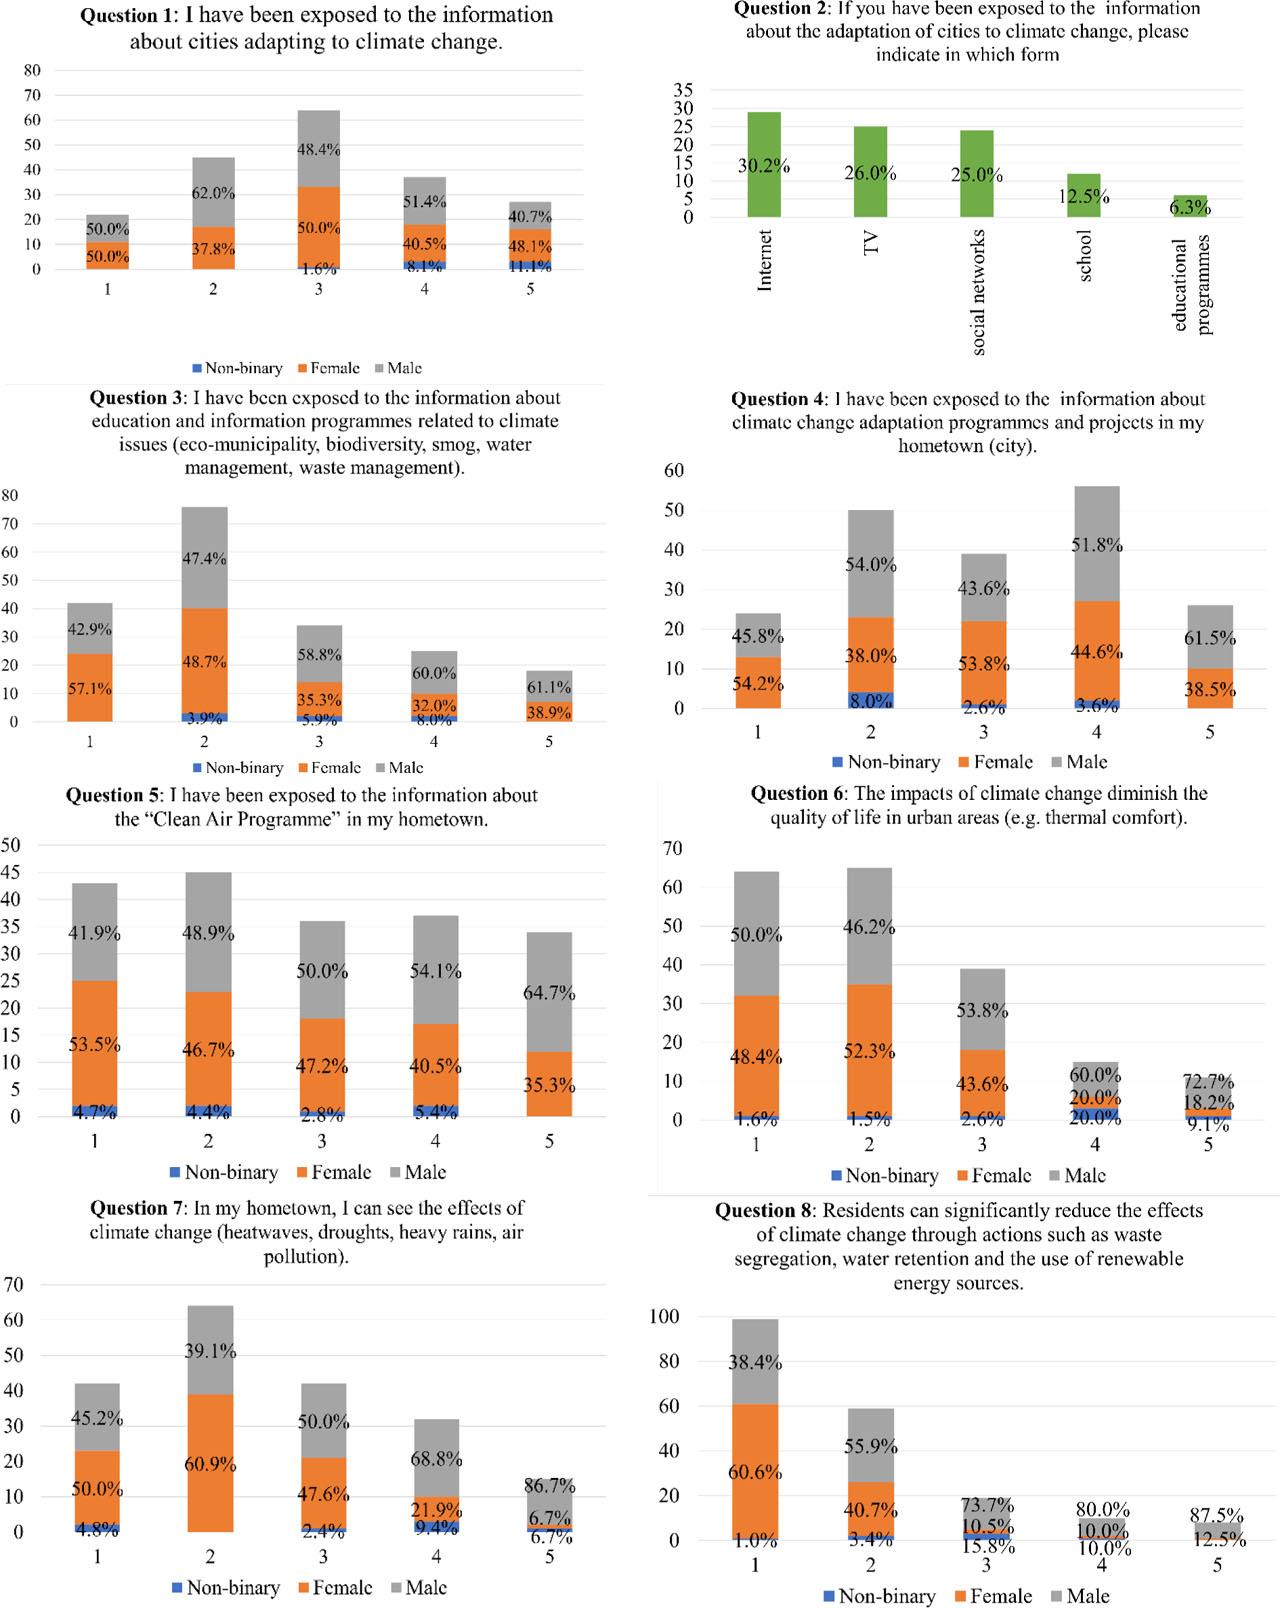
Figure 2.
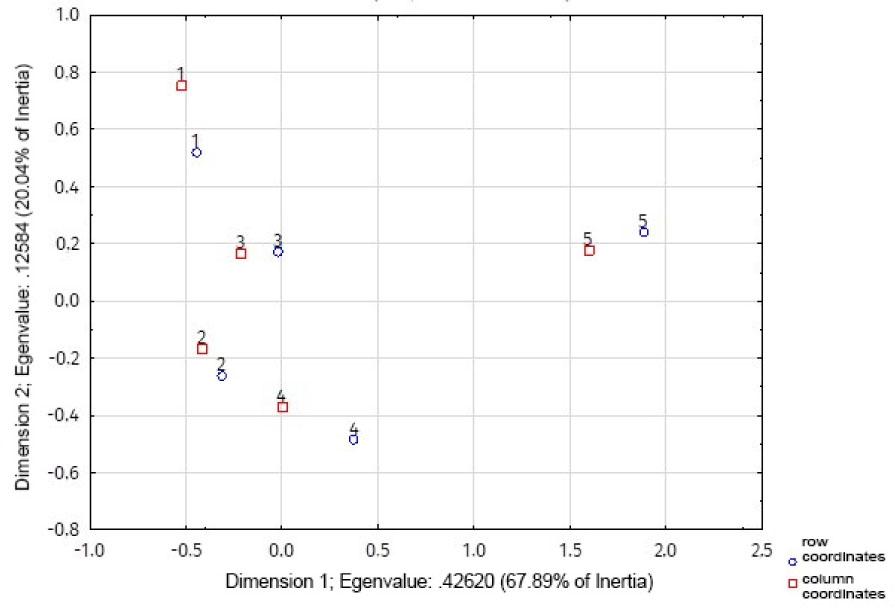
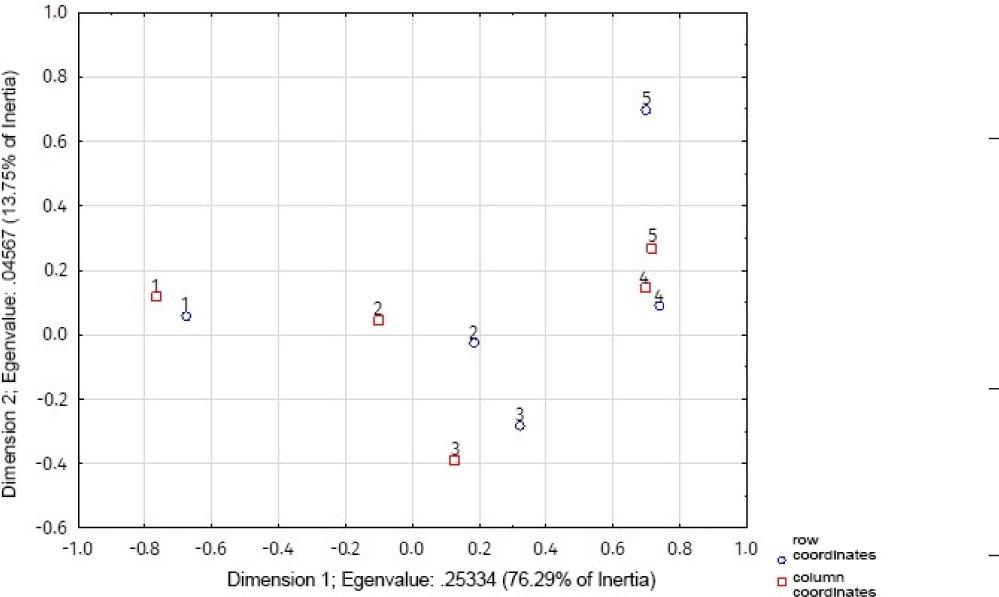
Figure 3.
Comparison of individual response shares by school type for the question ‘In my hometown, I can see the effects of climate change (heatwaves, droughts, heavy rains, air pollution)_’
| Vocational schools | High schools | Technical schools | |
|---|---|---|---|
| 1 | 19.4 | 23.9 | 18.2 |
| 2 | 19.4 | 41.3 | 23.6 |
| 3 | 12.9 | 20.2 | 29.1 |
| 4 | 25.8 | 11.0 | 21.8 |
| 5 | 22.6 | 3.7 | 7.3 |
| 19.4 | The largest value in the row (the highest share of responses in the compared schools) |
| 38.7 | Largest value in the column (highest share of responses by school type) |
The share of individual answers for the question ‘Climate change has an impact on the comfort of living in cities (e_g_ thermal comfort)’ was compared by gender
| No. | Female (%) | Male (%) |
|---|---|---|
| 1 | 26.1 | 18.0 |
| 2 | 23.9 | 22.0 |
| 3 | 19.3 | 18.0 |
| 4 | 17.0 | 20.0 |
| 5 | 13.6 | 22,0 |
Comparison of individual response shares by school type for the question ‘I have been exposed to information about cities adapting to climate change’
| Vocational schools | High schools | Technical schools | |
|---|---|---|---|
| 1 | 6.5 | 13.8 | 9.1 |
| 2 | 12.8 | 22.0 | 30.8 |
| 3 | 61.3 | 31.2 | 20.0 |
| 4 | 12.9 | 19.3 | 21.8 |
| 5 | 6.5 | 13.7 | 18.1 |
Comparison of individual response shares by school type for the question ‘Residents can significantly reduce the effects of climate change through actions such as waste segregation, water retention, and the use of renewable energy sources_’
| Vocational schools | High schools | Technical schools | |
|---|---|---|---|
| 1 | 38.7 | 59.6 | 40.0 |
| 2 | 35.5 | 28.4 | 30.9 |
| 3 | 16.1 | 5.5 | 14.5 |
| 4 | 3.2 | 5.5 | 5.5 |
| 5 | 6.5 | 0.9 | 9.1 |
The survey included questions about respondents’ exposure to information on climate change and sustainability
| Education on adaptation to climate change (general knowledge) | 1. I have been exposed to information about cities adapting to climate change |
| 2. If you have been exposed to information about the adaptation of cities to climate change, please indicate in which form (multiple choice: school, TV, Internet, social networks – FB, Instagram, etc. – educational programmes, other). | |
| 3. I have been exposed to information about education and information programmes related to climate issues (eco-municipality, biodiversity, smog, water management, waste management). | |
| Accessibility to education on adapting to climate change in a specific town (city) | 4. I have been exposed to information about climate change adaptation programmes and projects in my hometown (city). |
| 5. I have been exposed to information about the “Clean Air Programme” in my hometown. | |
| Climate change awareness, understood as the overall human impact on the environment | 6. The impacts of climate change diminish the quality of life in urban areas (e.g. thermal comfort). |
| 7. In my hometown, I can see the effects of climate change (heatwaves, droughts, heavy rain, air pollution). | |
| 8. Residents can significantly reduce the effects of climate change through actions such as waste segregation, water retention and the use of renewable energy sources. |
Comparison of individual response shares by school type for the question ‘I have been exposed to information about climate change adaptation programmes and projects in my hometown (city)_’
| Vocational schools | High schools | Technical schools | |
|---|---|---|---|
| 1 | 19.4 | 10.1 | 12.7 |
| 2 | 25.8 | 27.5 | 21.8 |
| 3 | 38.7 | 16.5 | 16.4 |
| 4 | 6.5 | 38.5 | 21.8 |
| 5 | 9.7 | 7.3 | 27.3 |
Comparison of individual response shares by school type for the question ‘The impacts of climate change diminish the quality of life in urban areas’
| Vocational schools | High schools | Technical schools | |
|---|---|---|---|
| 1 | 22.6 | 38.5 | 27.3 |
| 2 | 38.7 | 34.9 | 27.3 |
| 3 | 19.4 | 16.5 | 27.3 |
| 4 | 9.7 | 8.3 | 5.5 |
| 5 | 9.7 | 0.9 | 12.7 |
Comparison of individual response shares by school type for the question ‘I have been exposed to information about education and information programmes related to climate issues’
| Vocational schools | High schools | Technical schools | |
|---|---|---|---|
| 1 | 38.7 | 21.1 | 12.7 |
| 2 | 25.8 | 46.8 | 30.9 |
| 3 | 22.6 | 12.8 | 23.6 |
| 4 | 3.2 | 14.7 | 14.5 |
| 5 | 9.7 | 4.6 | 18.2 |
Responses compared by gender for the question ‘In my hometown, I can see the effects of climate change (heatwaves, droughts, heavy rains, air pollution)_’
| No. | Female (%) | Male (%) |
|---|---|---|
| 1 | 23.9 | 19.0 |
| 2 | 44.3 | 25.0 |
| 3 | 22.7 | 21.0 |
| 4 | 8.0 | 22.0 |
| 5 | 1.1 | 13.0 |