
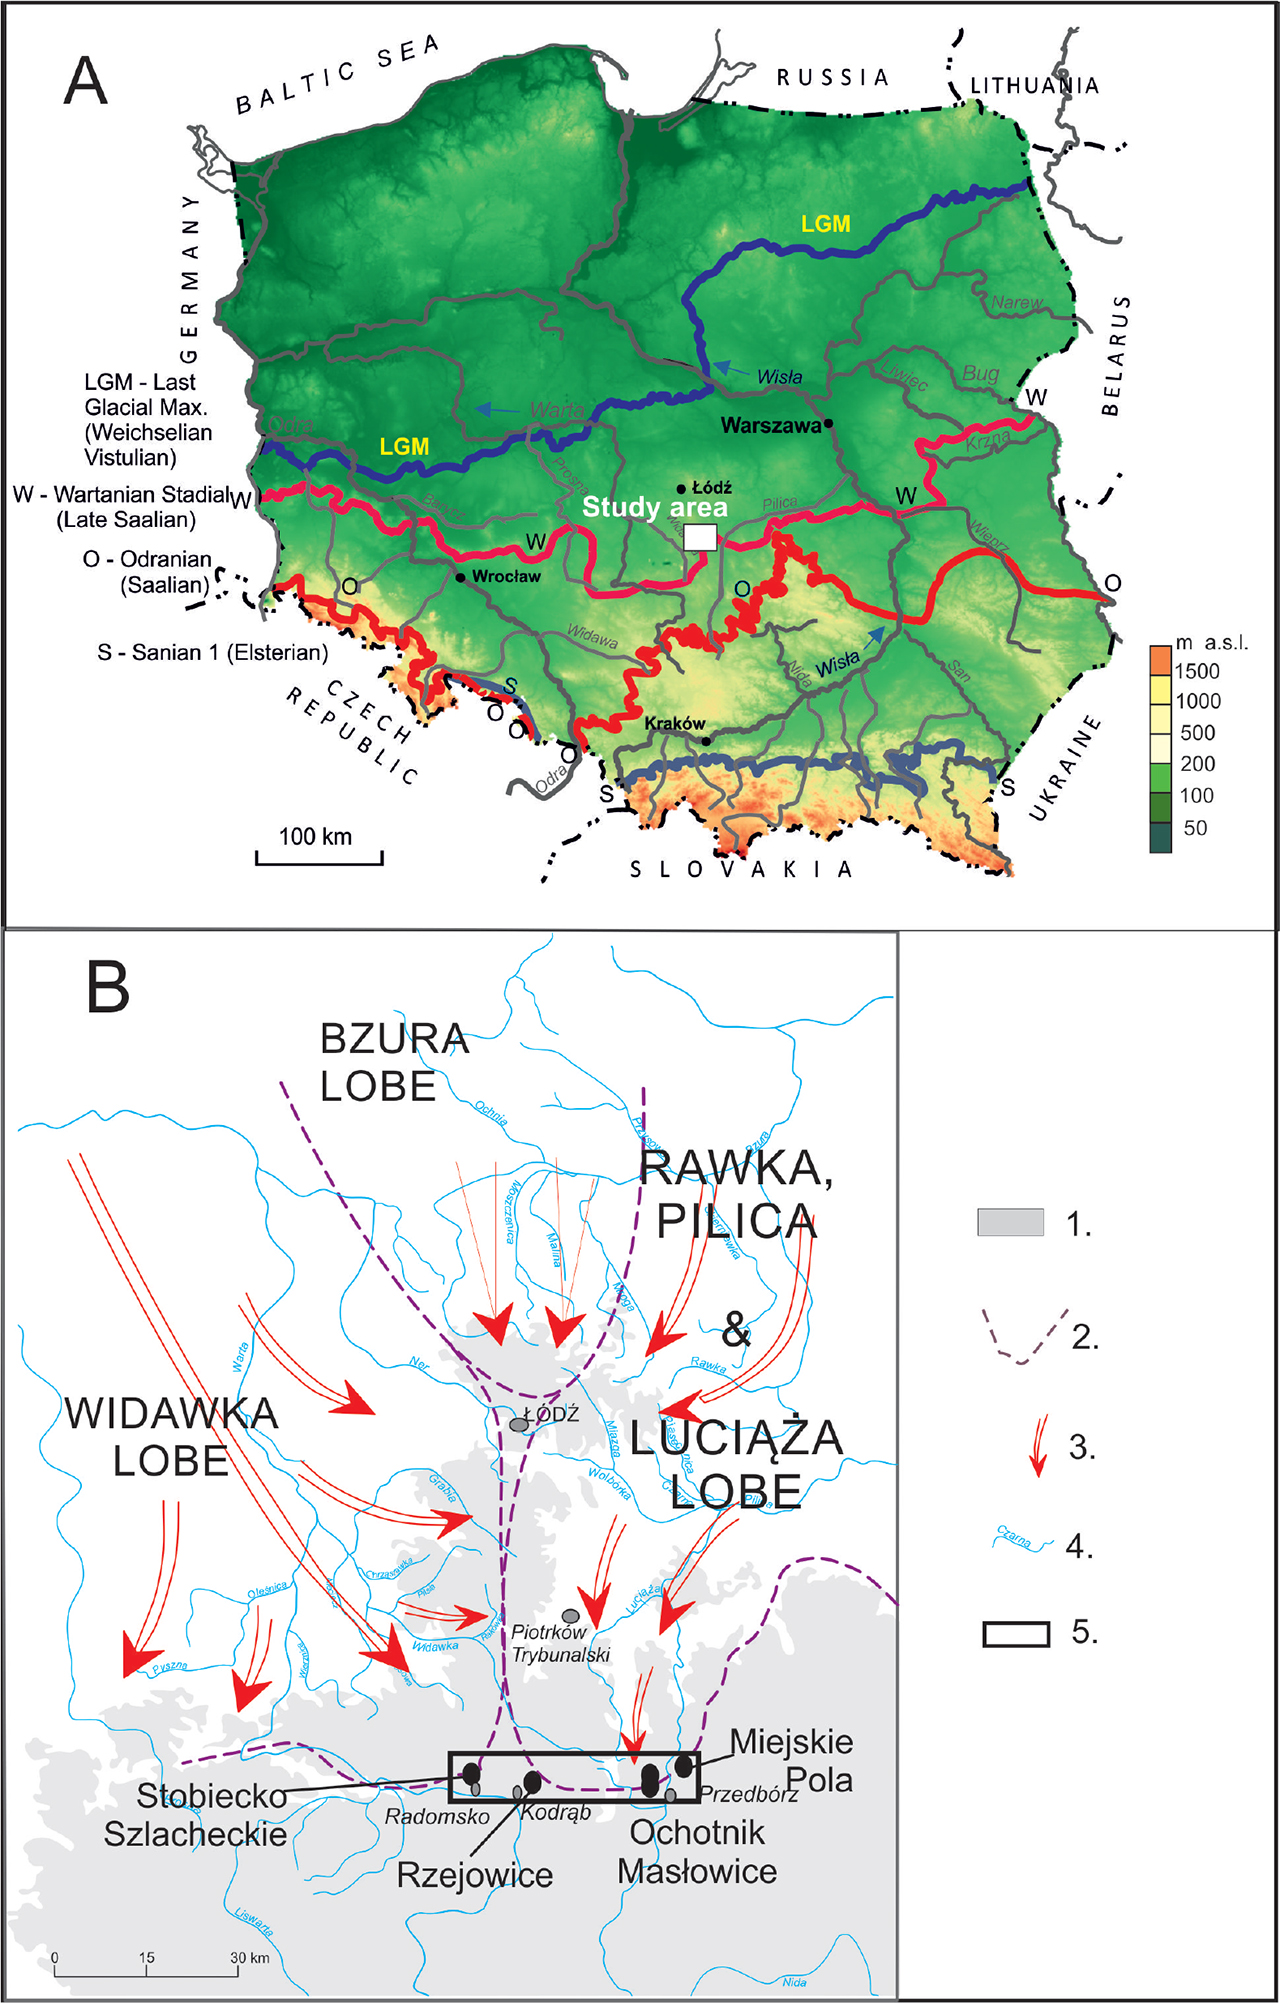
Figure 1.
Location of study sites within the transition zone between the Polish Uplands and the European Plain in the central part of Poland. A: The sites belonging to the marginal zone of the Wartanian stadial of the Odranian glaciation (MIS6a). B: 1 – area above 200 m a.s.l.; 2 – lobes of the Wartanian ice sheet acc. to Turkowska (2006), changed; 3 – direction of the ice movement (acc. to Wachecka-Kotkowska 2015b); 4 – rivers; 5 – study area with investigated sites
Source: own elaboration
Table 1.
Percentage of petrographic types of 4–10 mm gravel in the study area
| Rzejowice | Ochotnik 1 | Ochotnik 2 | Masłowice | Miejskie Pola 1 | Miejskie Pola 2 | Stobiecko Szlacheckie 1 | Stobiecko Szlacheckie 2 | Stobiecko Szlacheckie 3 | |
|---|---|---|---|---|---|---|---|---|---|
| Outwash plain | Till plateau | Morainic hill | Kame | Terminoglacial fan, sedimentological edge of ice-sheet | |||||
| % | |||||||||
| Kr | 57.4 | 37.2 | 37.5 | 89.3 | 38.6 | 34.8 | 86.0 | 36.9 | 33.2 |
| Wp1 | 0.0 | 51.4 | 54.7 | 0.0 | 49.7 | 51.4 | 0.0 | 52.5 | 58.5 |
| Wp2 | 0.0 | 0.3 | 0.9 | 0.0 | 0.4 | 0.6 | 0.0 | 2.7 | 1.2 |
| Wk | 0.0 | 0.0 | 0.0 | 0.0 | 0.0 | 0.0 | 0.0 | 0.0 | 0.0 |
| Dp | 0.0 | 0.0 | 0.0 | 0.0 | 0.0 | 0.0 | 0.0 | 0.0 | 0.0 |
| Pp | 25.9 | 5.1 | 6.0 | 8.2 | 8.9 | 11.9 | 12.9 | 4.8 | 5.0 |
| Łp | 0.0 | 0.6 | 0.0 | 0.0 | 0.0 | 0.2 | 0.0 | 0.0 | 0.0 |
| Krz | 3.6 | 0.0 | 0.0 | 0.0 | 0.0 | 0.0 | 0.0 | 0.0 | 0.0 |
| L | 0.0 | 0.0 | 0.0 | 0.0 | 0.0 | 0.0 | 0.0 | 0.0 | 0.0 |
| Qp | 12.0 | 1.1 | 0.9 | 2.5 | 2.1 | 0.9 | 1.1 | 2.9 | 1.7 |
| Qml | 0.7 | 0.0 | 0.0 | 0.0 | 0.3 | 0.2 | 0.0 | 0.2 | 0.4 |
| in. | 0.4 | 4.3 | 0.0 | 0.0 | 0.0 | 0.0 | 0.0 | 0.0 | 0.0 |
| 100.0 | 100.0 | 100.0 | 100.0 | 100.0 | 100.0 | 100.0 | 100.0 | 100.0 | |
Table 2.
The main characteristics of the erratic boulders, found in the study sites and their immediate vicinity
| No. | Length [m] | Width [m] | Height [m] | Circuit [m] | Volume [m3]* | Weight [t]* | Petrographic type and kind of erratic; Fig. no. | Specific morphological characteristics; other information |
|---|---|---|---|---|---|---|---|---|
| 1 | 1.65 | 1.0 | 0.8 | 4.6 | 0.69 | 1.90 | Åland rapakivi; Figs. 5–6 | near Masłowice |
| 2 | 1.7 | 1.05 | 0.9 | 4.75 | 0.84 | 2.31 | Småland granite; Figs. 7–8 | glacial polish, spur outline, corrasive microrelief, eolian cut, Ochotnik |
| 3 | 1.3 | 1.1 | 0.5 | 4.1 | 0.37 | 1.03 | granite-gneiss; Fig. 9 | Ochotnik – Kalinki |
| 4 | 1.35 | 1.2 | 1.1 | 3.75 | 0.93 | 2.56 | red granite with pegmatite vein | Kraszewice (4 km to the S of Masłowice), a boulder cracked on the surface of the vein, weathered |
| 5 | 0.95 | 0.75 | 0.48 | 3.2 | 0.18 | 0.49 | granite | Wierzchlas (14 km to the E of Masłowice) |
| 6 | 1.4 | 1.1 | 0.75 | 4.05 | 0.60 | 1.66 | fine crystalline granite | |
| 7 | 1.4 | 1.4 | 0.4 | 4.5 | 0.41 | 1.13 | fine crystalline granite with pegmatite vein | |
| 8 | 1.35 | 0.95 | 0.75 | 4.2 | 0.50 | 1.38 | Småland granite, gneissed | |
| 9 | 1.15 | 1.1 | 0.75 | 3.75 | 0.50 | 1.36 | Åland rapakivi | mossy, covered with lichen, Wierzchlas (location as above) |
| 10 | 1.7 | 0.75 | 0.7 | 4.05 | 0.47 | 1.28 | granite with pegmatite veins | Sokola Góra (8 km to the SSE of Masłowice) |
| 11 | 1.2 | 0.85 | 0.55 | 3.4 | 0.29 | 0.81 | Åland granite with pegmatite vein | the only boulder in situ! measurements of the part of the boulder above the ground, Sokola Góra (location as above) |
| 12 | 1.4 | 1.3 | 0.7 | 4.75 | 0.67 | 1.83 | fine crystalline granite, Åland rapakivi | corrasive microrelief, Sokola Góra (location as above) |
| 13 | 1.38 | 0.95 | 0.55 | 3.75 | 0.38 | 1.04 | red coarse crystalline granite with pegmatite vein | |
| 14 | 1.85 | 1.6 | 0.55 | 5.3 | 0.85 | 2.34 | coarse crystalline Åland quartz granite | corrasive microrelief, glacial polish, Pratkowice (8 km to the SSE of Masłowice) |
* The volume of the boulders was calculated using the formula 0.523 × length × width × height; weight calculation assumes that 1 m3 = 2.75 t (Schulz 1964)
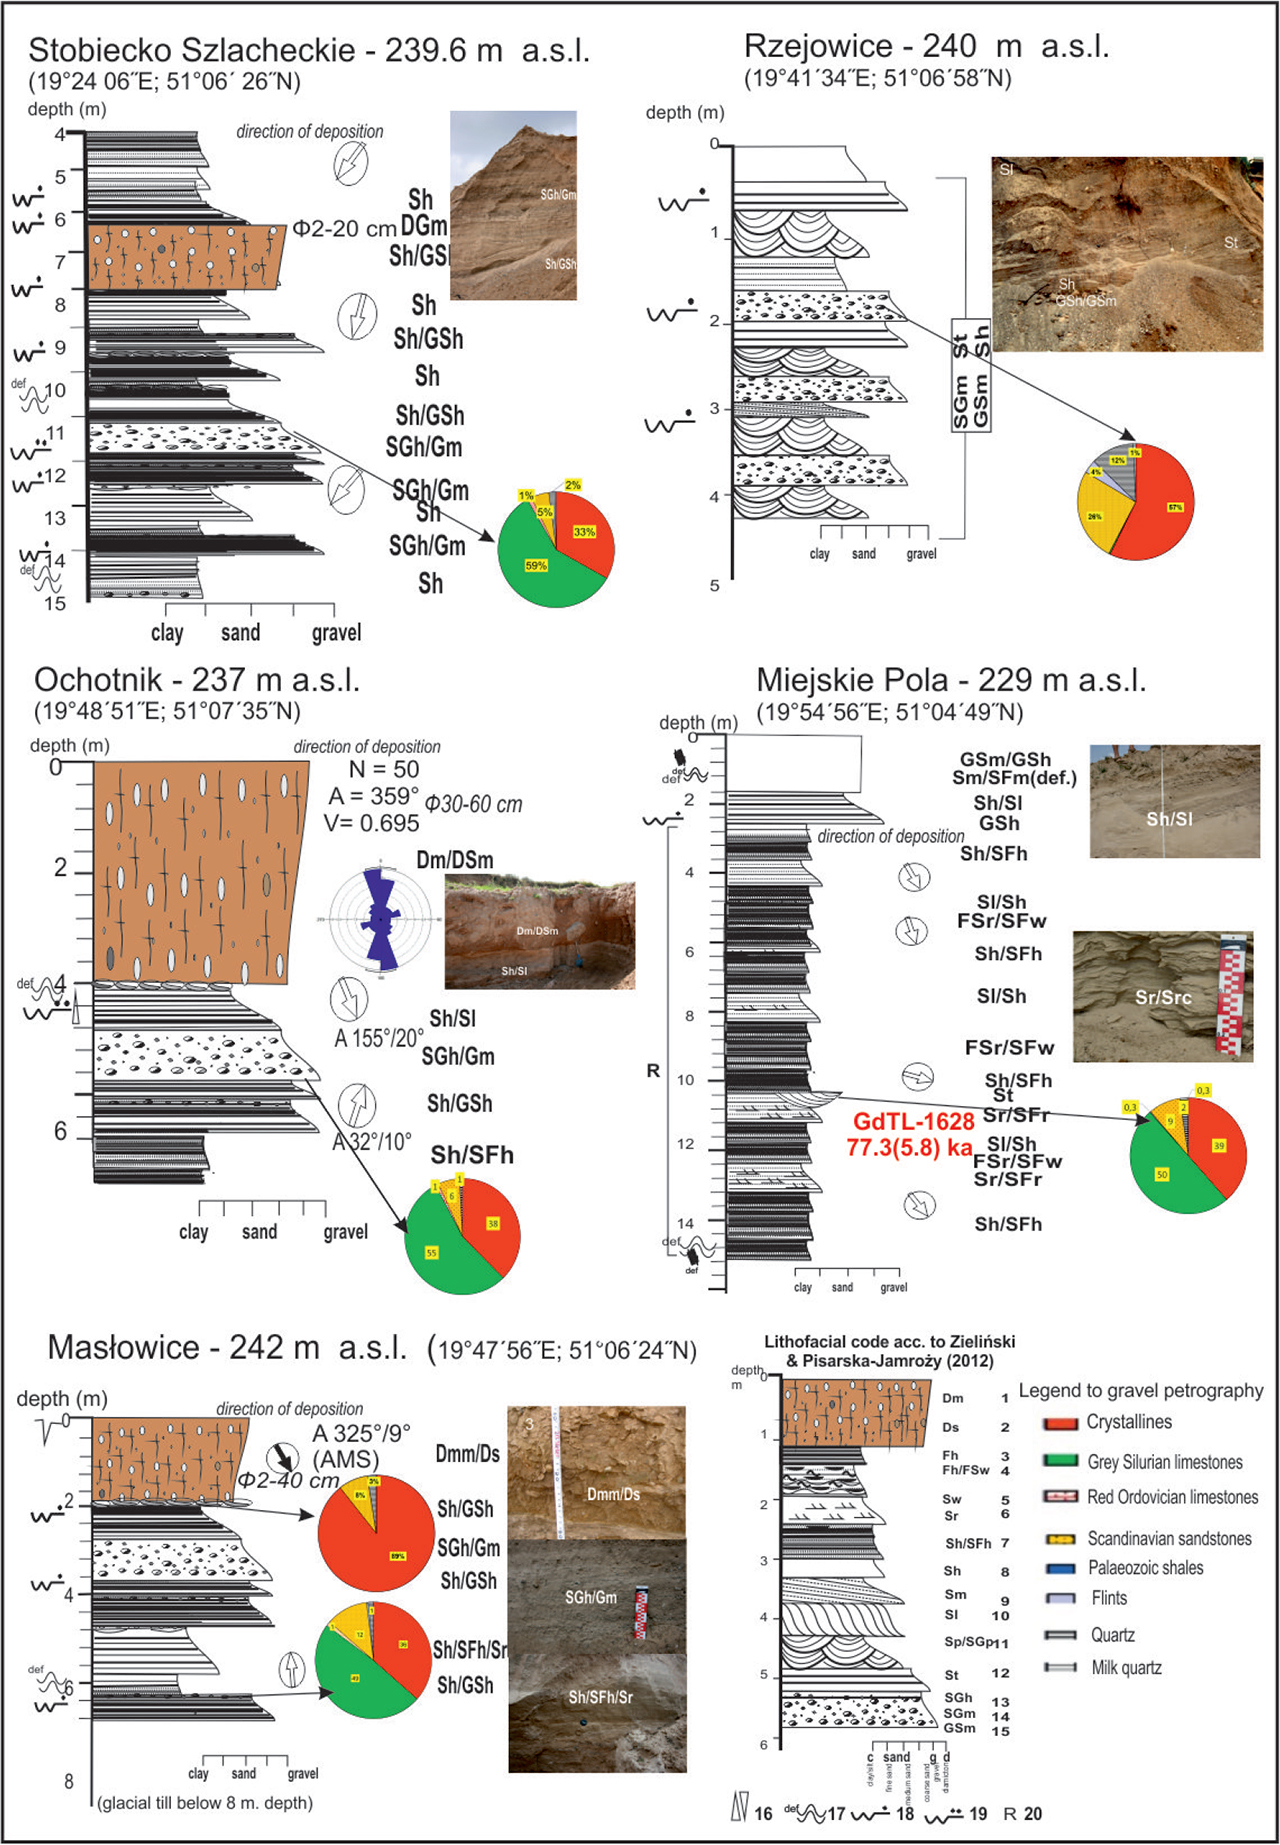
Figure 2.
Schematic profile of the lithology in five outcrops with sedimentary structures according to own elaboration (LWK) based on Wachecka-Kotkowska (2015a) and marked sampling sites for analysis of erratic gravels and erratic boulders. 1 – massive diamicton; stratified diamicton (Dm); 2 – matrix supported and clast poor (Ds); 3 – horizontally laminated fines (Fh); 4 – wavy laminated sand with fines (SFw); 5 – wavy laminated sand (Sw); 6 – ribbon cross-laminated sand (Sr); 7 – horizontally stratified sand/laminated fines (Sh/SFh); 8 – horizontally stratified sand (Sh); 9 – massive sand (Sm); 10 – sand low-angle (<15°) cross-stratification (Sl); 11 – planar cross-stratified gravelly sand/gravelly sand (Sp/SGp); 12 – trough cross-stratified sand (St); 13 – horizontally stratified sandy gravel (SGh); 14 – massive gravelly sand (GSm); 15 – massive sandy gravel (SGm); 16 – normal/inverted sequence fractional grain size; 17 – continuous deformations of various types; 18 – local erosion surface; 19 – regional erosion surface; 20 – rhythmite
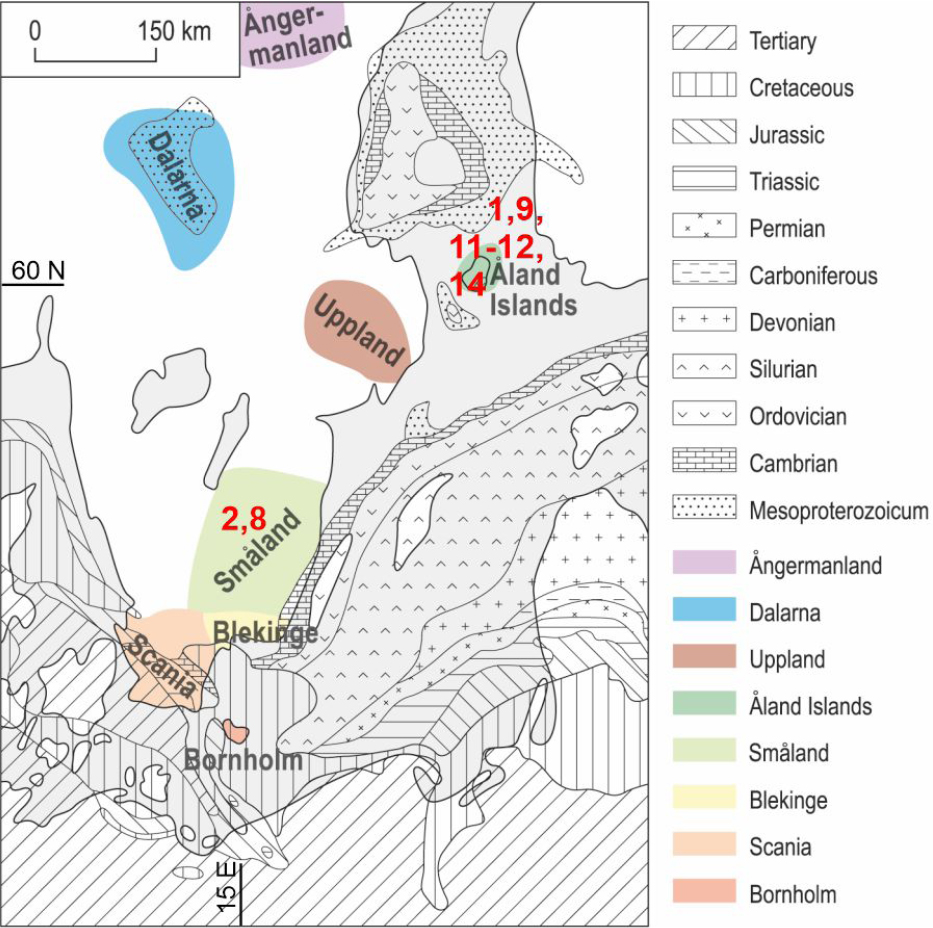
Figure 3.
Parent locations of seven indicator erratic boulders presented in this paper, against other primary Scandinavian feeding areas. The relevant numbers are listed in Table 2
Source: drawn by Małgorzata Gościńska-Kolanko
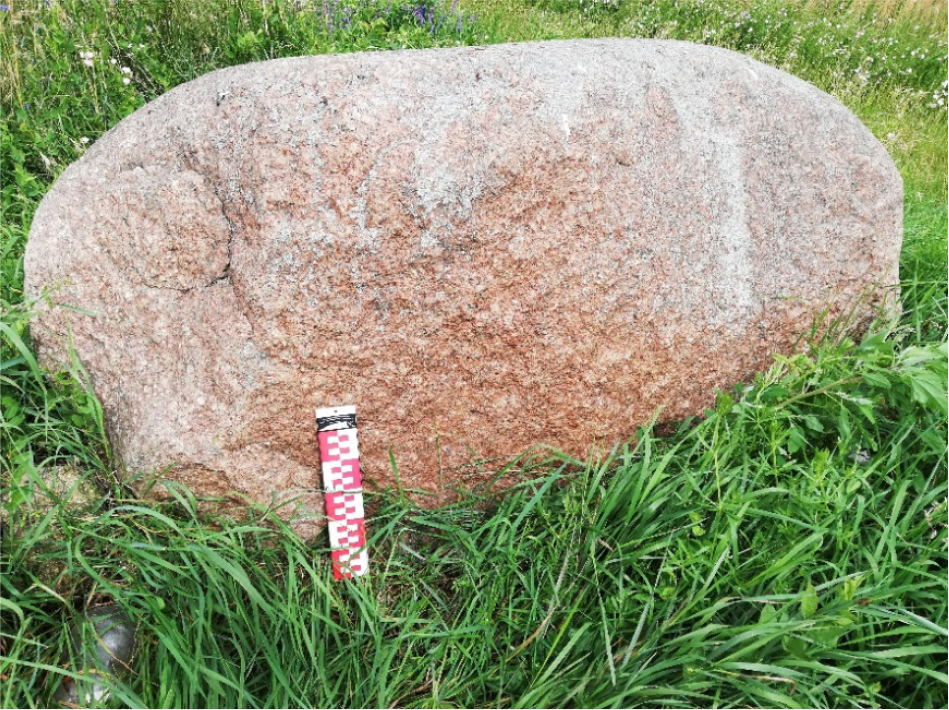
Figure 4.
Masłowice, well-reworked rapakivi Åland granite; erratic boulder 1 in Table 2.
Source: photograph by Maria Górska-Zabielska
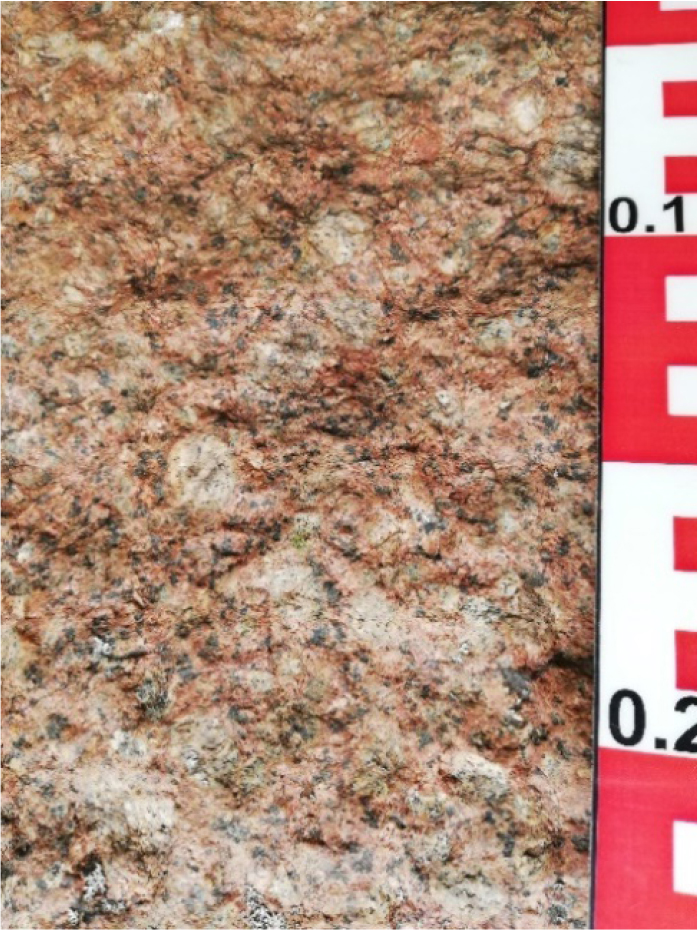
Figure 5.
Masłowice, close-up of the rapakivi structure in Åland granite
Source: photograph by Maria Górska-Zabielska
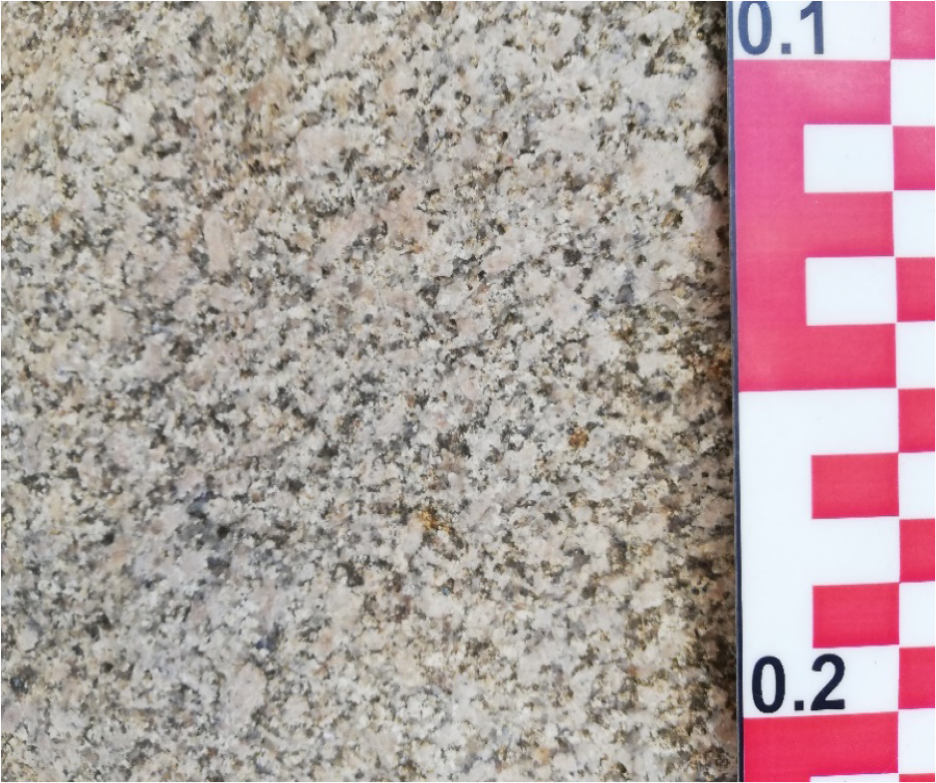
Figure 6.
Ochotnik, close-up of the Småland granite.
Source: photograph by Maria Górska-Zabielska
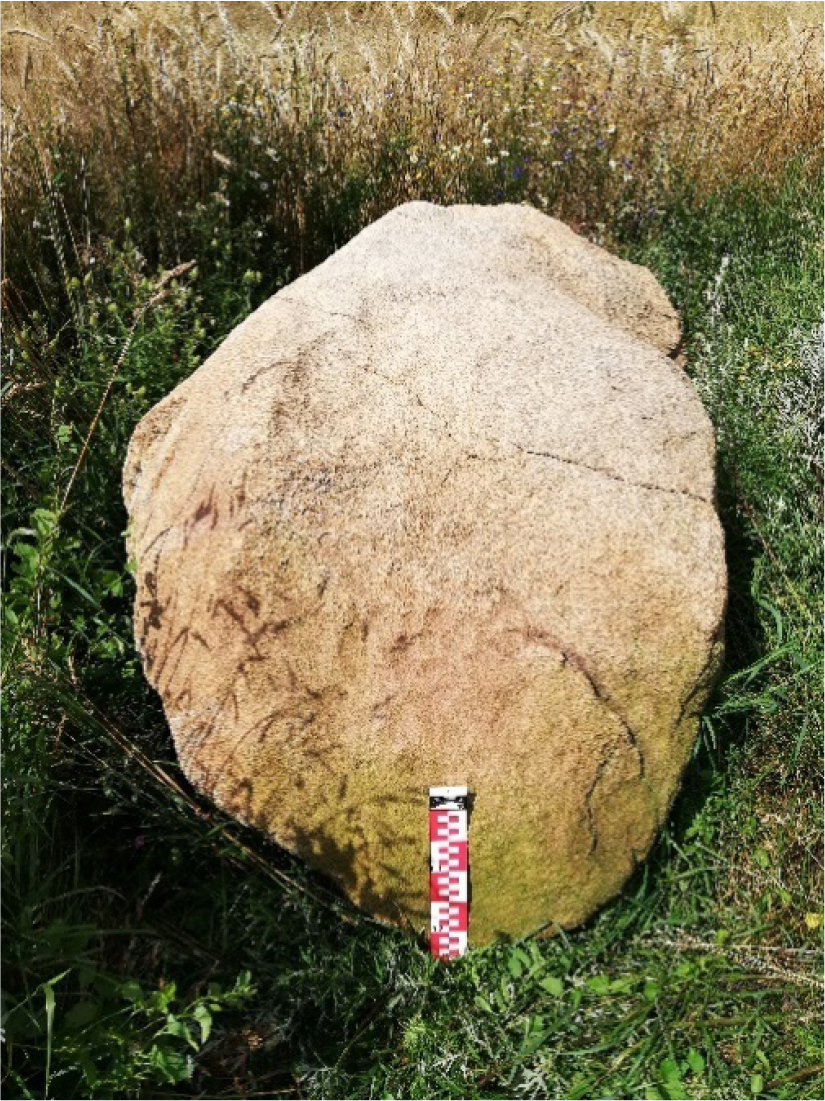
Figure 7.
Ochotnik, Småland granite with well-rounded edges, glacial polish in places, corrosion microrelief; erratic boulder 2 in Table 2.
Source: photograph by Maria Górska-Zabielska
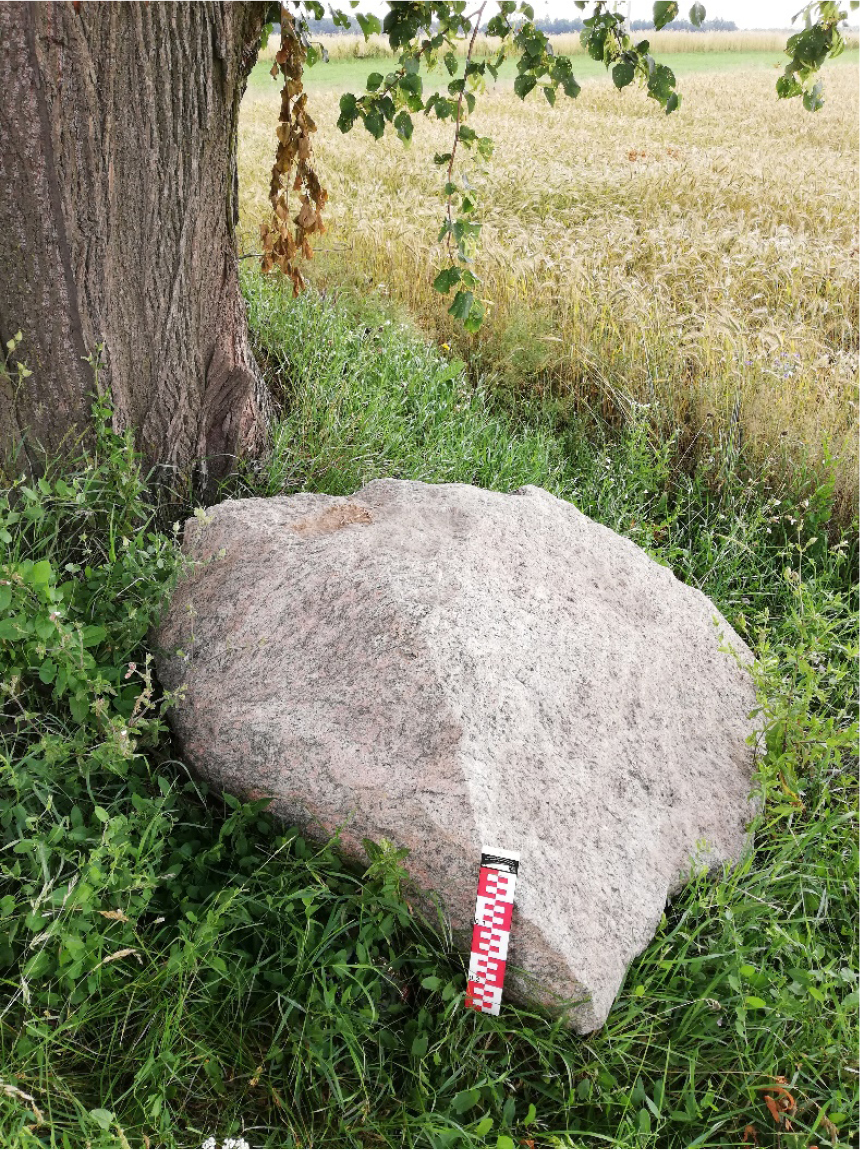
Fig. 8.
Ochotnik, granite-gneiss is a ventifact with a clearly visible corroded facete on the upper surface of the rock; erratic boulder 3 in Table 2.
Source: photograph by Maria Górska-Zabielska
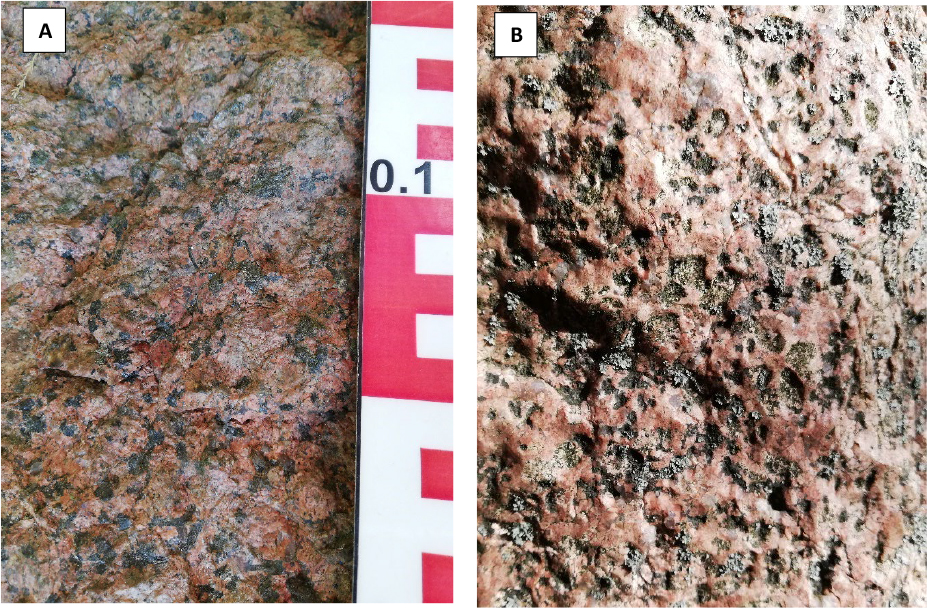
Figure 9.
Example of the same Åland granite with surfaces representing different states of preservation: A – fresh surface, B – eolised surface; the scale is the same for both figures.
Source: photographs by Maria Górska-Zabielska
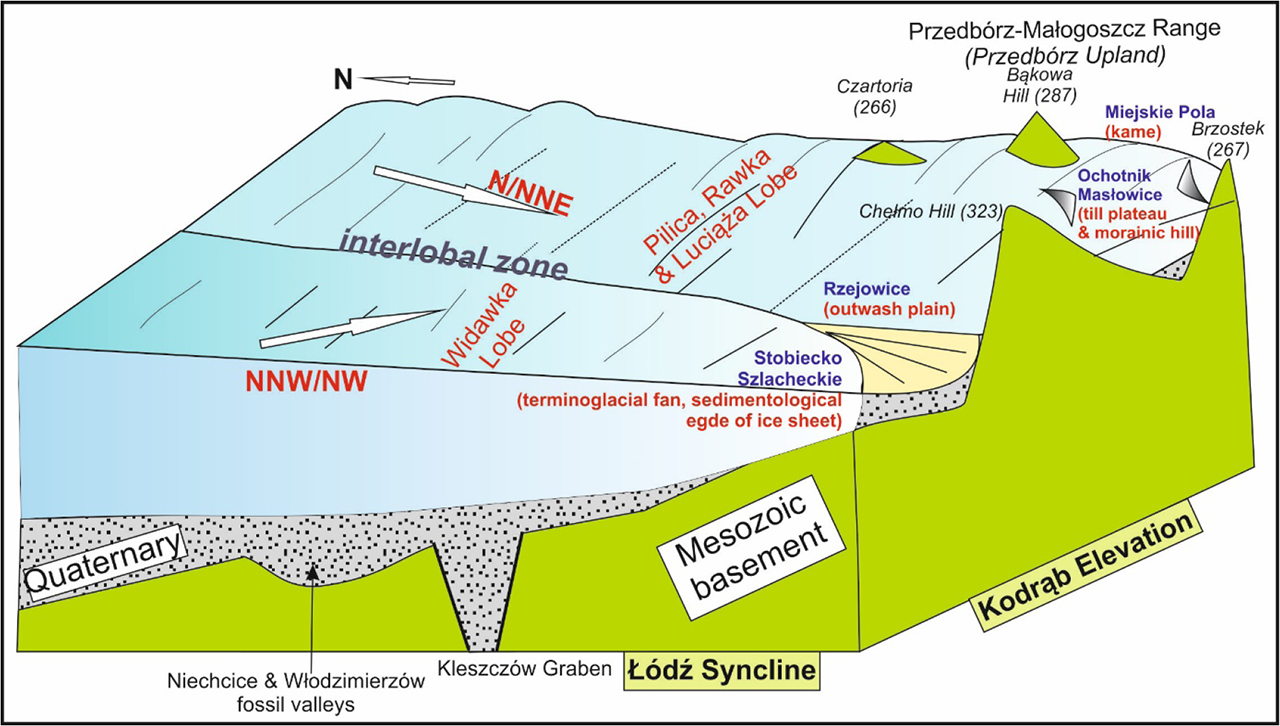
Figure 10.
Model of transgression of the Wartanian ice sheet in Central Poland and stagnation on the northern slopes of the highlands
Source: own elaboration