
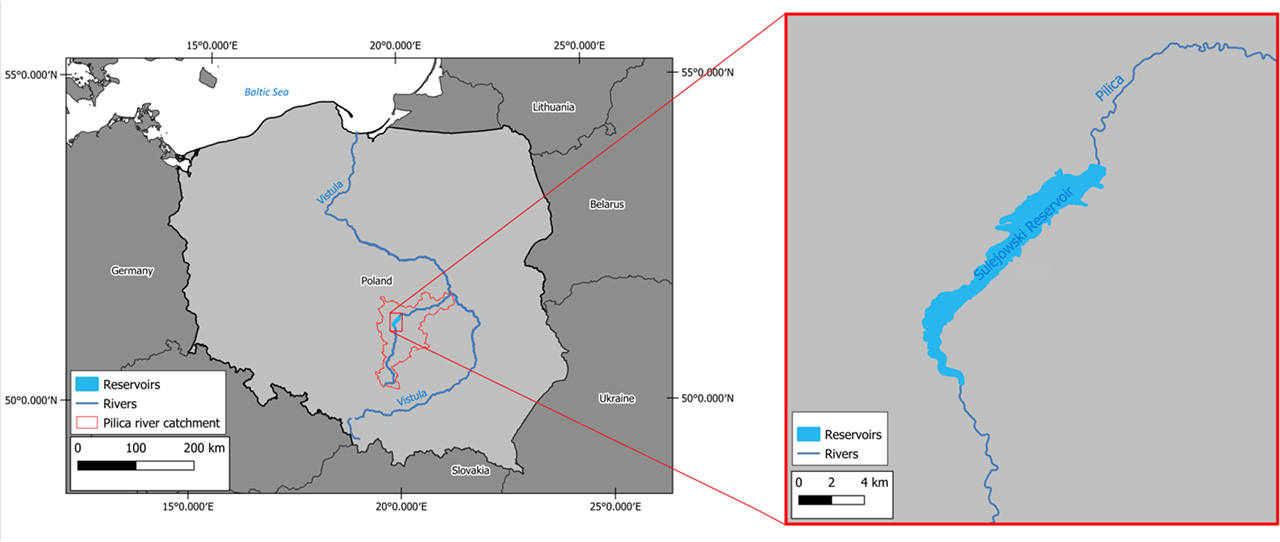
Figure 1.
Location of the Sulejów Reservoir in the Pilica river catchment, the Vistula River, and map of the Republic of Poland
Source: own elaboration
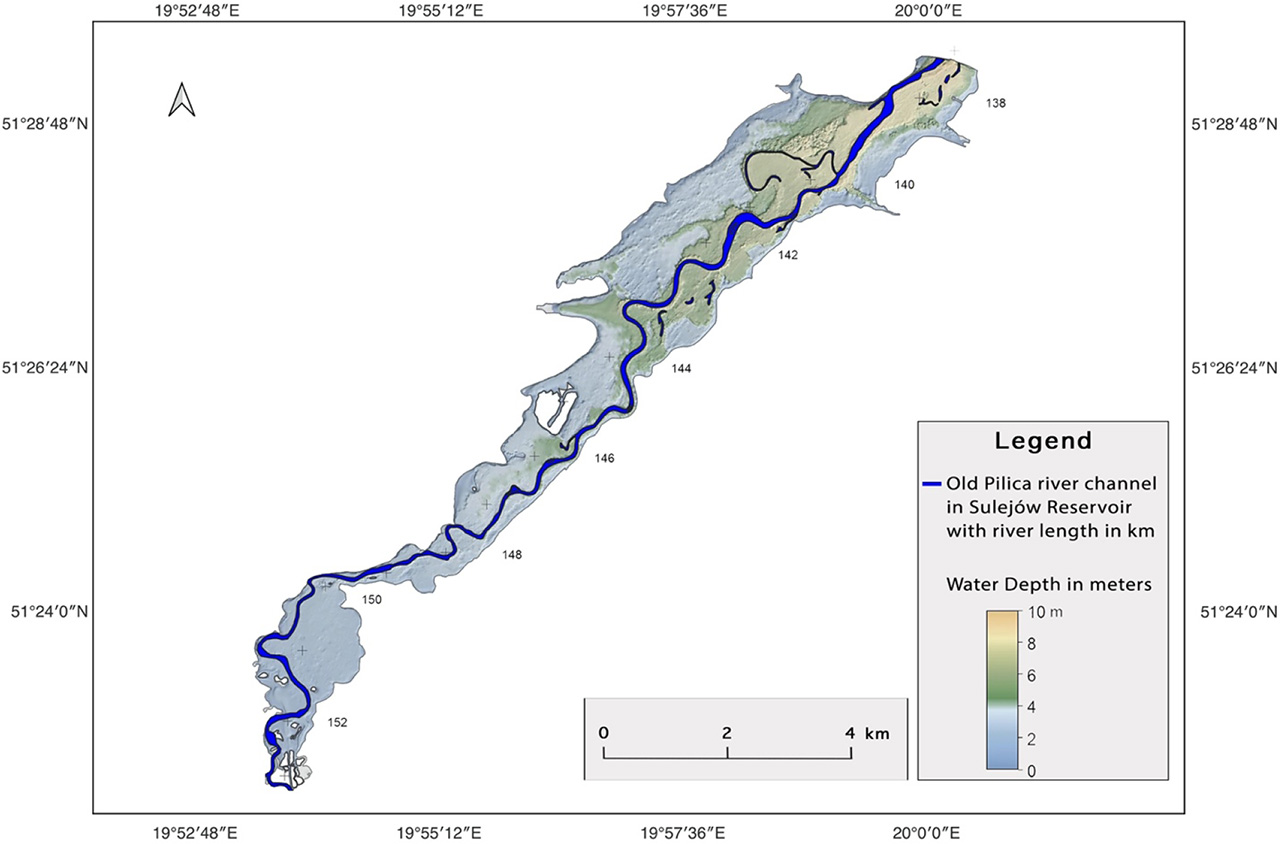
Figure 2.
Sulejów Reservoir bathymetry with length in km and original course of the Pilica River channel
Source: own elaboration
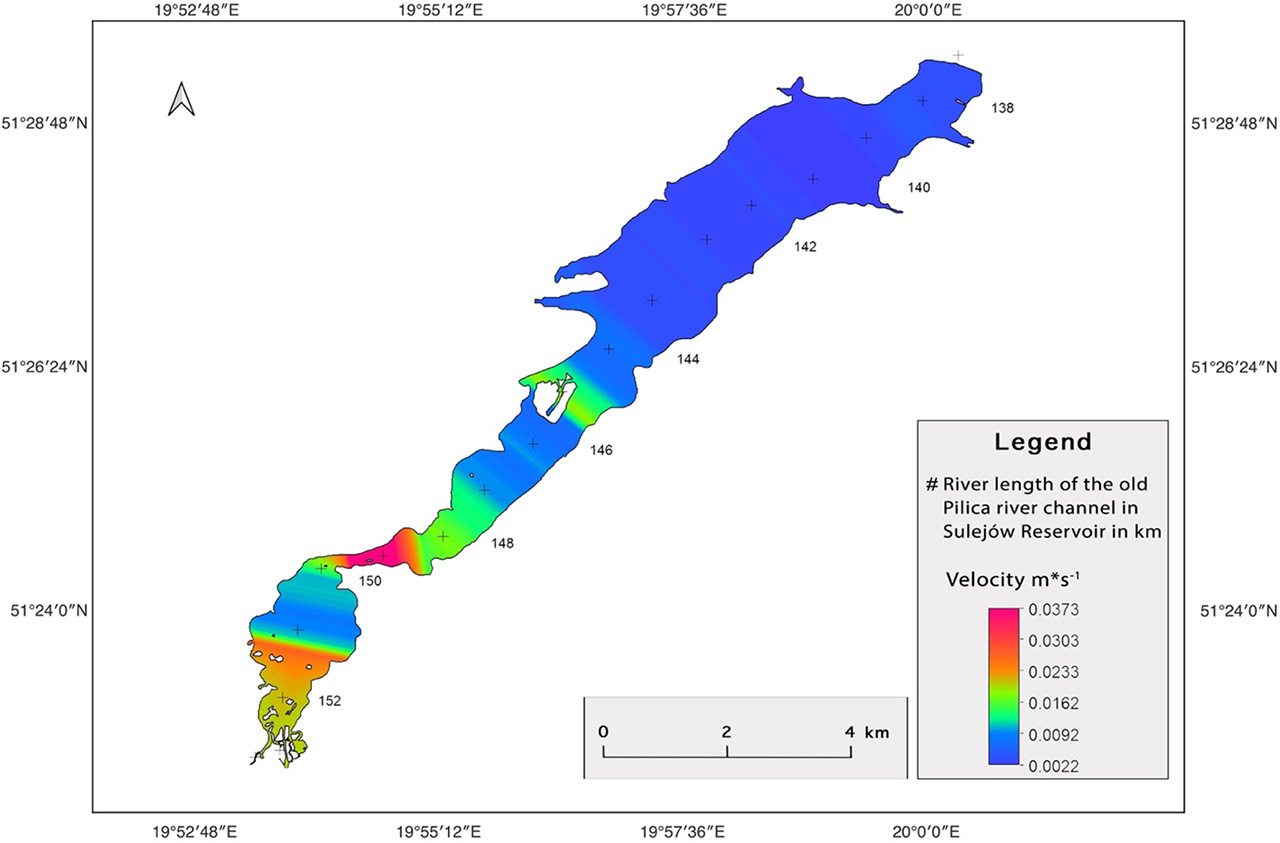
Figure 3.
Average velocities at cross-sections of Sulejów Reservoir
Source: own elaboration
Table 1.
Results of bottom sediments chemical analysis in four sedimentation condition classes (Ziemińska-Stolarska et al. 2020) – modified)
| Sedimentation Conditions | Sample No. | WGS84 | Depth (m) | Mg/Kg | |||
|---|---|---|---|---|---|---|---|
| Lat. | Long. | TOC | TP | Cd | |||
| TL | 1 | 51.471722 | 20.005750 | 9.3 | 40.98 | 1.26 | 0.73 |
| 7 | 51.461250 | 19.972194 | 9.0 | 96.34 | 2.30 | 1.20 | |
| 8 | 51.452833 | 19.970277 | 10.0 | 96.66 | 2.70 | 1.56 | |
| 3 | 51.469777 | 19.994361 | 10.0 | 140.75 | 2.99 | 1.32 | |
| 11 | 51.446472 | 19.960555 | 6.7 | 112.26 | 3.39 | 1.34 | |
| 14 | 51.446527 | 19.946805 | 7.8 | 104.07 | 3.57 | 1.41 | |
| 23 | 51.408361 | 19.896305 | 3.5 | 88.55 | 3.28 | 1.49 | |
| 18 | 51.432638 | 19.938194 | 4.9 | 76.40 | 2.85 | 0.87 | |
| LZ | 4 | 51.463333 | 19.988583 | 6.5 | 2.33 | 1.38 | 0.31 |
| 5 | 51.456388 | 19.986361 | 2.0 | 3.98 | 0.74 | 0.28 | |
| 26 | 51.394638 | 19.857722 | 2.0 | 11.22 | 0.78 | 0.24 | |
| 2 | 51.465694 | 20.003277 | 3.5 | 2.93 | 0.80 | 0.28 | |
| 28 | 51.392277 | 19.865472 | 1.8 | 5.76 | 0.72 | 0.23 | |
| 9 | 51.455916 | 19.962333 | 5.2 | 9.53 | 0.83 | 0.25 | |
| 10 | 51.459083 | 19.953611 | 3.0 | 4.37 | 0.79 | 0.26 | |
| 12 | 51.448583 | 19.947388 | 5.5 | 18.05 | 1.00 | 0.43 | |
| 13 | 51.452888 | 19.939038 | 2.2 | 7.80 | 0.85 | 0.22 | |
| 15 | 51.437555 | 19.949861 | 3.0 | 7.68 | 0.82 | 0.24 | |
| 17 | 51.441111 | 19.917944 | 5.0 | 13.14 | 0.95 | 0.45 | |
| 19 | 51.435055 | 19.928055 | 3.4 | 5.18 | 0.88 | 0.22 | |
| AF | 20 | 51.423722 | 19.920500 | 4.5 | 20.56 | 1.66 | 0.63 |
| 27 | 51.473777 | 20.004472 | 8.5 | 8.26 | 0.76 | 0.24 | |
| 22 | 51.419055 | 19.915000 | 4.1 | 19.85 | 1.52 | 0.67 | |
| 24 | 51.404861 | 19.875916 | 3.0 | 31.78 | 1.97 | 0.80 | |
| ST | 25 | 51.399916 | 19.864611 | 2.7 | 75.41 | 2.49 | 1.41 |
| 16 | 51.446416 | 19.920944 | 4.5 | 125.42 | 2.71 | 1.06 | |
| 21 | 51.425611 | 19.913888 | 3.9 | 116.53 | 3.10 | 1.70 | |
| 6 | 51.470166 | 19.972250 | 3.7 | 87.01 | 1.50 | 0.66 | |
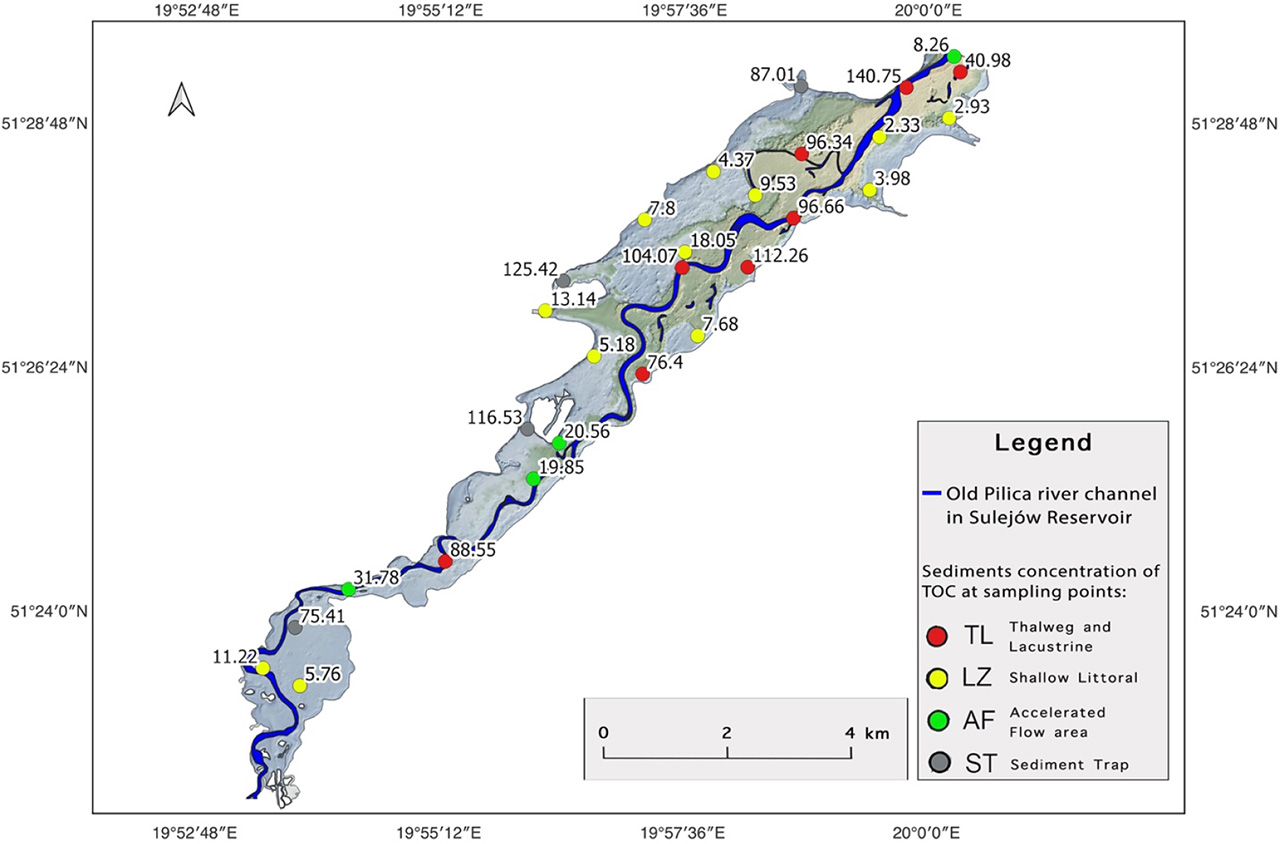
Figure 4.
Sulejów Reservoir bottom sediments concentration of Total Organic Carbon (TOC) at sampling points with different sedimentation conditions: TL – thalweg and lacustrine zone, LZ – shallow littoral zone, AF – accelerated flow area, ST – sediment trap
Source: own elaboration
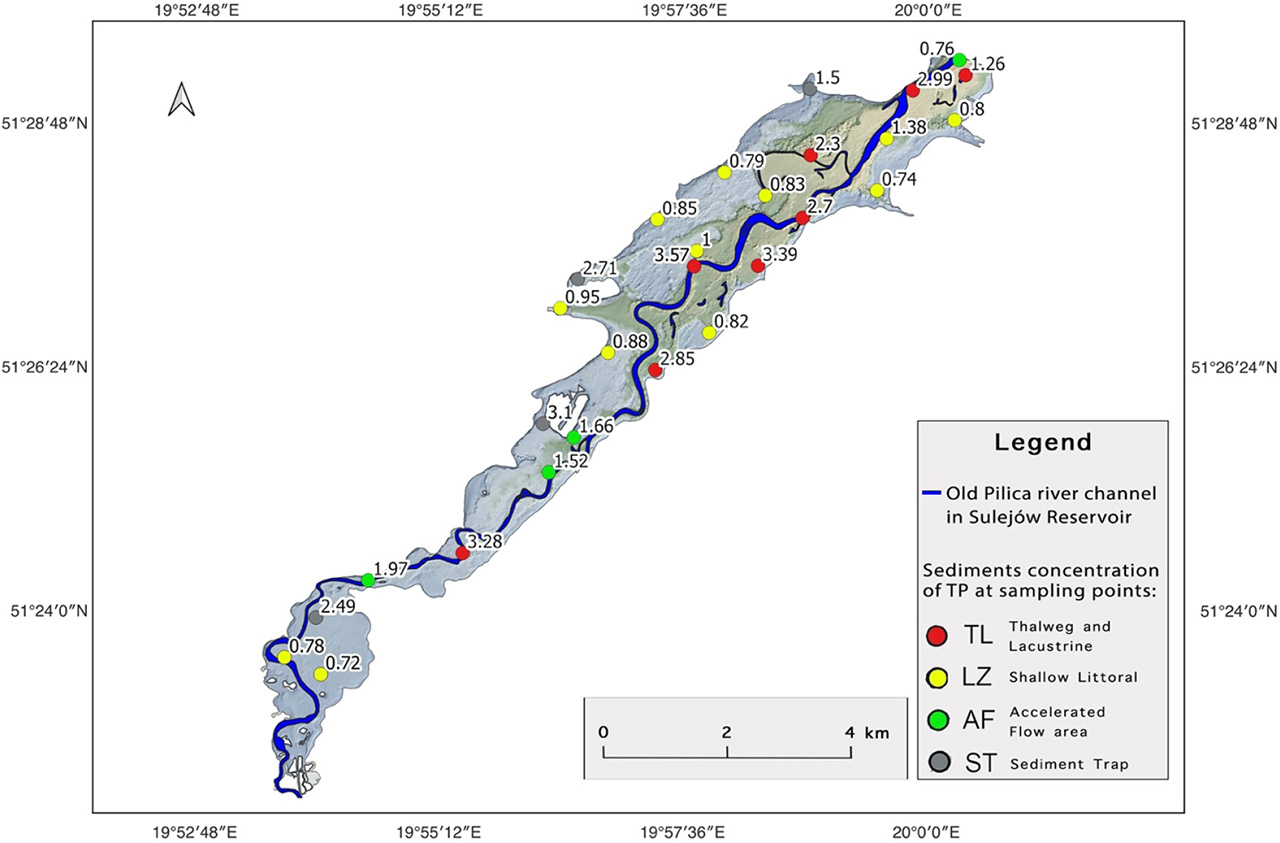
Figure 5.
Sulejów Reservoir bottom sediments concentration of Total Phosphorus (TP) at sampling points with different sedimentation conditions: TL – thalweg and lacustrine zone, LZ – shallow littoral zone, AF – accelerated flow area, ST – sediment trap
Source: own elaboration
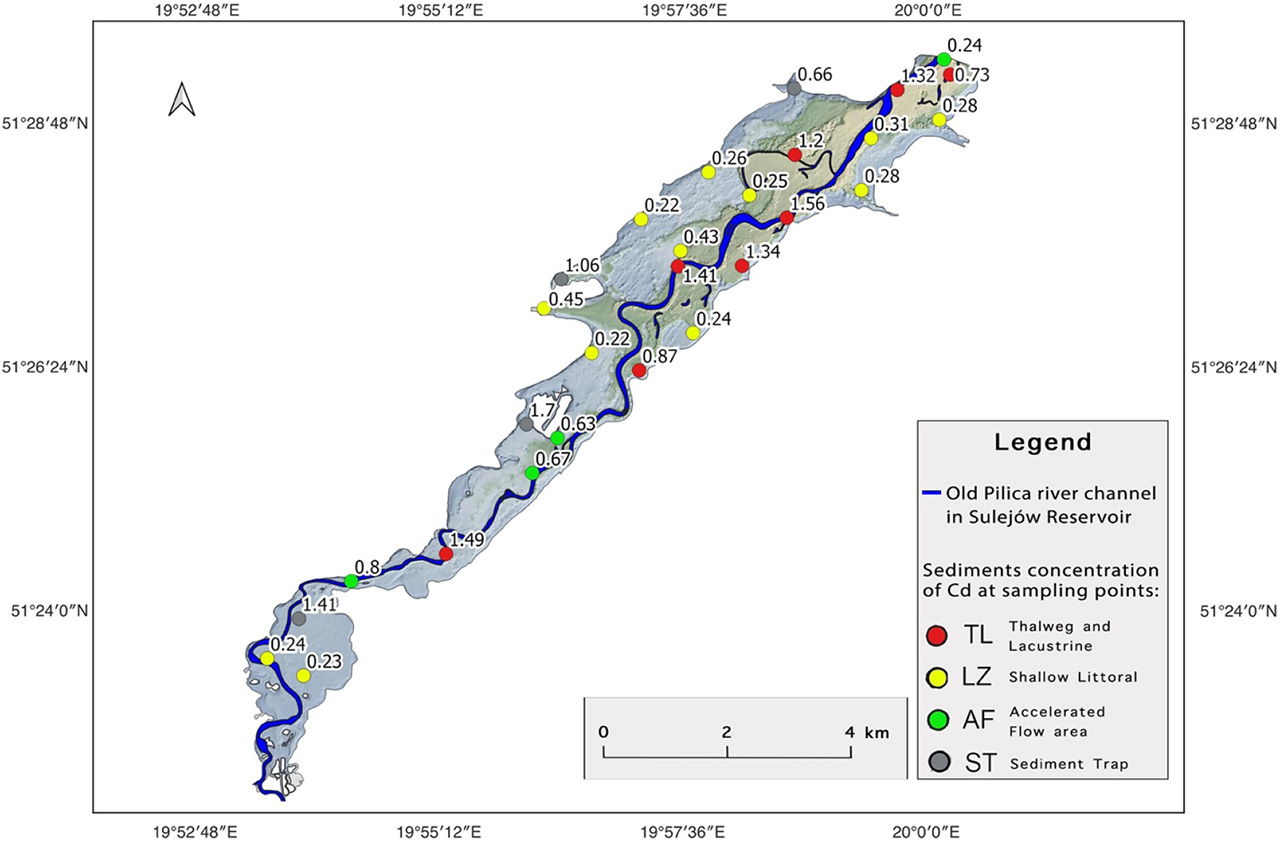
Figure 6.
Sulejów Reservoir bottom sediments concentration of Cadmium (Cd) at sampling points with different sedimentation conditions: TL – thalweg and lacustrine zone, LZ – shallow littoral zone, AF – accelerated flow area, ST – sediment trap
Source: own elaboration