
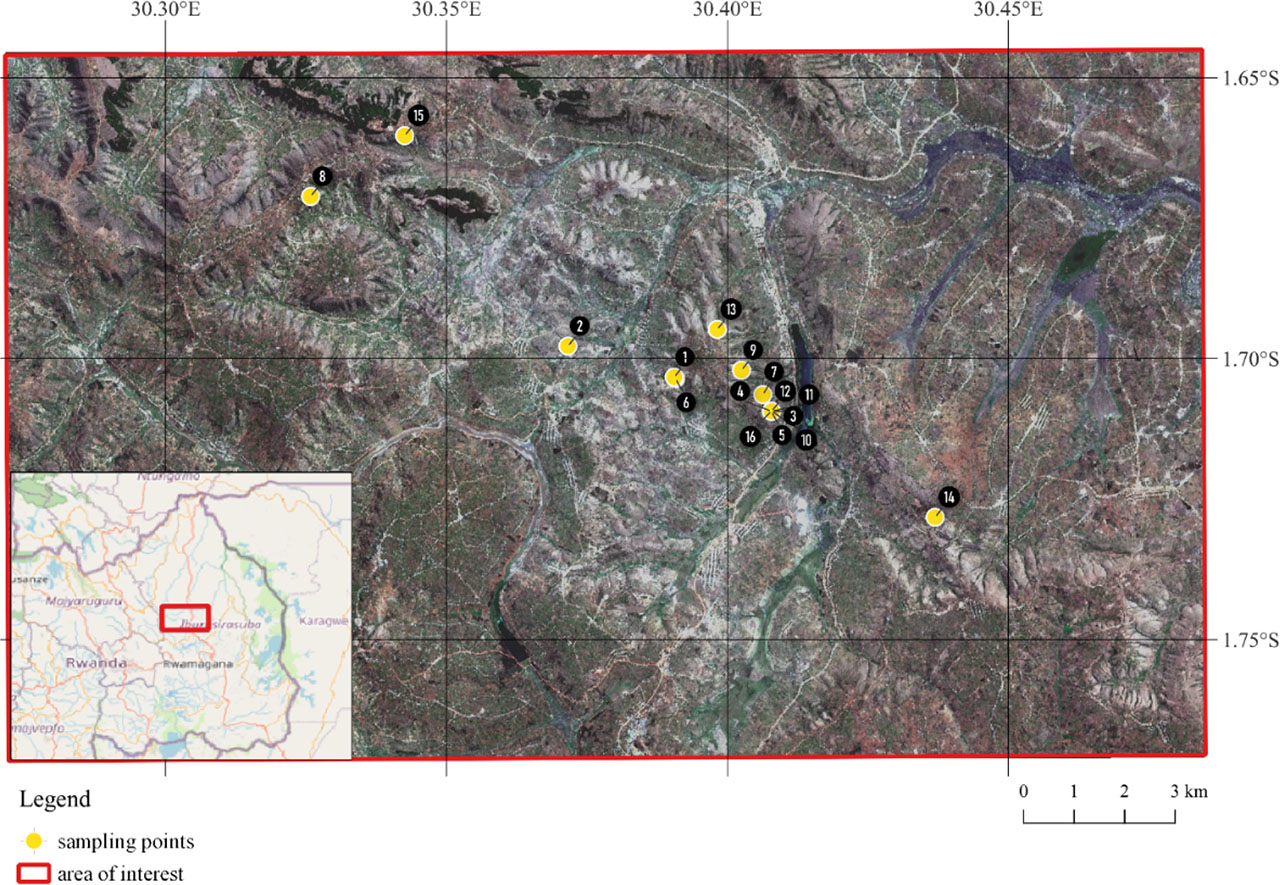
Figure 1.
Study area
Source: own elaboration
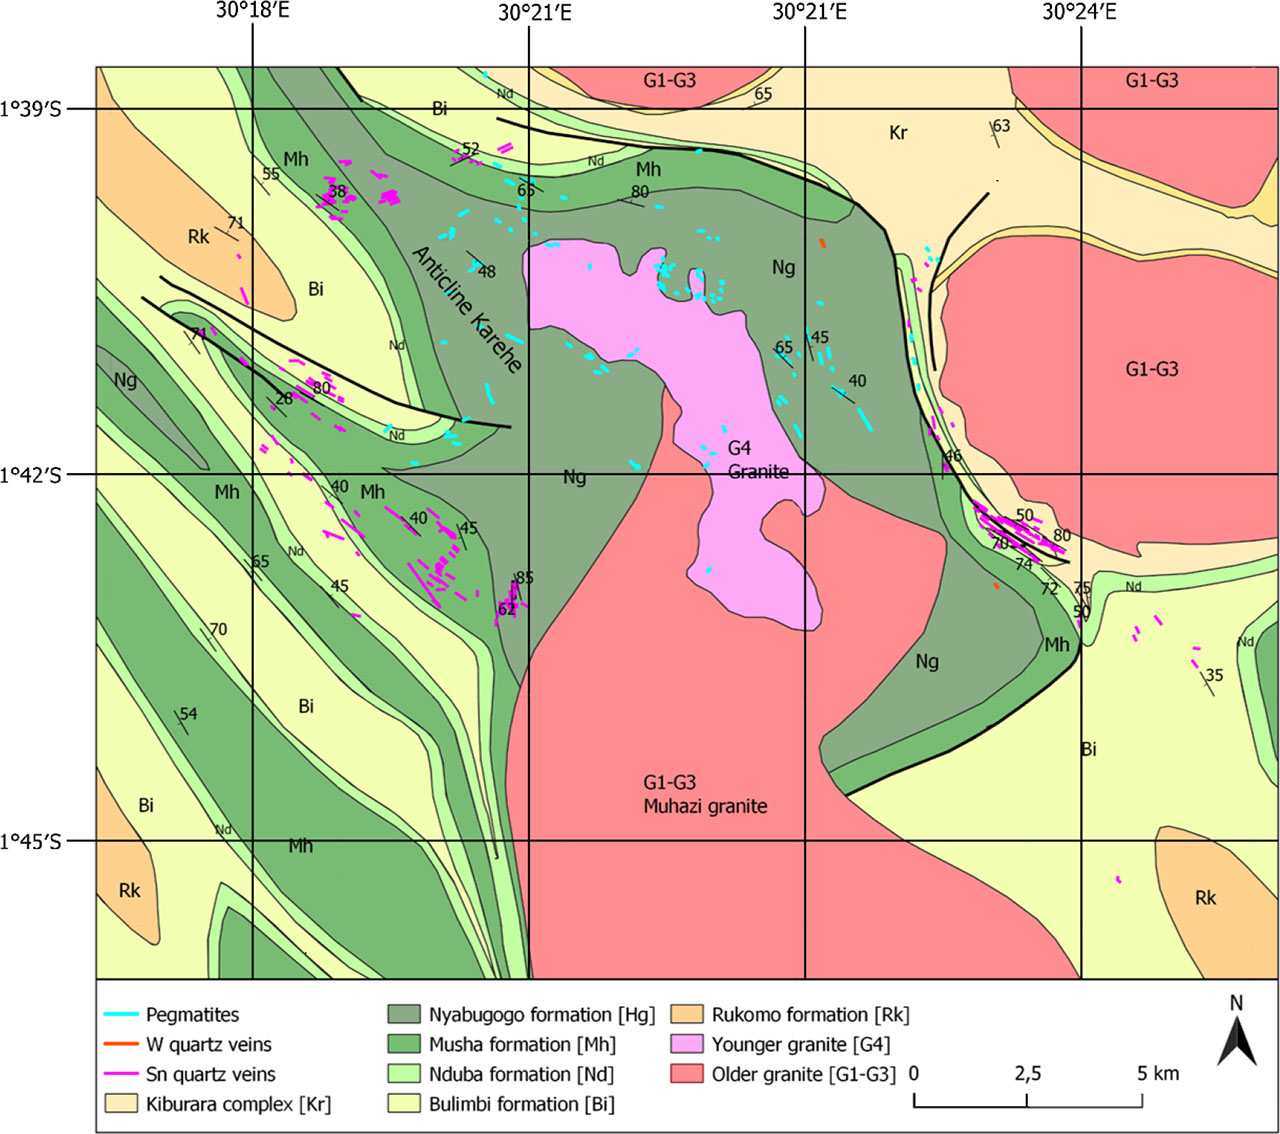
Figure 2.
Geological setting of Bugarura and Kuluti with cassiterite Sn mineralization age (numbers on the map). Modified after Hanon & Rusanganwa (1991)
Table 1.
List of samples. Source: own elaboration
| ID | Host rock | Mineral composition | Number of measurements (dry sample) |
|---|---|---|---|
| 1 | Altered granite | Quartz, feldspars, kaolinite, muscovite | 2 |
| 2 | Weathered granite | Feldspars, muscovite, biotite | 5 |
| 3 | Muscovite schist with tourmaline | Muscovite, tourmaline, clay minerals | 6 |
| 4 | Pegmatite | Kaolinite, quartz, muscovite | 3 |
| 5 | Pegmatite | Quartz, kaolinite, muscovite | 2 |
| 6 | Muscovite | Muscovite | 2 |
| 7 | Pegmatite | Mainly kaolinite + muscovite | 2 |
| 8 | Pegmatite | Kaolinite, quartz + very fine muscovite | 3 |
| 9 | Pegmatite | Kaolinite, quartz, muscovite | 4 |
| 10 | Greisen | Quartz, muscovite | 2 |
| 11 | Pegmatite | Kaolinite, quartz, muscovite | 3 |
| 12 | Tourmaline | Tourmaline + muscovite | 4 |
| 13 | Pegmatite | Kaolinite, muscovite, quartz | 3 |
| 14 | Tourmaline | Tourmaline | 2 |
| 15 | Quartz with tourmaline | Quartz, tourmaline | 3 |
| 16 | Pegmatite | Kaolinite, quartz, muscovite | 4 |
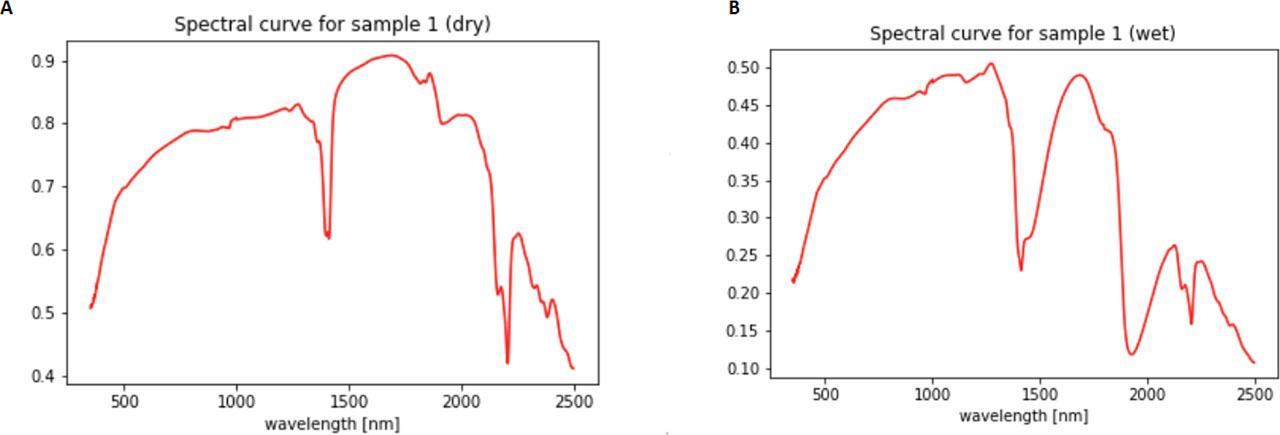
Figure 3.
(A) Spectral curve measured from spectroradiometer for sample 1 in the dry case and (B) in the wet case
Source: own elaboration
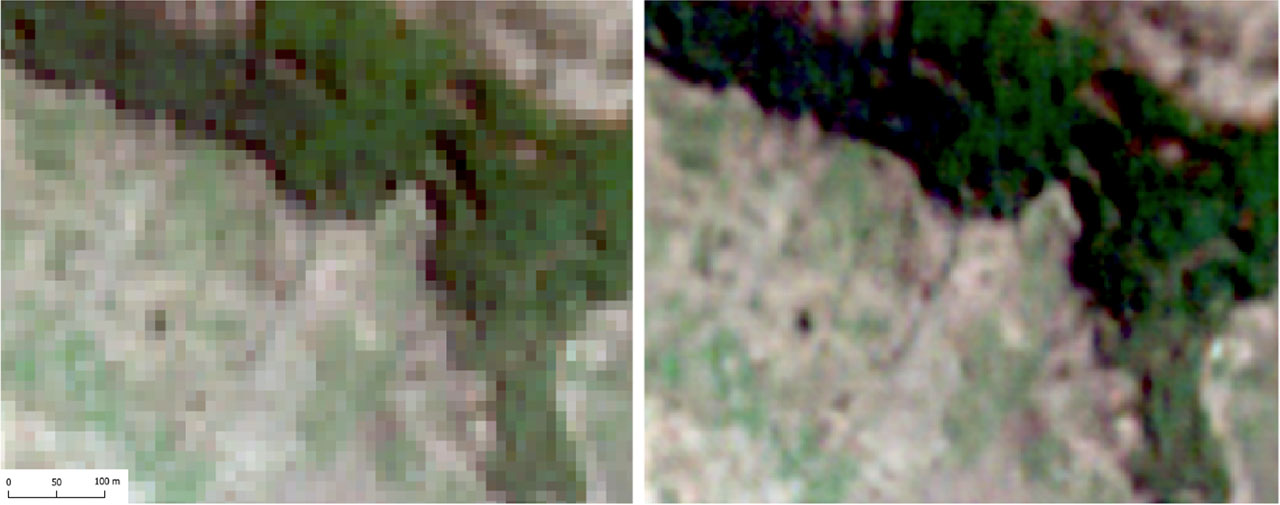
Figure 4.
Comparison of image quality for Sentinel-2 original data (left) and enhanced data (right)
Source: own elaboration
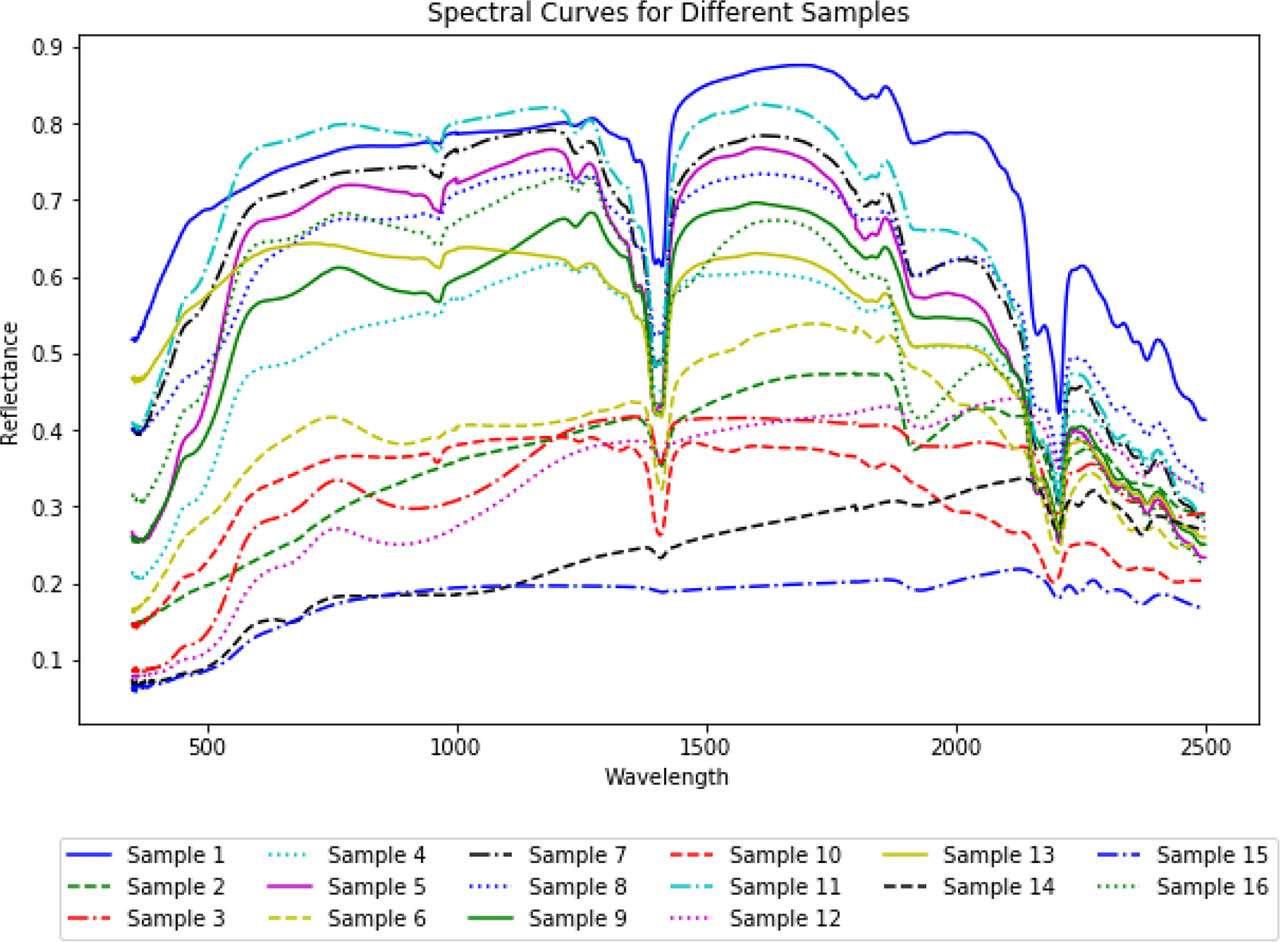
Figure 5.
Spectral curves obtained for all samples
Source: own elaboration
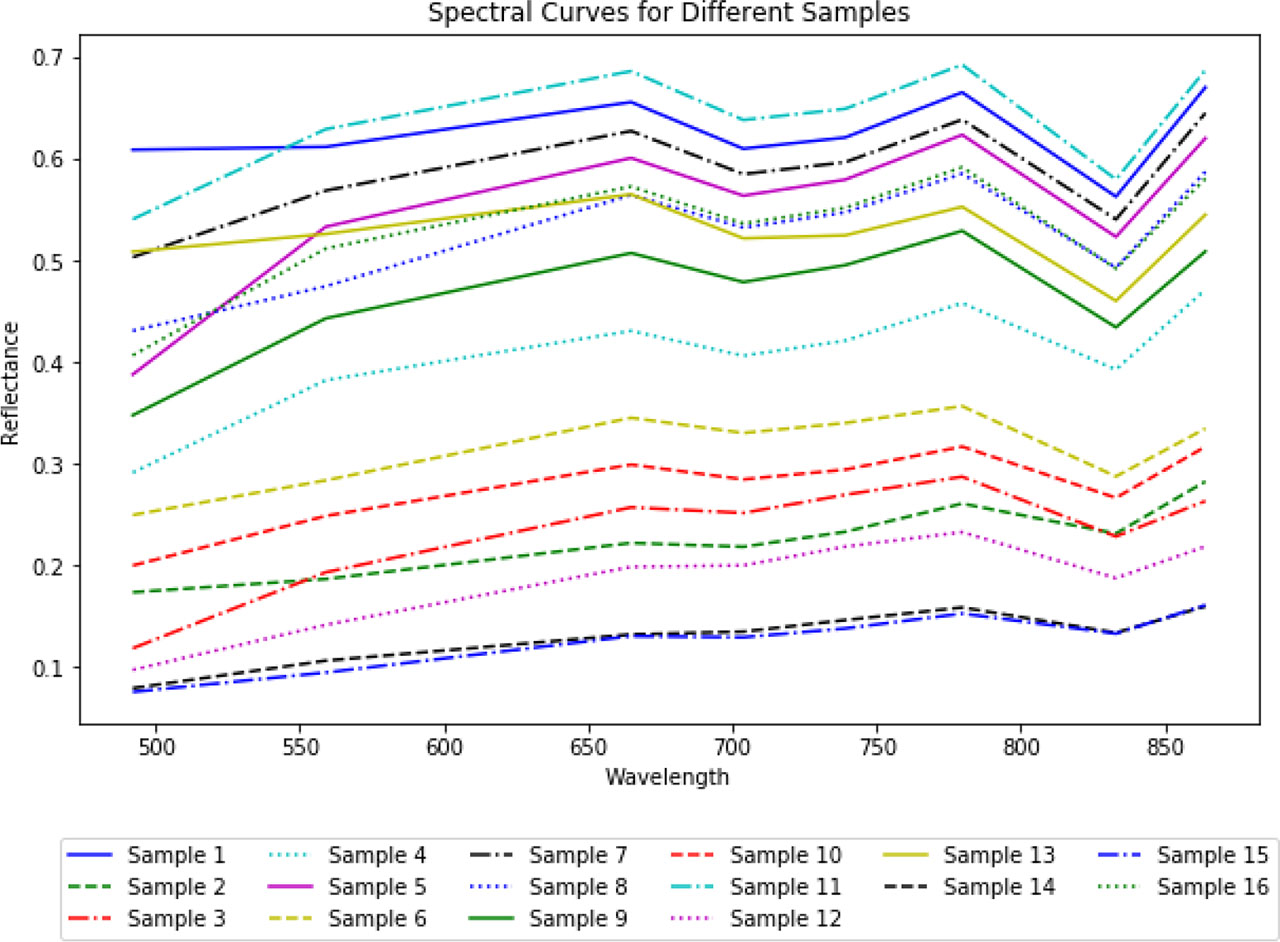
Figure 6.
Spectral curves obtained for all samples, averaged for Sentinel-2B bands
Source: own elaboration
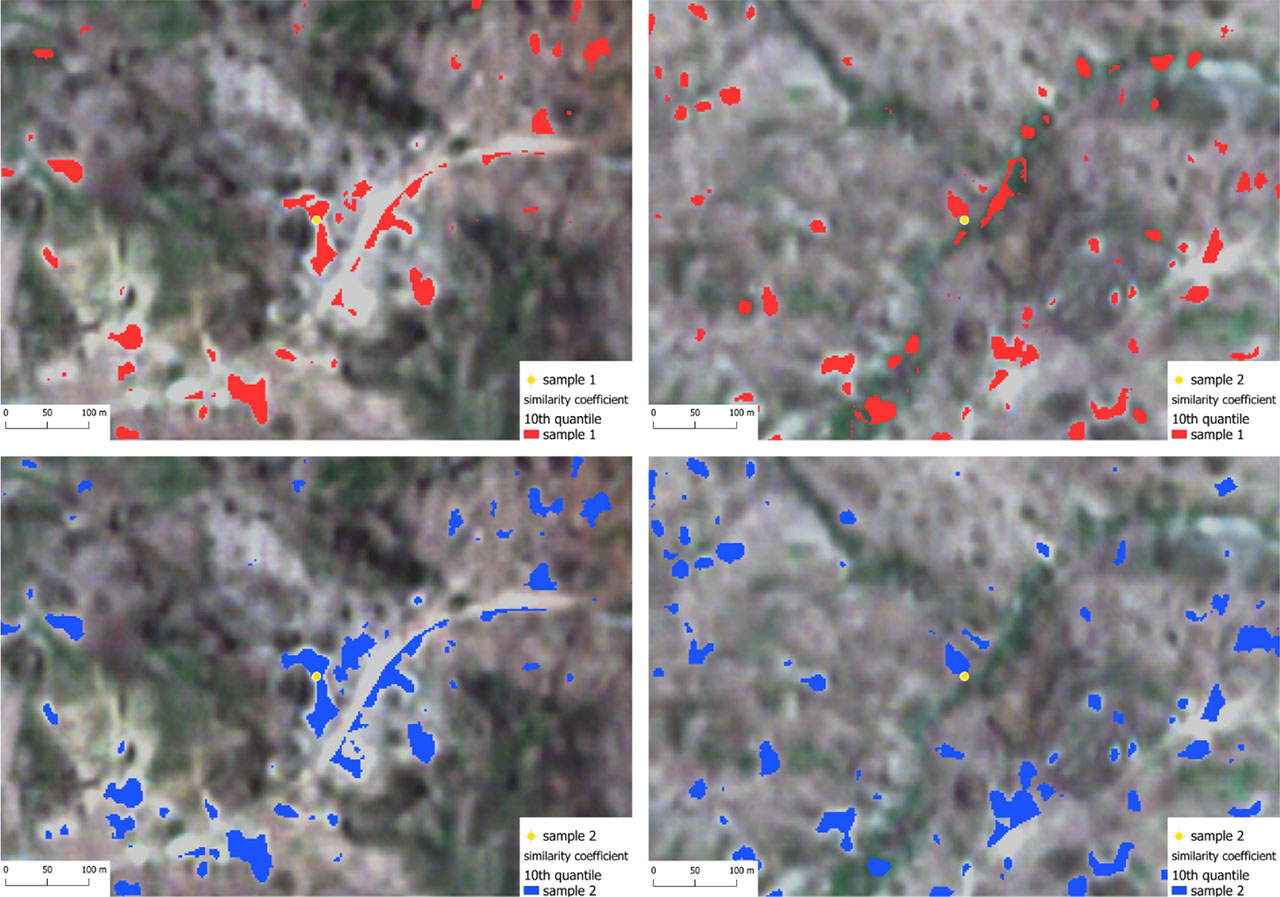
Figure 7.
Similarity coefficient for samples 1 and 2
Source: own elaboration
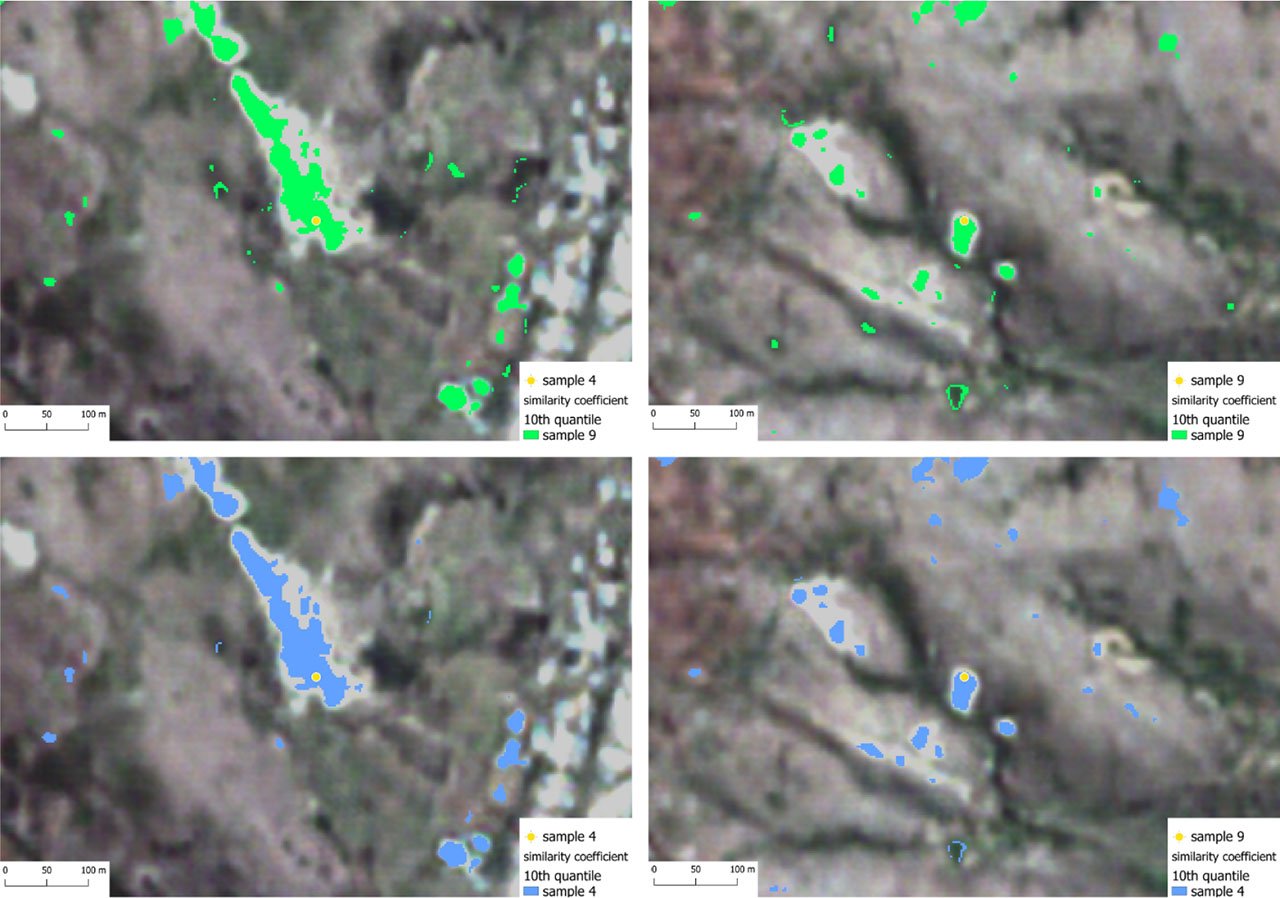
Figure 8.
Similarity coefficient for samples 4 and 9
Source: own elaboration
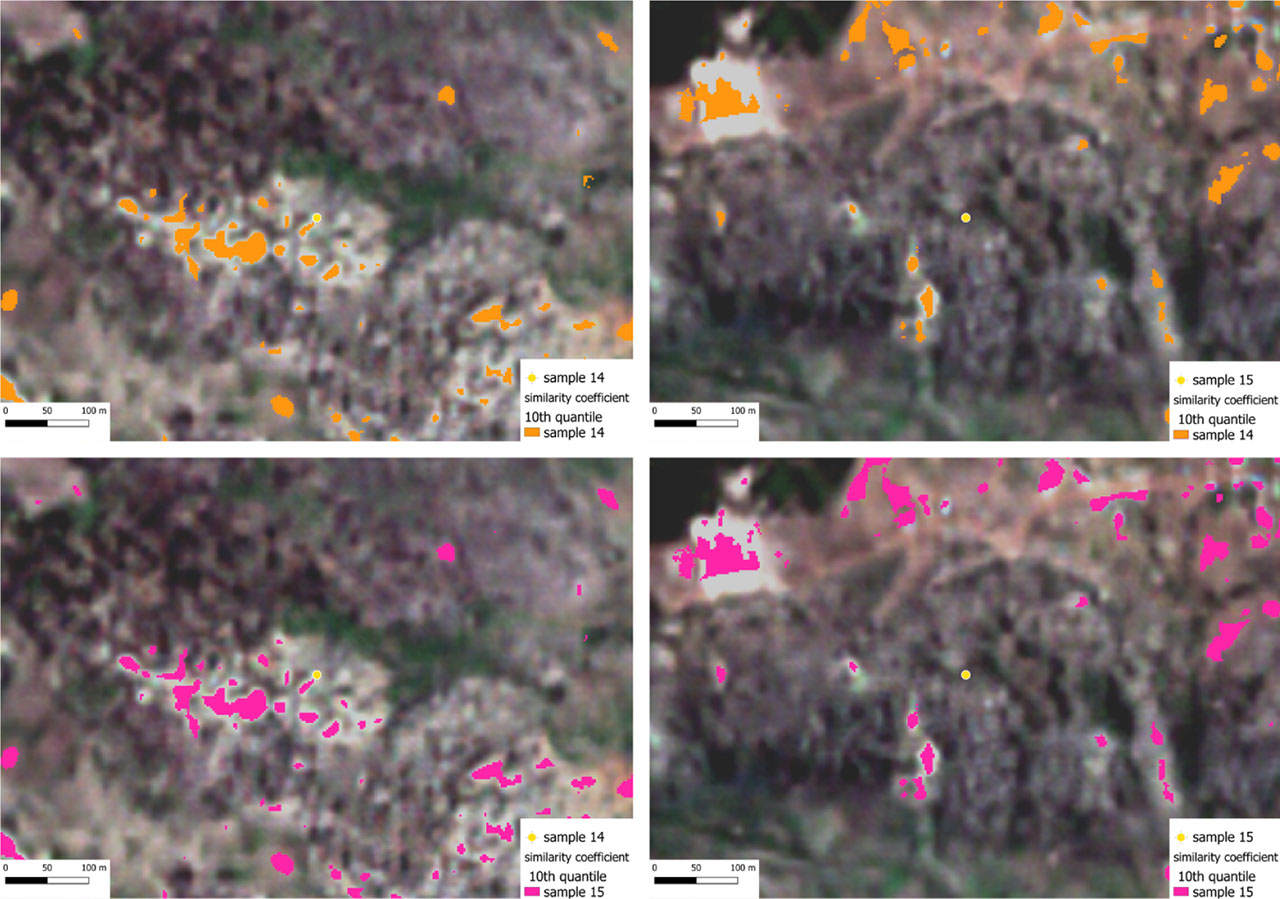
Figure 9.
Similarity coefficient for samples 14 and 15
Source: own elaboration