
Figure 1.
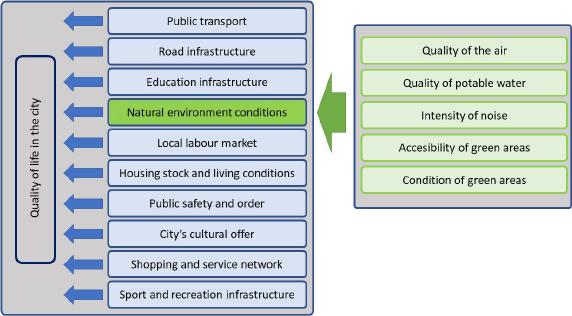
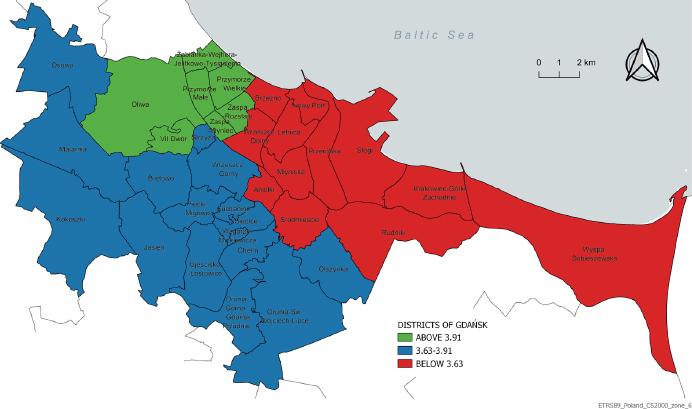
Figure 2.
Evaluation of the environmental conditions versus the social and demographic features of the respondents
| Independent variables | Arithmetic mean against the scale (1–6)* | Standard deviation | W Wilcoxon test, H Kruskal–Wallis test | Significance |
|---|---|---|---|---|
| Sex | ||||
| Female | 3.81 | 0.904 | W= 255813 | p < 0.05 |
| Male | 3.89 | 0.925 | ||
| Age | ||||
| Up to 24 | 4.02 | 0.998 | H = 23.1 | p < 0.001 |
| 25–39 | 3.90 | 0.830 | ||
| 40–59 | 3.81 | 0.843 | ||
| 60 and above | 3.73 | 0.975 | ||
| Length of time living in Gdańsk** | ||||
| Up to 3 years | 4.04 | 0.811 | H = 10.8 | p < 0.005 |
| 4 to 10 years | 3.93 | 0.854 | ||
| Longer than 10 years | 3.80 | 0.936 | ||
| Perceived opportunity to attain life goals | ||||
| Very good and fairly good | 3.93 | 0.864 | W = 121119 | p < 0.001 |
| Very poor or rather poor | 3.53 | 1.060 | ||
| Declared sense of happiness | ||||
| Absolutely yes and rather yes | 3.91 | 0.870 | W = 88968 | p < 0.001 |
| Definitely no or rather no | 3.50 | 1.020 |
Evaluation of the environmental conditions in the city district of residence
| Rating scale: 1–6 | ||||||||
|---|---|---|---|---|---|---|---|---|
| 1 | 2 | 3 | 4 | 5 | 6 | Hard to say | Average against the scale of 1–6 | |
| Accessibility of green areas | 5.6 | 5.9 | 13.7 | 30.3 | 27.1 | 15.3 | 2.1 | 4.16 |
| Quality of potable water | 2.5 | 2.9 | 11.5 | 33.8 | 22.5 | 6.8 | 20.2 | 4.14 |
| Condition of green areas | 5.8 | 6.1 | 16.7 | 34.9 | 24.9 | 8.8 | 2.8 | 3.96 |
| Quality of the air | 5.2 | 6.7 | 18.2 | 40.4 | 20.2 | 5.9 | 3.5 | 3.84 |
| Intensity of noise | 11.1 | 16.6 | 27.2 | 27.2 | 11.2 | 3.6 | 3.2 | 3.22 |
| IN AGGREGATE | 3.84 | |||||||