
Figure 1
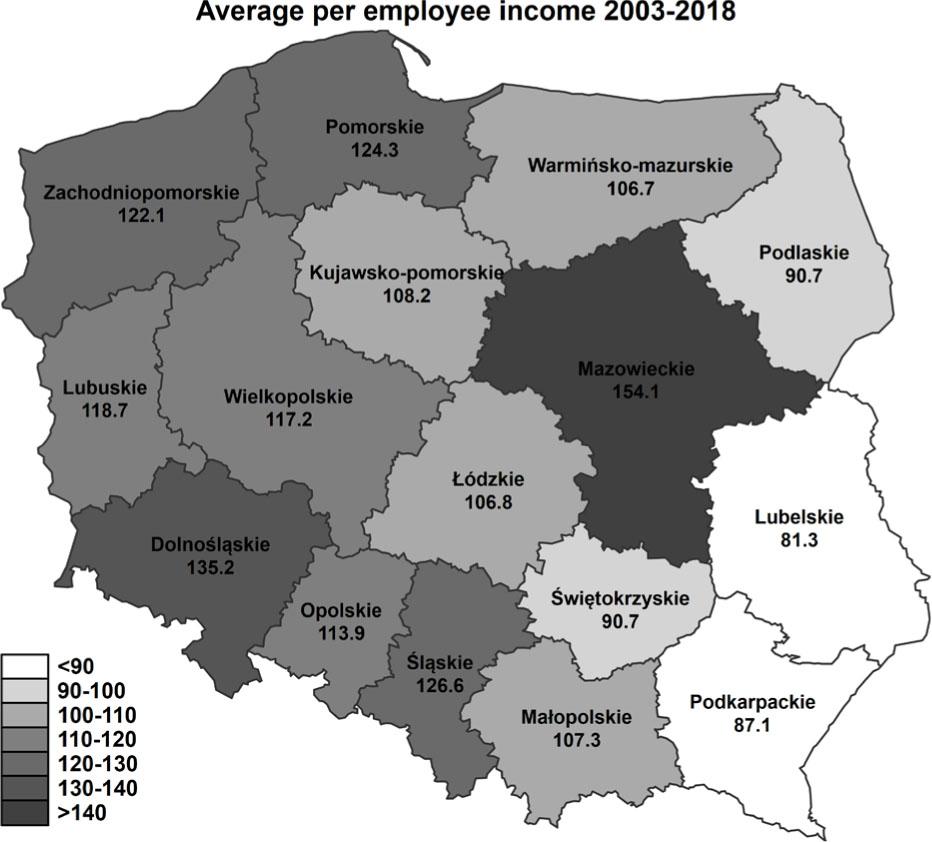
Figure 2
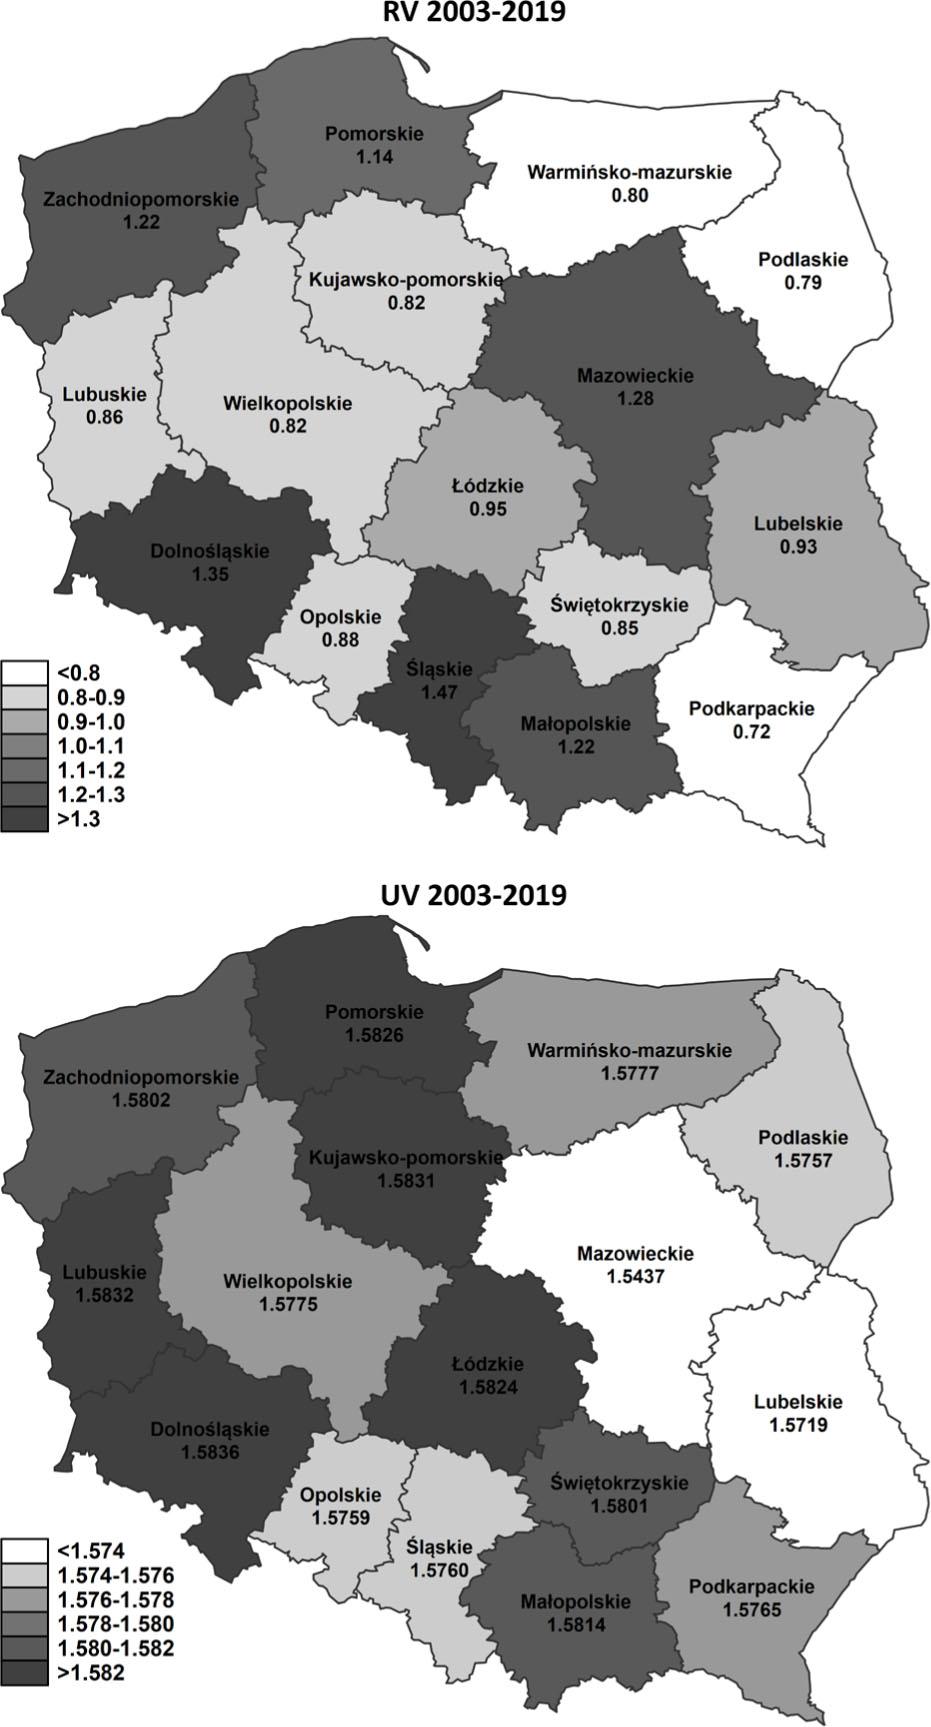
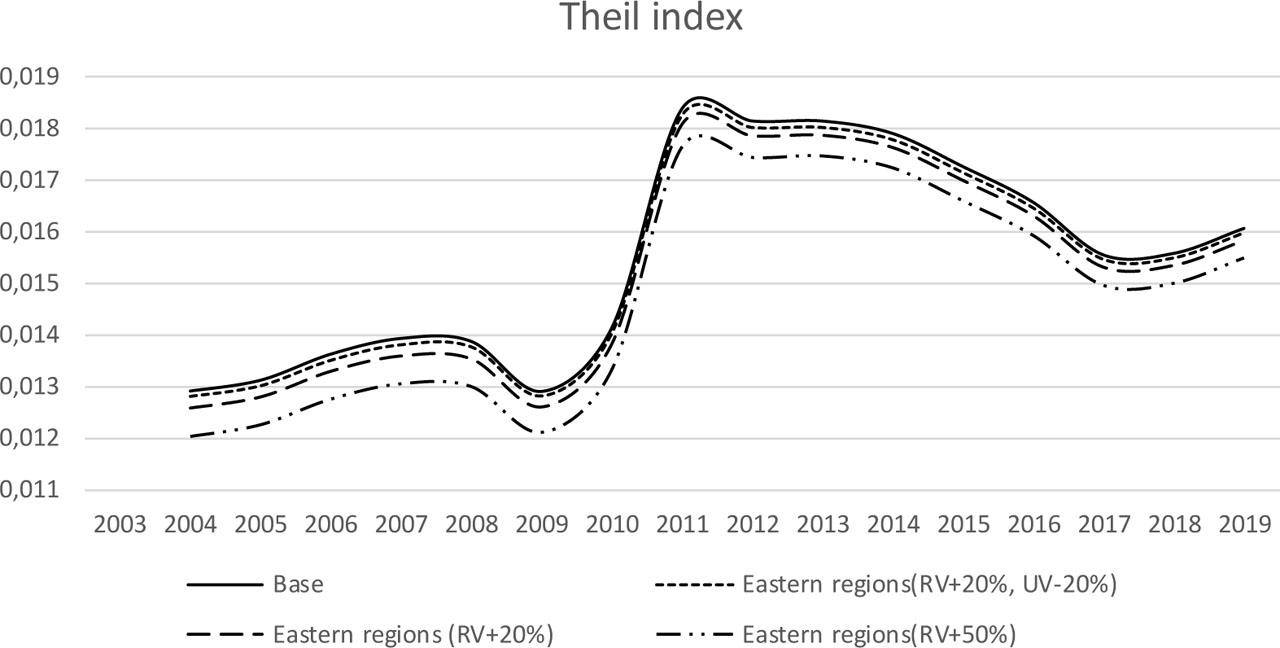
Figure 3
Correlation matrix and descriptive statistics
| Mean | SD | Max | Min | lnyit | lnkit | RVit | UVit | Urbanit | Openit | |
|---|---|---|---|---|---|---|---|---|---|---|
| 4.70 | 0.20 | 5.21 | 4.18 | lnyit | 1.00 | |||||
| 5.36 | 0.20 | 5.82 | 4.95 | lnkit | 0.86*** | 1.00 | ||||
| 1.01 | 0.23 | 1.52 | 0.67 | RVit | 0.60*** | 0.38*** | 1.00 | |||
| 1.58 | 0.01 | 1.58 | 1.53 | UVit | −0.29*** | −0.28*** | −0.19*** | 1.00 | ||
| 0.59 | 0.09 | 0.40 | 0.79 | Urbanit | 0.60*** | 0.43*** | 0.63*** | −0.01 | 1.00 | |
| 0.58 | 0.28 | 1.58 | 0.12 | Openit | 0.58*** | 0.37*** | 0.39*** | −0.01 | 0.48*** | 1.00 |
Estimation results – Dependent variable: lnyit
| Poland – all regions | Western Poland 11 regions | |||||
|---|---|---|---|---|---|---|
| (1) | (2) | (3) | (1) | (2) | (3) | |
| lnyit-1 | 0.7623*** (0.0669) | 0.7187*** (0.0603) | 0.7191*** (0.0579) | 0.6802*** (0.0965) | 0.7189*** (0.1017) | 0.7008*** (0.1216) |
| lnkit | 0.1487*** (0.0374) | 0.1528*** (0.0375) | 0.1497*** (0.0361) | 0.1783** (0.0673) | 0.1509* (0.0728) | 0.1512* (0.0746) |
| Urban | 0.0891** (0.0405) | 0.1554*** (0.0423) | 0.1001** (0.0460) | 0.0132 (0.0458) | 0.1000 (0.0934) | 0.0069 (0.0442) |
| RVit | 0.04625** (0.0203) | - | 0.0436* (0.0231) | 0.0558** (0.0239) | - | 0.0518* (0.0284) |
| UVit | - | −0.6956** (0.3237) | −0.5499* (0.3141) | - | −0.9337* (0.4366) | −0.8277* (0.4044) |
| openit | 0.0330* (0.0183) | 0.0415* (0.0209) | 0.0375** (0.0175) | 0.0215 (0.0230) | 0.0101 (0.0184) | 0.0169 (0.0237) |
| Const. | 0.3650** (0.1279) | 1.5063** (0.5424) | 1.2822** (0.5013) | 0.5043** (0.1484) | 1.9528** (0.8433) | 1.8678** (0.7745) |
| AR(1) test | −2.75 [0.006] | −2.73 [0.006] | −2.75 [0.006] | −2.42 [0.016] | −2.33 [0.020] | −2.40 [0.016] |
| AR(2) test | −1.00 [0.316] | −0.94 [0.349] | −0.99 [0.321] | −1.07 [0.284] | −0.99 [0.320] | −1.05 [0.293] |
| Hansen test | 0.04 [0.839] | 0.03 [0.869] | 0.04 [0.843] | 0.27 [0.605] | 1.55 [0.213] | 1.70 [0.192] |
| F test | 641.22 [0.000] | 713.13 [0.000] | 888.46 [0.000] | 770.72 [0.000] | 828.53 [0.000] | 520.39 [0.000] |
| Number of observations | 240 | 240 | 240 | 165 | 165 | 165 |
| Number of instruments | 7 | 7 | 8 | 7 | 7 | 8 |