
Figure 1
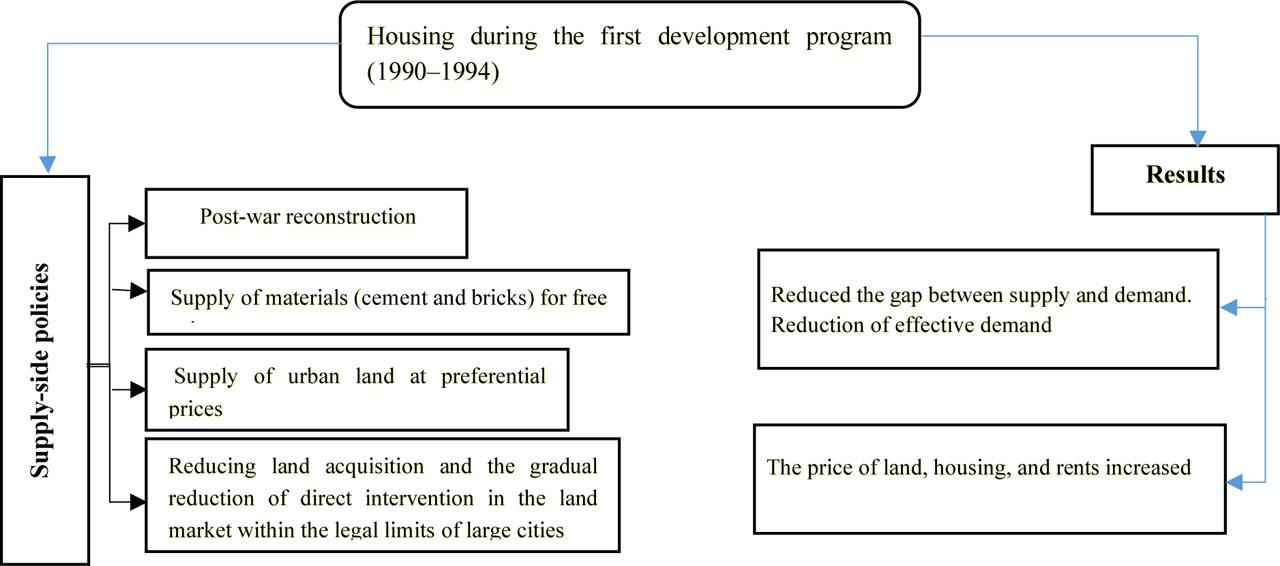
Figure 2
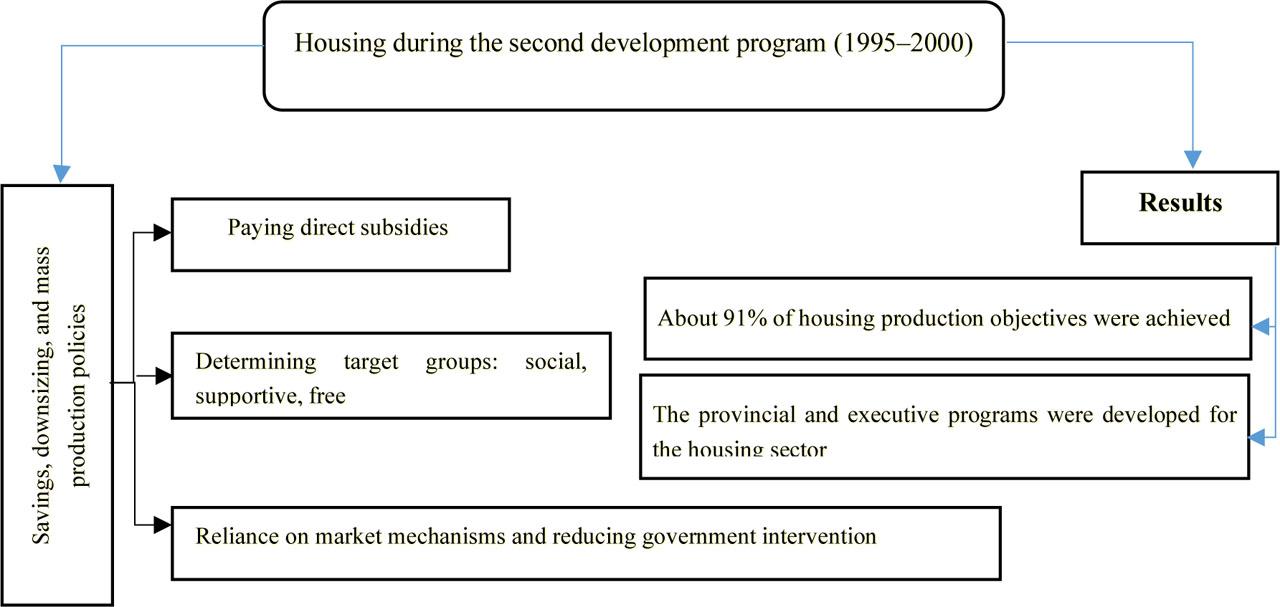
Figure 3
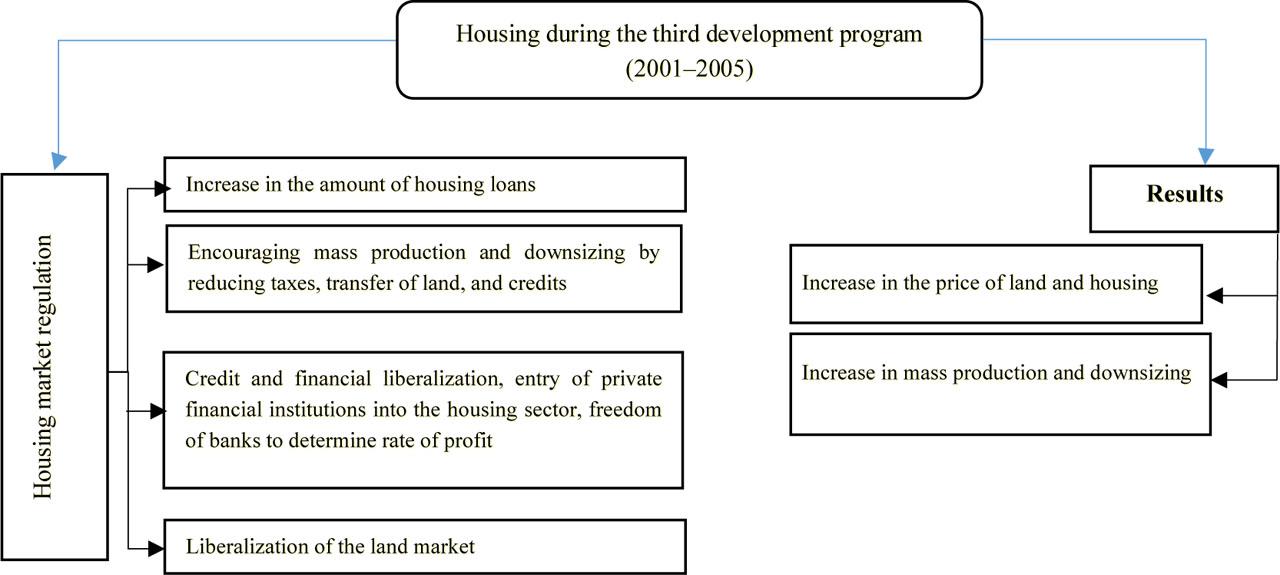
Figure 4

Shortcomings and successes of the housing sector during the third development program
| Shortcomings | Successes |
|---|---|
|
|
Shortcomings and successes of the first development program
| Shortcomings | Successes |
|---|---|
|
|
Shortcomings and successes of the housing sector during the second development program
| Shortcomings | Successes |
|---|---|
|
|
Housing problems during the third development program
| Production, supply, and demand problems | Planning constraint problems |
|---|---|
|
|
General characteristics of the housing sector during six development programs
| Program | Policies | Strategies | Objectives | Performance |
|---|---|---|---|---|
| First program | Supportive land | Direct government intervention in the land market. | Provision of low-cost land. | Due to the high share of land in the production costs and the complexity of rules, housing plans failed to achieve their objectives. |
| Second program | Supportive land | Supporting housing production. Savings, downsizing, and mass production. | Land preparation. | Due to the lack of investment in housing, the lack of incentive mechanisms, and the reluctance of private investors, this program failed to achieve its goals. |
| Third program | Supportive housing | Establishing associations and local institutions to provide low-income housing. | Production of residential units was in line with quantitative targets, and it was successful between 2001 and 2004. | |
| Fourth program | Supportive housing | Provision of housing master plan. The Mehr housing policy. | Preparation of housing master plan document. | In fact, the Mehr housing program was temporarily removed from the government's agenda. However, due to increasing demand in the housing sector, it once again became important, and the government allocated special financial resources to complete the Mehr housing project. |
| Fifth program | Revision of previous policies | Housing provision for low-income groups. | Mehr housing projects continued, but a significant portion of the housing was not delivered. | |
| Sixth program | Urban regeneration | Completion of Mehr housing projects. | 10% annual regeneration in worn textures. | About 40% of dilapidated textures were regenerated. |
Problems and consequences of the first development program
| Problems | Consequences |
|---|---|
| Mismatch between housing policy and urban development policies | The supplying of land around small and medium cities. |
| Lack of production factors | Due to the increase in building construction, prices of construction materials rose sharply. The price increase was a deterrent because the middle and low-income classes could not afford to build houses. |
| Population planning at the national level | Despite population control policies being in place during the years 1987–1992, the population growth rate was not reduced. |
| Laws, regulations, and standards | There were many shortcomings in the landlord and tenant act. |
Reasons for the failure of housing sector objectives in the second program
| Problems | Reasons |
|---|---|
| Governmental | Inappropriate participation of institutions related to the housing sector, especially at the municipality level. |
| Private | Reduction in effective demand due to lower per capita income. |
Shortcomings and successes of the housing sector during the fifth development program
| Shortcomings | Successes |
|---|---|
|
|
Number of Mehr units by city type and project type
| City type | Owner-developer units | Tripartite Agreement units | Cooperative units | Total | |||
|---|---|---|---|---|---|---|---|
| Share (percentage) | Units | Share (percentage) | Units | Share (percentage) | Units | ||
| More than 25k | 67% | 608,875 | 44% | 239,798 | 65% | 390,199 | 1,238,872 |
| Less than 25k | 29% | 267,941 | 0% | 20 | 23% | 134732 | 402,693 |
| New cities | 4% | 33,797 | 56% | 305,189 | 12% | 74297 | 413,283 |
| Total | 100% | 910,613 | 100% | 545,007 | 100% | 599228 | 2,054,848 |