
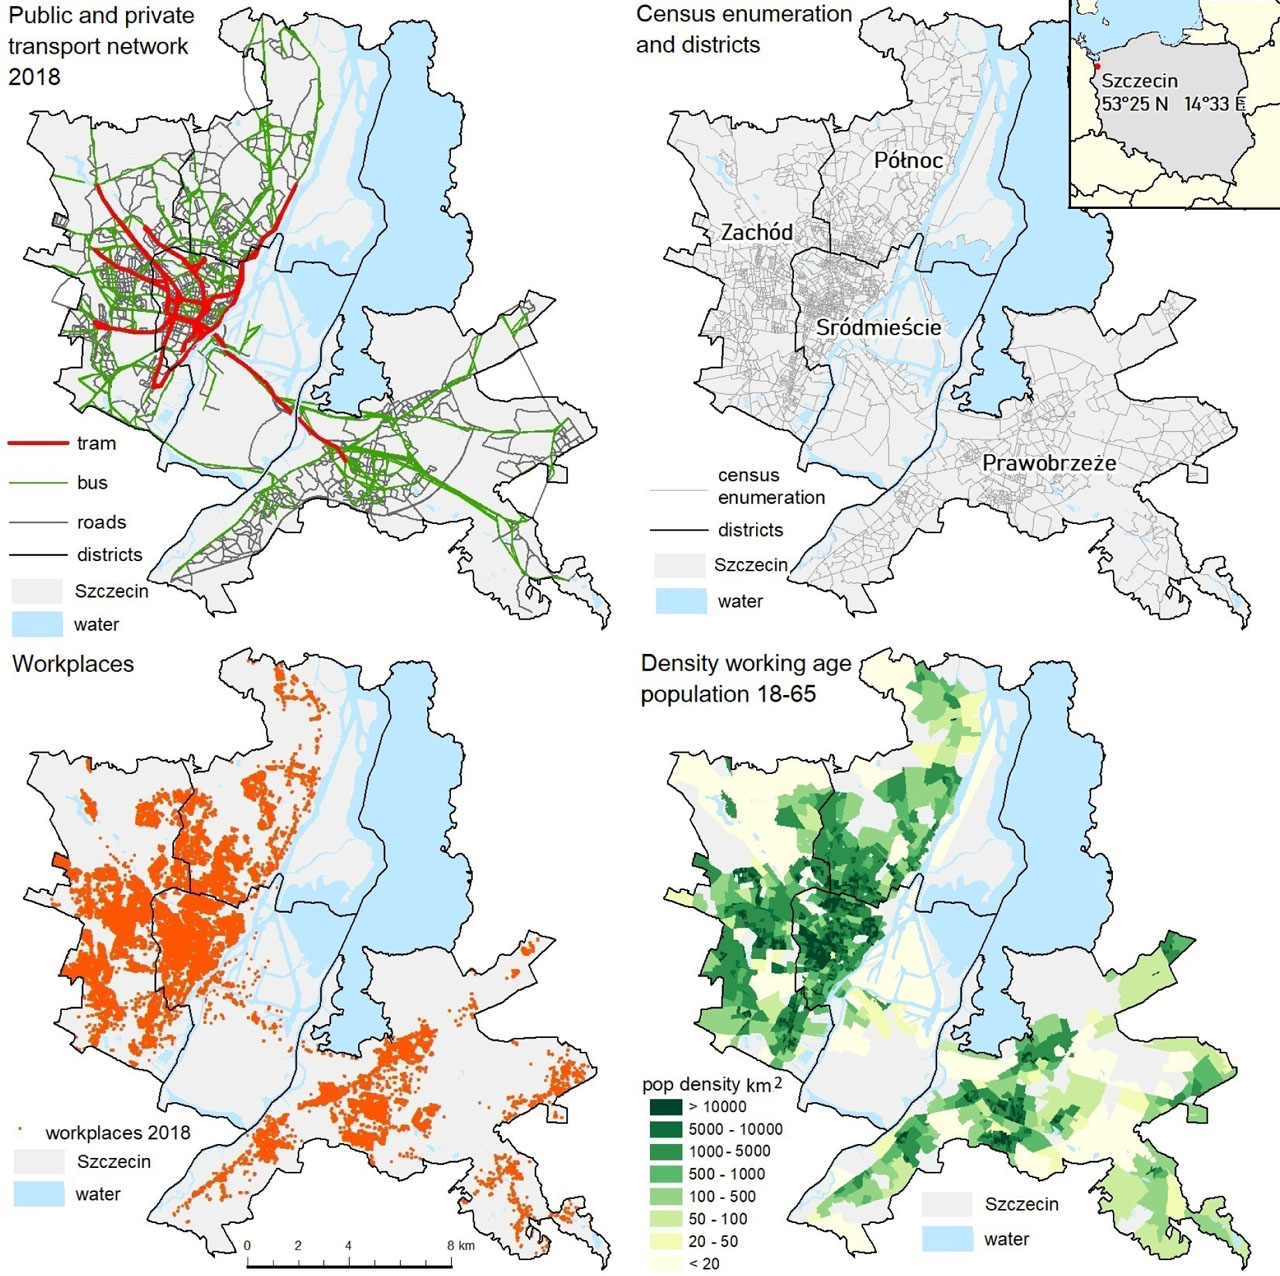
Figure 1
Spatial distribution by: PuT (public transport routes) and PrT (private car routes), census enumeration and districts, work-places 2018 and working-age population (18–60 for women and 18–65 for men)
Source: elaboration – own study based on GTFS and City Hall data
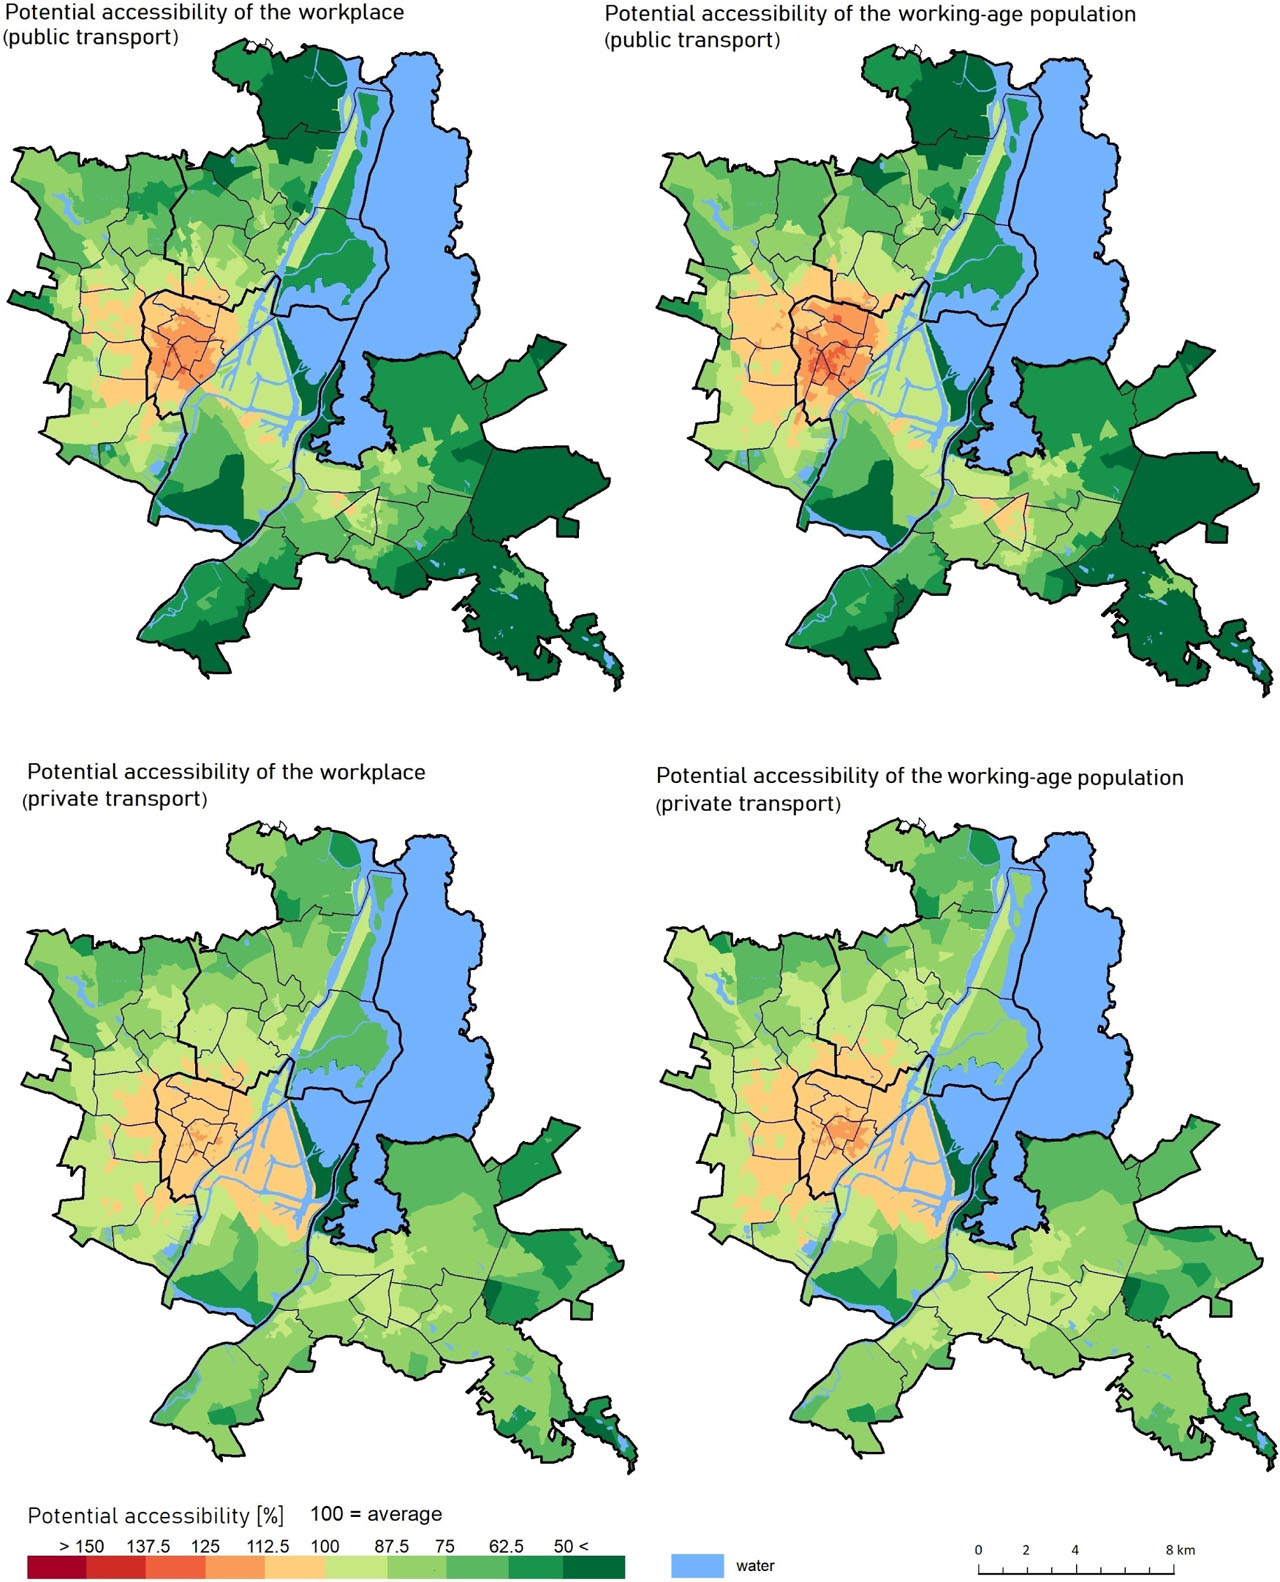
Figure 2
Potential accessibility of working-age population and jobs by public and private transport
Source: own elaboration
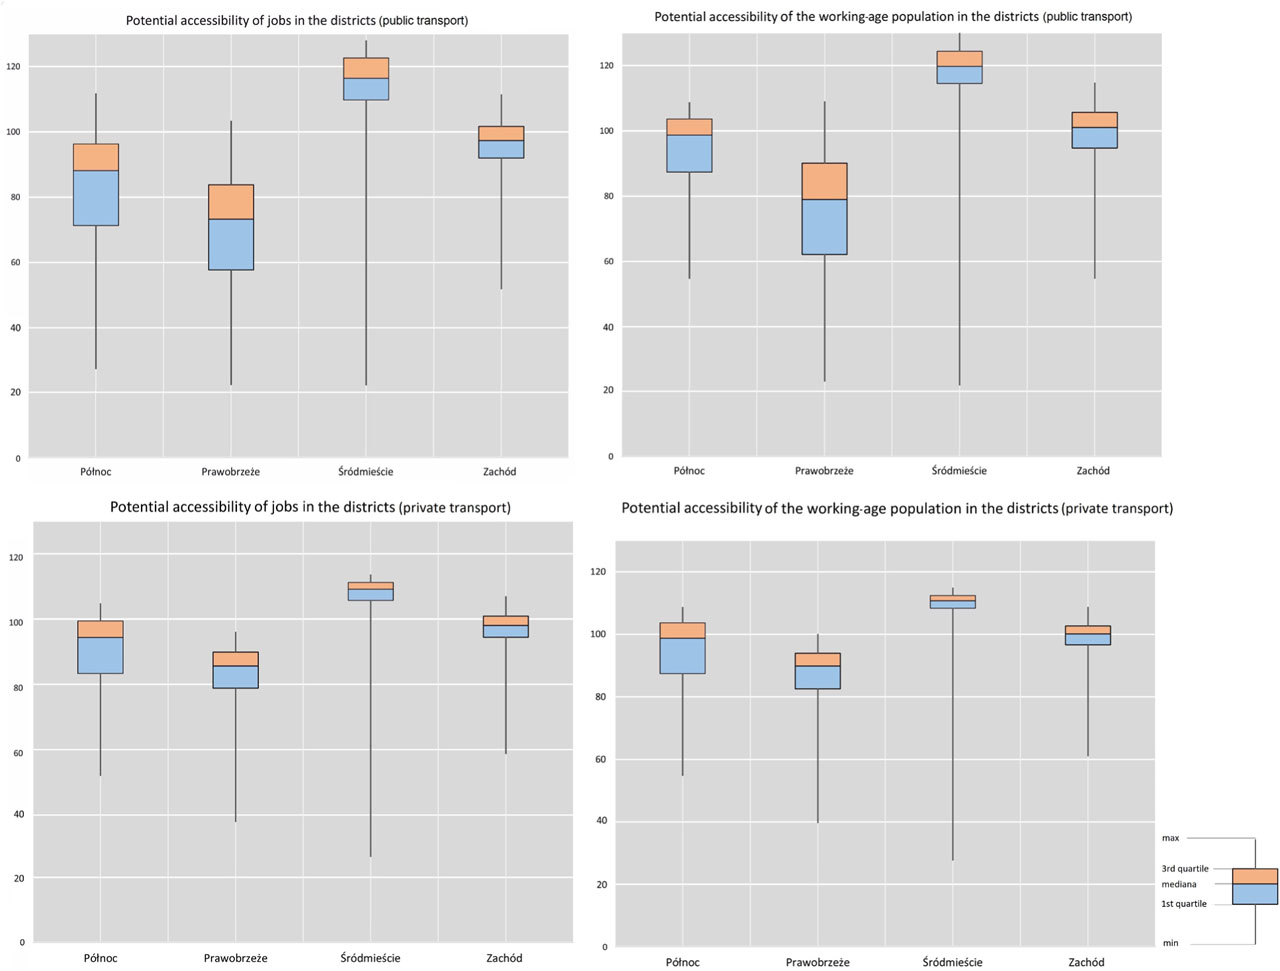
Figure 3
The results of the division accessibility and the working-age population by public and private transport, divided into districts
Source: own elaboration
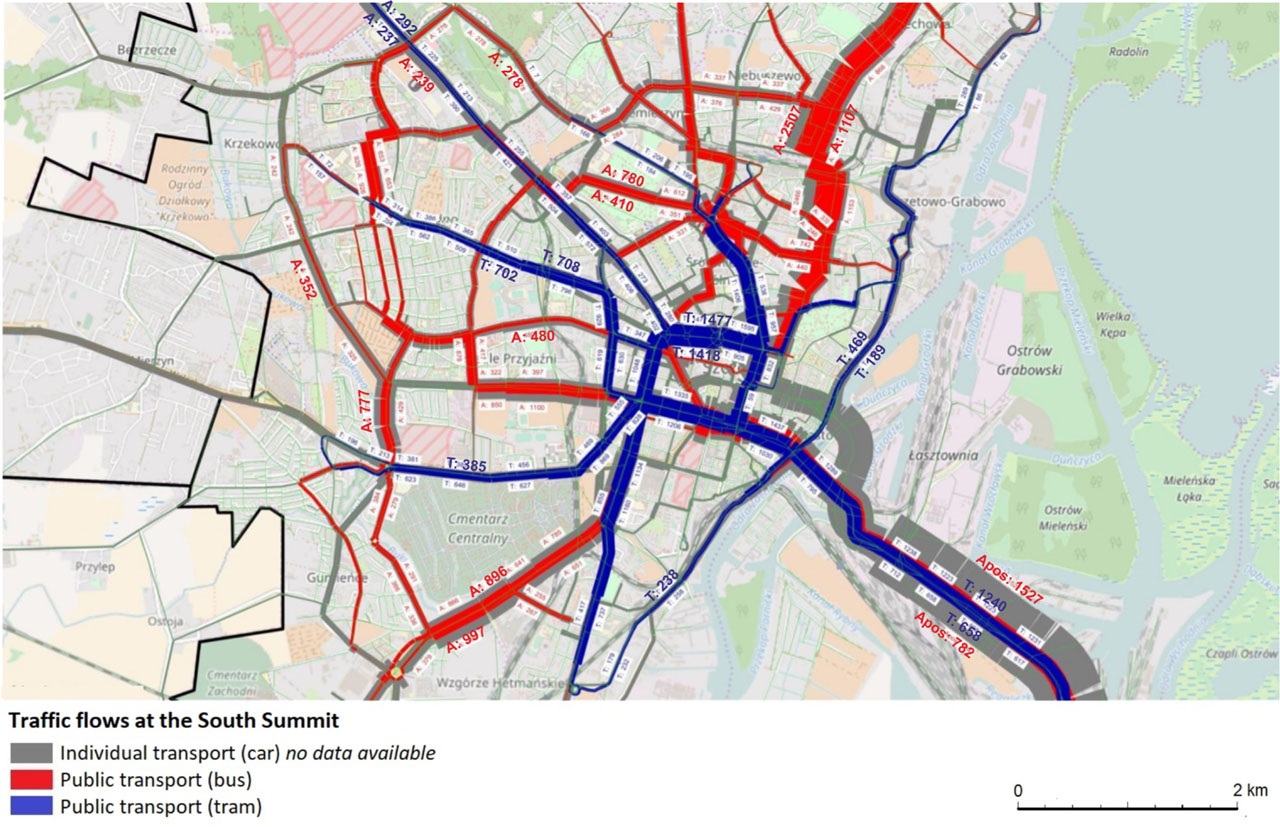
Figure 4
Load of public and individual communication networks at the South Summit in the afternoon – model 2016
Source: Comprehensive Traffic Research in Szczecin 2016
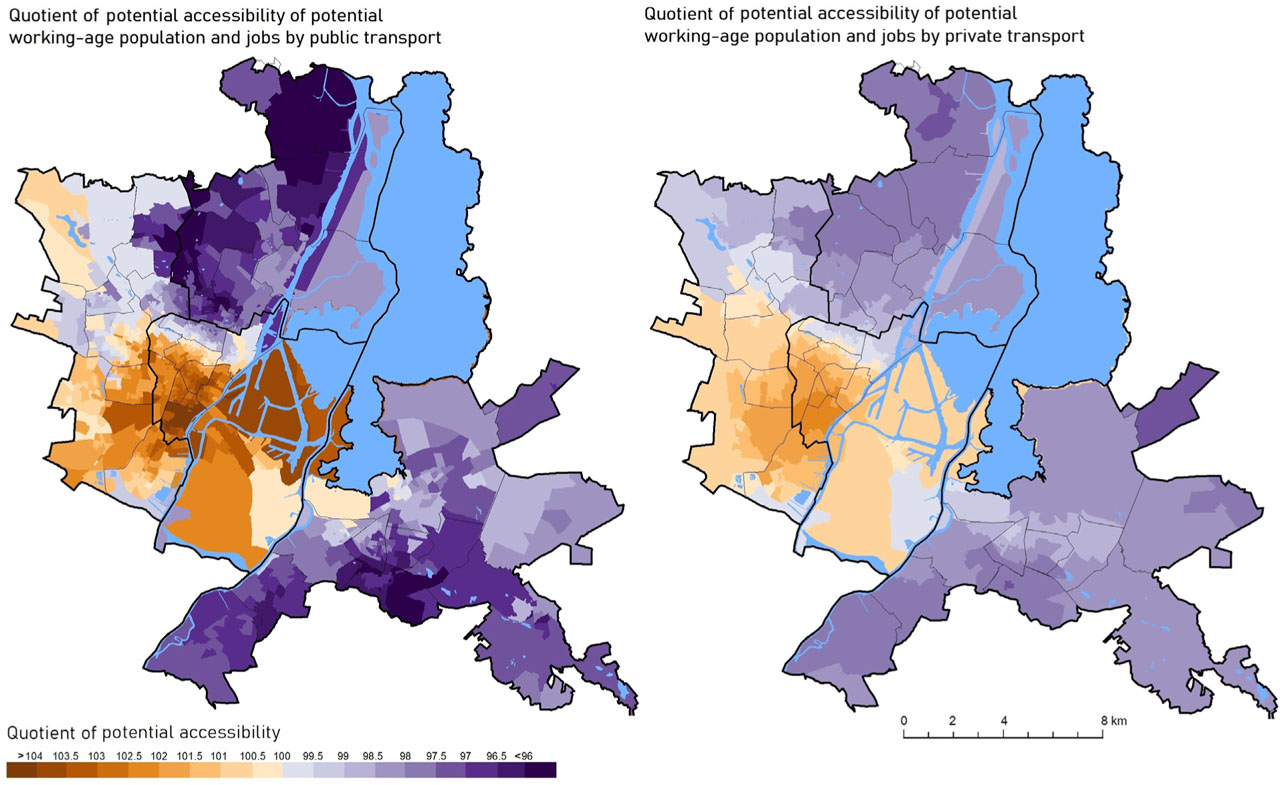
Figure 5
The quotient of the working-age population potential and jobs by public and private transport
Source: own elaboration
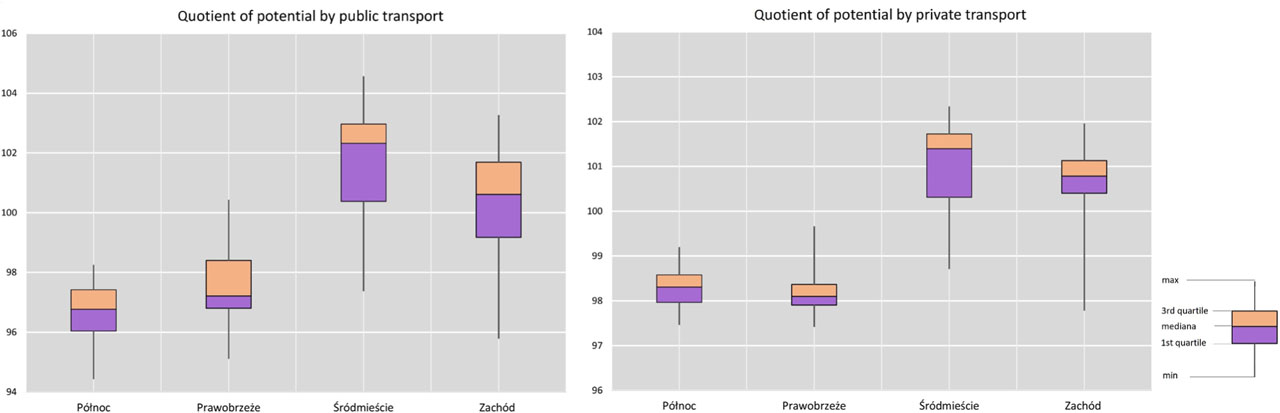
Figure 6
The results of the quotient of the potential of the working-age population by public and private transport, broken down into districts
Source: own elaboration