
Figure 1
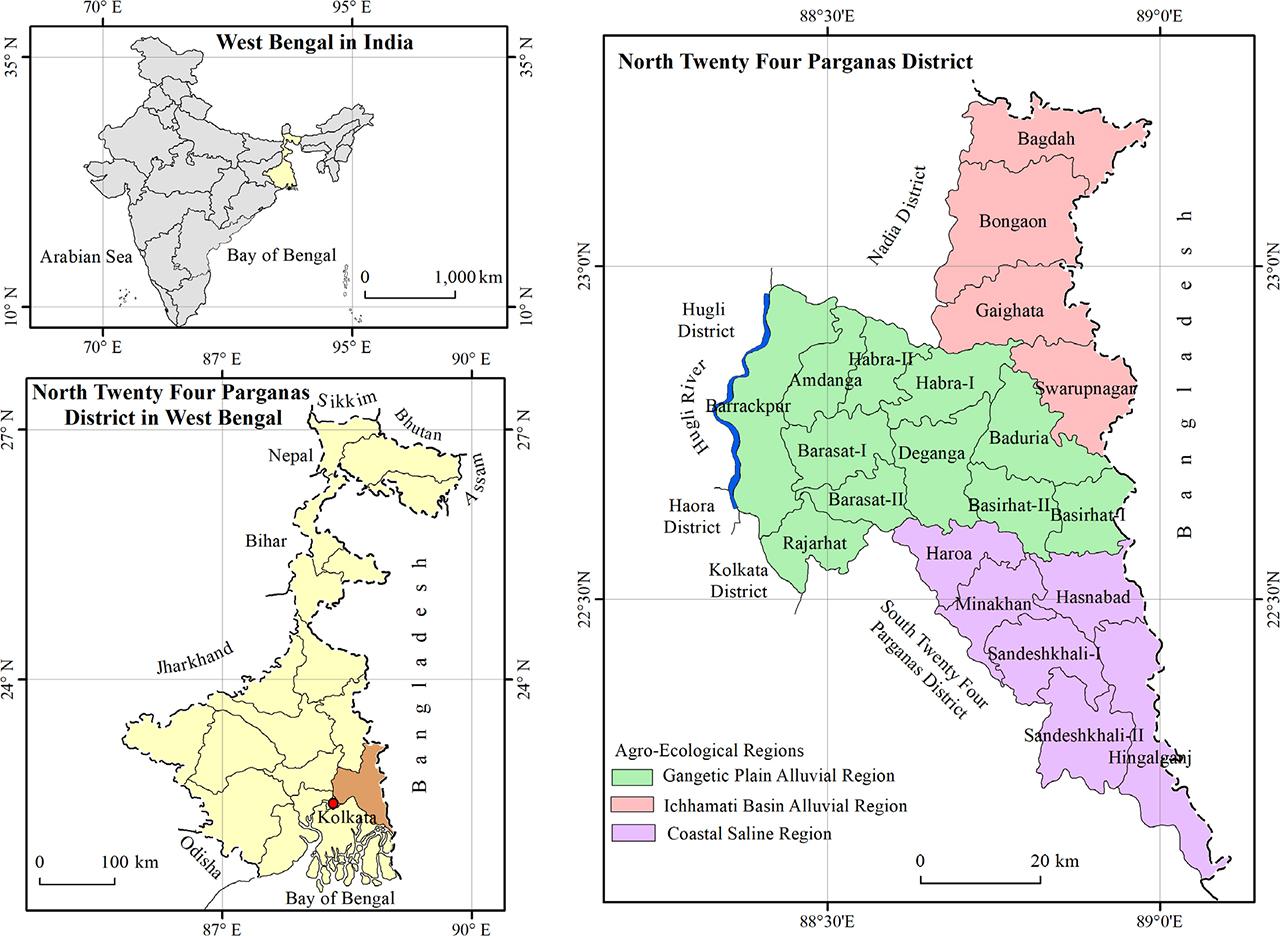
Figure 2
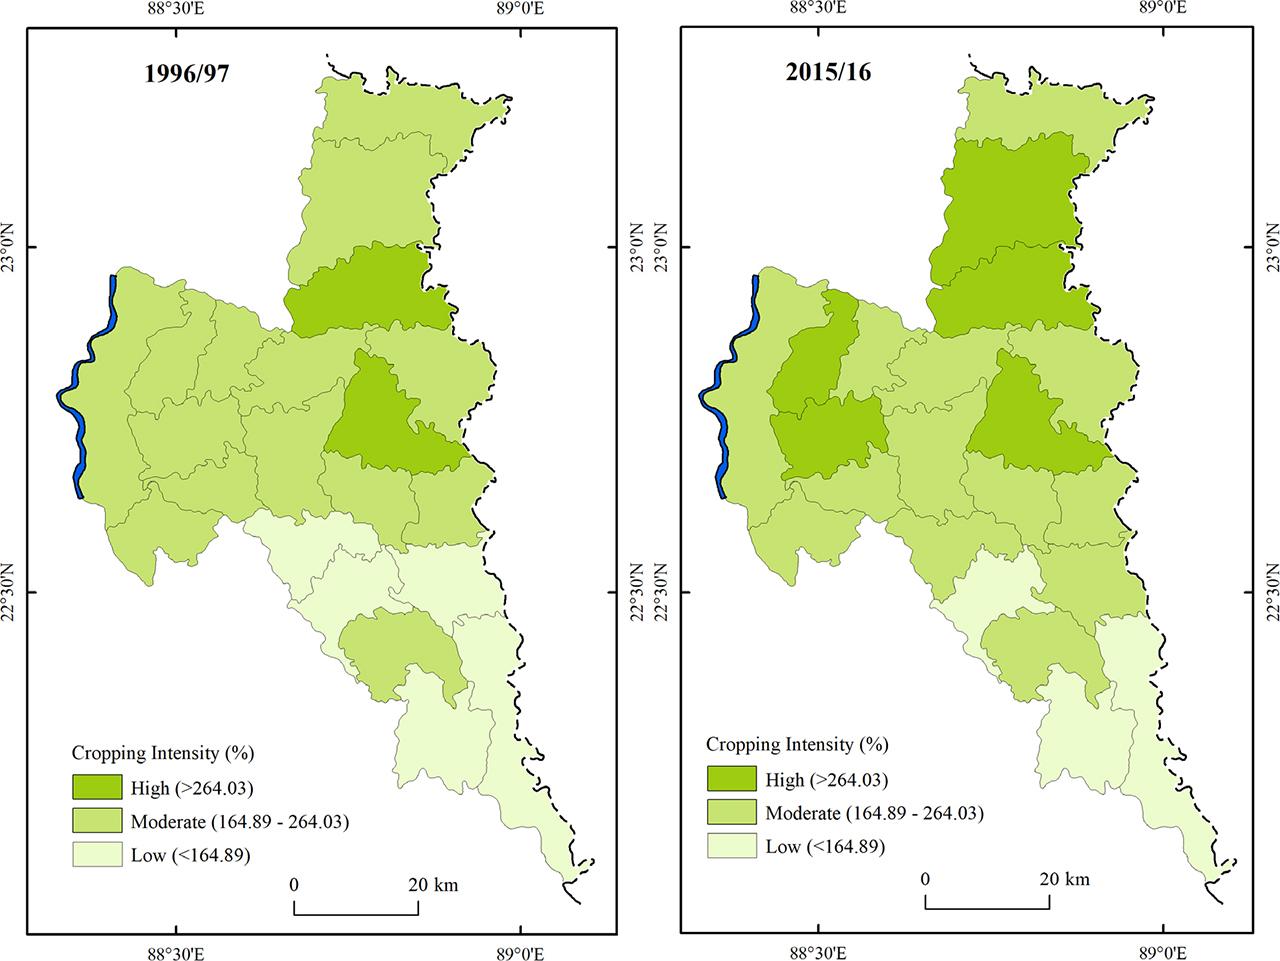
Figure 3
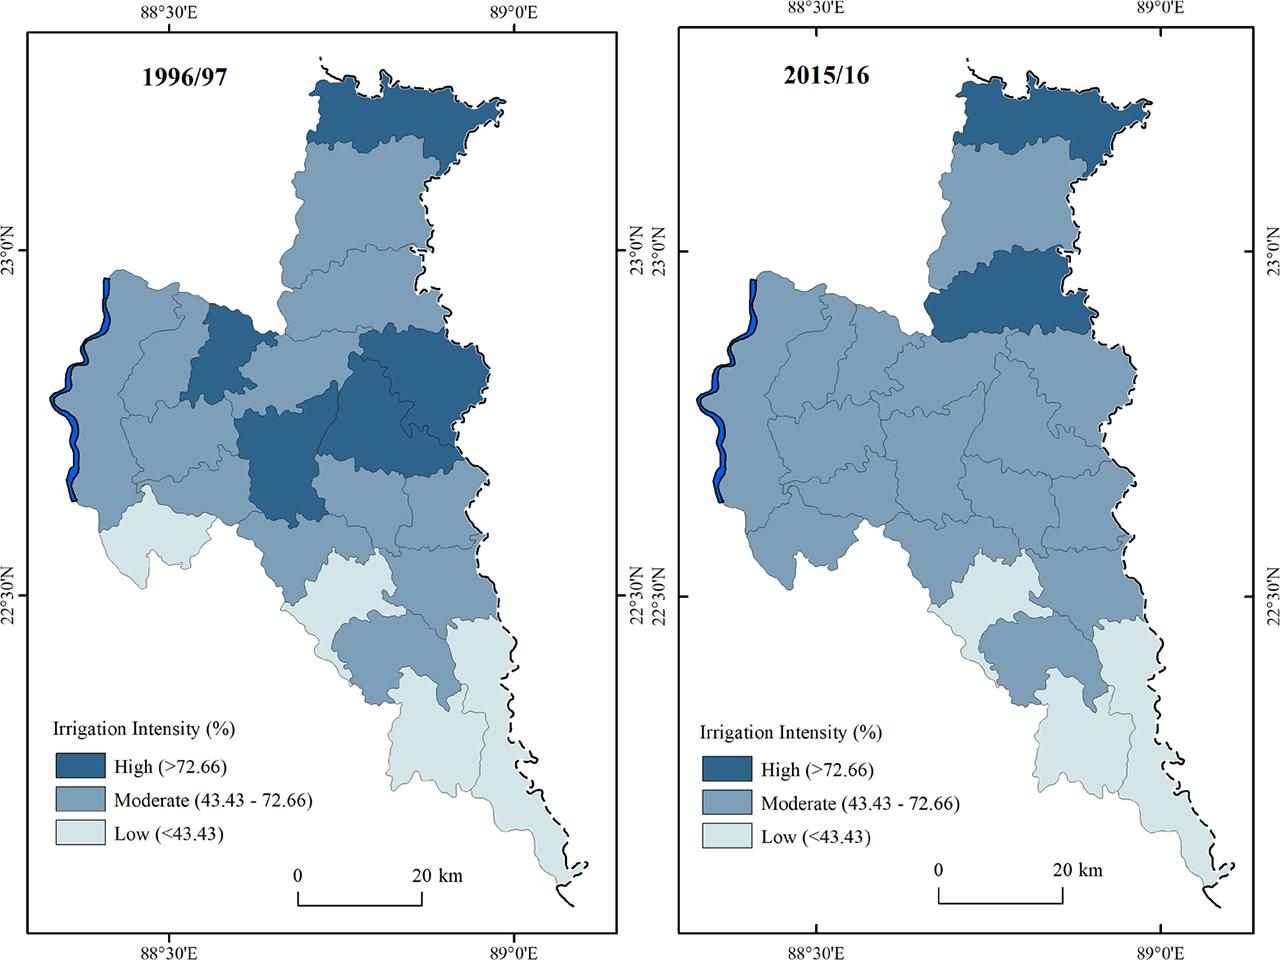
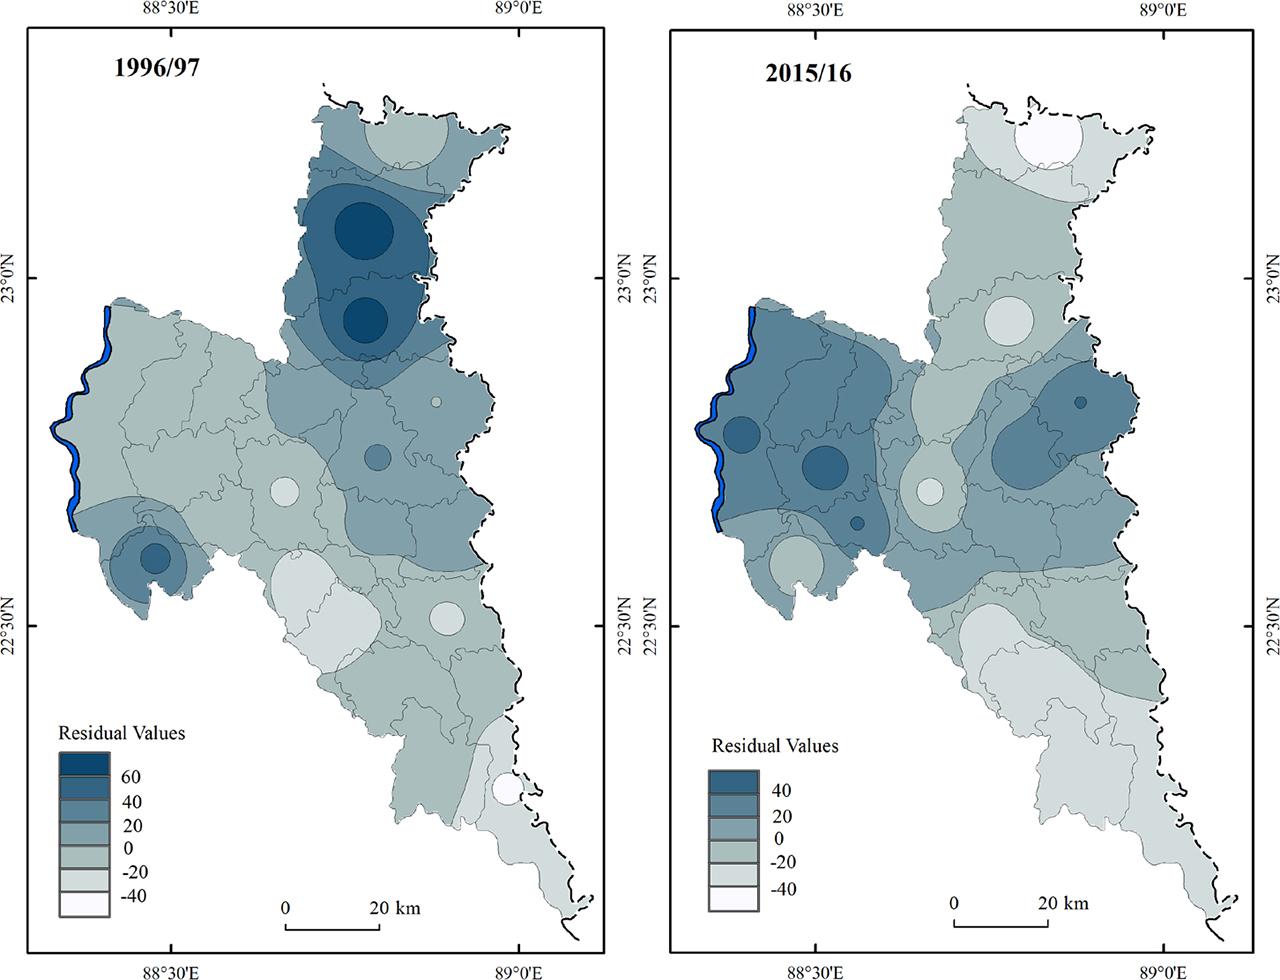
Figure 4
ANOVA (1996/97)
| Sum of Squares | df | Mean Square | F | Sig. | ||
|---|---|---|---|---|---|---|
| Cropping Intensity (1996/97) | Between Groups | 25691.975 | 2 | 12845.987 | 15.772 | .000 |
| Within Groups | 14660.781 | 18 | 814.488 | |||
| Total | 40352.756 | 20 | ||||
| Irrigation Intensity (1996/97) | Between Groups | 4952.253 | 2 | 2476.127 | 54.635 | .000 |
| Within Groups | 815.789 | 18 | 45.322 | |||
| Total | 5768.042 | 20 | ||||
Cropping intensity (X), irrigation intensity (Y), residuals (X and Y), area under HYVs of cereals to total cereals area and use of chemical fertilizers, i_e_ NPK, in North Twenty Four Parganas district (1996/97 and 2015/16)
| Sl. Nos. | Agricultural Blocks | Cropping Intensity (%) X* | Irrigation Intensity (%) Y* | Residuals (X and Y)* | Area under HYVs of Cereals to Total Cereals Area (%)# | Use of Chemical Fertilizers i.e. NPK (kg/hectare)# | |||||
|---|---|---|---|---|---|---|---|---|---|---|---|
| 1996/97 | 2015/16 | 1996/97 | 2015/16 | 1996/97 | 2015/16 | 1996/97 | 2015/16 | 1996/97 | 2015/16 | ||
| 1 | Amdanga | 220.06 | 271.26 | 68.21 | 65.26 | −2.3 | 20.71 | 86.37 | 98.43 | 124.63 | 223.87 |
| 2 | Barasat-I | 178.32 | 270.28 | 49.91 | 55.99 | −9.89 | 51.53 | 90.51 | 98.96 | 140.37 | 246.5 |
| 3 | Barasat-II | 191.19 | 260.89 | 57.3 | 56.17 | −10.81 | 41.52 | 82.44 | 98.19 | 119.82 | 240.68 |
| 4 | Barrackpur | 193.49 | 258.57 | 62.27 | 55.01 | −17.77 | 43.17 | 86.99 | 95.06 | 147.81 | 292.58 |
| 5 | Deganga | 219.98 | 246.61 | 79.55 | 71.91 | −23.54 | −26.77 | 91.11 | 99.55 | 143.69 | 244.91 |
| 6 | Habra-I | 234.75 | 208.14 | 71.31 | 58.72 | 6.62 | −19.98 | 95.19 | 100.00 | 171.88 | 308.82 |
| 7 | Habra-II | 240.85 | 263.86 | 88.77 | 60.65 | −19.85 | 29.13 | 95.02 | 99.60 | 132.71 | 267.94 |
| 8 | Rajarhat | 210.16 | 260.22 | 36.25 | 71.64 | 47.43 | −12.24 | 86.41 | 98.44 | 145.11 | 360.45 |
| 9 | Baduria | 264.87 | 266.3 | 78.68 | 59.01 | 23 | 37.18 | 95.39 | 99.14 | 155.04 | 233.36 |
| 10 | Basirhat-I | 214.32 | 219.62 | 55.49 | 55.45 | 15.71 | 2.7 | 93.41 | 99.36 | 129.26 | 221.28 |
| 11 | Basirhat-II | 205.08 | 233.37 | 54.96 | 56.62 | 7.46 | 12.45 | 90.79 | 98.00 | 143.13 | 241.46 |
| 12 | Haroa | 161.81 | 212.64 | 52.87 | 51.02 | −31.92 | 10.95 | 71.68 | 91.84 | 100.92 | 209.61 |
| 13 | Hasnabad | 154.87 | 186.05 | 44.35 | 48.83 | −22.98 | −8.12 | 78.34 | 99.88 | 64.74 | 203.19 |
| 14 | Hingalganj | 110.37 | 116.24 | 31.14 | 35.81 | −42.82 | −33.26 | 64.37 | 90.67 | 42.88 | 150.39 |
| 15 | Minakhan | 136.91 | 133.03 | 42.7 | 40.7 | −37.85 | −33.25 | 77.35 | 92.85 | 87.58 | 165.34 |
| 16 | Sandeshkhali-I | 177.75 | 167.77 | 46.04 | 51.7 | −3.25 | −36.26 | 67.53 | 95.32 | 83.93 | 171.73 |
| 17 | Sandeshkhali-II | 146.34 | 111.8 | 32 | 35.17 | −8.47 | −35.51 | 42.68 | 76.57 | 59.67 | 153.37 |
| 18 | Swarupnagar | 246.18 | 261.99 | 81.15 | 56.73 | −0.3 | 40.69 | 84.89 | 100.00 | 120.13 | 217.01 |
| 19 | Bagdah | 230.51 | 242.92 | 80.05 | 77.54 | −13.93 | −49.79 | 93.8 | 99.48 | 106.26 | 214.49 |
| 20 | Bongaon | 262.37 | 268.07 | 49.97 | 72.02 | 74.05 | −5.71 | 95.05 | 98.24 | 117.93 | 231.09 |
| 21 | Gaighata | 277.41 | 270.06 | 59.45 | 79.44 | 71.4 | −29.15 | 93.72 | 100.00 | 127.42 | 240.94 |
| District Total | 209.29 | 228.06 | 61.55 | 61.95 | - | - | 85.81 | 96.93 | 120.39 | 230.11 | |
Agro-ecological regions, density of rural population, net cropped area, gross cropped area and gross irrigated area in North Twenty Four Parganas district
| Sl. Nos. | Agricultural Blocks | Agro-Ecological Regions (area in km2) | Density of Rural Population* (persons/km2 | Net Cropped Area (hectares)# | Gross Cropped Area (hectares)# | Gross Irrigated Area (hectares)# | |||||
|---|---|---|---|---|---|---|---|---|---|---|---|
| 1991 | 2001 | 2011 | 1996/97 | 2015/16 | 1996/97 | 2015/16 | 1996/97 | 2015/16 | |||
| 1 | Amdanga | Gangetic Plains (1410.35) | 1001 | 1190 | 1364 | 8995 | 8995 | 19794 | 24400 | 13502 | 15923 |
| 2 | Barasat-I | 1593 | 2146 | 2146 | 6320 | 6320 | 11270 | 17082 | 5625 | 9564 | |
| 3 | Barasat-II | 1295 | 1483 | 1710 | 9730 | 9730 | 18603 | 25385 | 10660 | 14259 | |
| 4 | Barrackpur | 1562 | 1763 | 1715 | 7570 | 7570 | 14647 | 19574 | 9120 | 10768 | |
| 5 | Deganga | 1143 | 1362 | 1553 | 12000 | 12569 | 26397 | 30996 | 21000 | 22289 | |
| 6 | Habra-I | 1027 | 1472 | 1646 | 8808 | 8808 | 20677 | 18333 | 14745 | 10765 | |
| 7 | Habra-II | 837 | 1226 | 1344 | 8000 | 8000 | 19268 | 21109 | 17104 | 12802 | |
| 8 | Rajarhat | 1749 | 1945 | 1835 | 3958 | 1370 | 8318 | 3565 | 3015 | 2554 | |
| 9 | Baduria | 1008 | 1378 | 1567 | 12390 | 13490 | 32818 | 35924.5 | 25820 | 21200 | |
| 10 | Basirhat-I | 1090 | 1321 | 1436 | 7400 | 9133 | 15860 | 20058 | 8800 | 11123 | |
| 11 | Basirhat-II | 1224 | 1507 | 1715 | 8595 | 8174 | 17627 | 19076 | 9687 | 10801 | |
| 12 | Haroa | Coastal Saline Region (1028.62) | 989 | 1195 | 1403 | 9100 | 8953 | 14725 | 19038 | 7785 | 9713 |
| 13 | Hasnabad | 972 | 1160 | 1306 | 11020 | 8600 | 17067 | 16000 | 7570 | 7812 | |
| 14 | Hingalganj | 618 | 655 | 694 | 14200 | 14200 | 15673 | 16506 | 4880 | 5910 | |
| 15 | Minakhan | 874 | 1064 | 1267 | 11400 | 7194 | 15608 | 9570.5 | 6665 | 3895 | |
| 16 | Sandeshkhali-I | 665 | 771 | 902 | 8064 | 7559 | 14334 | 12681.5 | 6600 | 6556 | |
| 17 | Sandeshkhali-II | 603 | 691 | 816 | 7730 | 9830 | 11312 | 10990 | 3620 | 3865 | |
| 18 | Swarupnagar | Ichhamati Basin (1082.91) | 917 | 1054 | 1179 | 13120 | 13083 | 32299 | 34276 | 26210 | 19445 |
| 19 | Bagdah | 819 | 941 | 1041 | 14800 | 17754 | 34115 | 43128.3 | 27310 | 33443 | |
| 20 | Bongaon | 874 | 1022 | 1131 | 22940 | 22940 | 60187 | 61494.5 | 30074 | 44291 | |
| 21 | Gaighata | 1021 | 1187 | 1173 | 15910 | 15910 | 44136 | 42966.2 | 26240 | 34131 | |
| District Total | 980 | 1171 | 1277 | 222050 | 220182 | 464735 | 502154 | 286032 | 311109 | ||
Post-hoc Tests (1996/97)
| Tukey HSD (Multiple Comparisons) | |||||||
|---|---|---|---|---|---|---|---|
| Dependent Variable | (I) Ward Method | (J) Ward Method | Mean Difference (I–J) | Std. Error | Sig. | 95% Confidence Interval | |
| Lower Bound | Upper Bound | ||||||
| Cropping Intensity (1996/97) | 1 | 2 | 77.17661* | 14.77046 | .000 | 39.4800 | 114.8732 |
| 3 | 12.76619 | 15.87776 | .705 | −27.7565 | 53.2888 | ||
| 2 | 1 | −77.17661* | 14.77046 | .000 | −114.8732 | −39.4800 | |
| 3 | −64.41042* | 15.41295 | .002 | −103.7468 | −25.0741 | ||
| 3 | 1 | −12.76619 | 15.87776 | .705 | −53.2888 | 27.7565 | |
| 2 | 64.41042* | 15.41295 | .002 | 25.0741 | 103.7468 | ||
| Irrigation Intensity (1996/97) | 1 | 2 | 36.33821* | 3.48421 | .000 | 27.4459 | 45.2305 |
| 3 | 21.67238* | 3.74541 | .000 | 12.1135 | 31.2313 | ||
| 2 | 1 | −36.33821* | 3.48421 | .000 | −45.2305 | −27.4459 | |
| 3 | −14.66583* | 3.63577 | .002 | −23.9449 | −5.3868 | ||
| 3 | 1 | −21.67238* | 3.74541 | .000 | −31.2313 | −12.1135 | |
| 2 | 14.66583* | 3.63577 | .002 | 5.3868 | 23.9449 | ||
Robust Tests of Equality of Means (2015/16)
| Statistica | df1 | df2 | Sig. | ||
|---|---|---|---|---|---|
| Cropping Intensity (2015/16) | Welch | 186.750 | 2 | 4.780 | .000 |
| Brown-Forsythe | 94.294 | 2 | 7.745 | .000 | |
| Irrigation Intensity (2015/16) | Welch | 43.072 | 2 | 8.316 | .000 |
| Brown-Forsythe | 38.153 | 2 | 17.286 | .000 | |
Partial correlation between cropping intensity and selected independent variables
| Dependent Variable | Independent Variables* | Correlation | Significance (2-tailed) | Degrees of Freedom |
|---|---|---|---|---|
| Cropping Intensity (%) | Irrigation Intensity (%) | 0.363 | 0.138 | 16 |
| Area under HYVs of Cereals to Total Cereals Area (%) | 0.210 | 0.402 | 16 | |
| Use of Chemical Fertilizers, i.e. NPK (kg/hectare) | 0.500 | 0.035** | 16 |
Cluster criteria and association of Agricultural Blocks in North Twenty Four Parganas district (1996/97 and 2015/16)
| Clusters | Cluster Criteria | 1996/97 | 2015/16 |
|---|---|---|---|
| Agricultural Blocks | Agricultural Blocks | ||
| 1 | Moderate to high cropping intensity and irrigation intensity | Amdanga, Deganga, Habra-I, Habra-II, Baduria, Swarupnagar and Bagdah | Amdanga, Barasat-I, Barasat-II, Barrackpur, Deganga, Habra-II, Rajarhat, Baduria, Swarupnagar, Bagdah, Bongaon and Gaighata |
| 2 | Moderate cropping intensity and irrigation intensity | Barasat-I, Rajarhat, Haora, Hasnabad, Hingalganj, Minakhan, Sandeshkhali-I and Sandeshkhali-II | Habra-I, Basirhat-I, Basirhat-II, Haroa, Hasnabad and Sandeshkhali-I |
| 3 | Low cropping intensity and moderate irrigation intensity | Barasat-II, Barrackpur, Basirhat-I, Basirhat-II, Bongaon and Gaighata | Hingalganj, Minakhan and Sandeshkhali-II |
Post-hoc Tests (2015/16)
| Games-Howell (Multiple Comparisons) | |||||||
|---|---|---|---|---|---|---|---|
| Dependent Variable | (I) Ward Method | (J) Ward Method | Mean Difference (I–J) | Std. Error | Sig. | 95% Confidence Interval | |
| Lower Bound | Upper Bound | ||||||
| Cropping Intensity (2015/16) | 1 | 2 | 57.15417* | 10.05702 | .004 | 25.8715 | 88.4369 |
| 3 | 141.39583* | 6.96935 | .001 | 109.9476 | 172.8441 | ||
| 2 | 1 | −57.15417* | 10.05702 | .004 | −88.4369 | −25.8715 | |
| 3 | 84.24167* | 11.66894 | .000 | 49.8575 | 118.6259 | ||
| 3 | 1 | −141.39583* | 6.96935 | .001 | −172.8441 | −109.9476 | |
| 2 | −84.24167* | 11.66894 | .000 | −118.6259 | −49.8575 | ||
| Irrigation Intensity (2015/16) | 1 | 2 | 11.39083* | 3.02058 | .005 | 3.5875 | 19.1941 |
| 3 | 27.88750* | 3.12802 | .000 | 19.4289 | 36.3461 | ||
| 2 | 1 | −11.39083* | 3.02058 | .005 | −19.1941 | −3.5875 | |
| 3 | 16.49667* | 2.33231 | .002 | 8.9642 | 24.0291 | ||
| 3 | 1 | −27.88750* | 3.12802 | .000 | −36.3461 | −19.4289 | |
| 2 | −16.49667* | 2.33231 | .002 | −24.0291 | −8.9642 | ||
Net cropped area, gross cropped area, gross irrigated area, cropping intensity, irrigation intensity, area under HYVs of cereals to total cereals area and use of chemical fertilizers, i_e_ NPK, in North Twenty Four Parganas district (1996/97 to 2015/16)
| Years | Net Cropped Area (hectares)# | Gross Cropped Area (hectares)# | Cropping Intensity (%)* | Gross Irrigated Area (hectares)# | Irrigation Intensity (%)* | Area under HYVs of Cereals to Total Cereals Area (%)# | Use of Chemical Fertilizers, i.e. NPK (kg/hectare)# |
|---|---|---|---|---|---|---|---|
| 1996/97 | 222 050 | 464 735 | 209.29 | 286 032 | 61.55 | 85.81 | 120 |
| 1997/98 | 222 050 | 467 193 | 210.40 | 286 032 | 61.22 | 85.79 | 125 |
| 1998/99 | 222 050 | 468 525 | 211.00 | 286 032 | 61.05 | 84.23 | 144 |
| 1999/00 | 222 050 | 471 412 | 212.30 | 265 894 | 56.4 | 52.94 | 167 |
| 2000/01 | 222 050 | 466 615 | 210.14 | 194 587 | 41.7 | 89.92 | 139 |
| 2001/02 | 222 050 | 472 966 | 213.00 | 195 689 | 41.37 | 90.67 | 151 |
| 2002/03 | 222 050 | 455 424 | 205.10 | 189 720 | 41.66 | 90.6 | 165 |
| 2003/04 | 222 050 | 464 084 | 209.00 | 198 745 | 42.83 | 92.18 | 161 |
| 2004/05 | 222 050 | 447 852 | 201.69 | 200 475 | 44.76 | 92.49 | 173 |
| 2005/06 | 222 050 | 500 434 | 225.37 | 245 178 | 48.99 | 94.4 | 179 |
| 2006/07 | 222 050 | 472 966 | 213.00 | 189 689 | 40.11 | 92.61 | 171 |
| 2007/08 | 225 000 | 483 750 | 215.00 | 193 987 | 40.1 | 95.79 | 165 |
| 2008/09 | 225 000 | 503 437 | 223.75 | 195 940 | 38.92 | 97.09 | 168 |
| 2009/10 | 225 000 | 462 712 | 205.65 | 195 940 | 42.35 | 95.53 | 185 |
| 2010/11 | 225 000 | 478 597 | 212.71 | 195 940 | 40.94 | 92.47 | 188 |
| 2011/12 | 225 000 | 479 250 | 213.00 | 197 058 | 41.12 | 95.37 | 189 |
| 2012/13 | 225 000 | 482 400 | 214.40 | 198 994 | 41.25 | 95.72 | 197 |
| 2013/14 | 220 182 | 481097 | 218.50 | 256 478 | 53.31 | 96.09 | 217 |
| 2014/15 | 220 182 | 493 207 | 224.00 | 287 459 | 58.28 | 95.97 | 224 |
| 2015/16 | 220 182 | 502 154 | 228.06 | 311 109 | 61.95 | 96.93 | 230 |