
Table 1
Territorial reforms in the Communist regime (1950-1990)
| Year | Number of settlements | Number of councils |
|---|---|---|
| 1950 | 3,229 | 3,032 |
| 1960 | 3,273 | 3,087 |
| 1970 | 3,244 | 2,294 |
| 1975 | 3,183 | 1,711 |
| 1980 | 3,122 | 1,525 |
| 1985 | 3,064 | 1,486 |
| 1990 | 3,070 | 1,586 |
[i] Source: Bekényi & Pajor (2002)
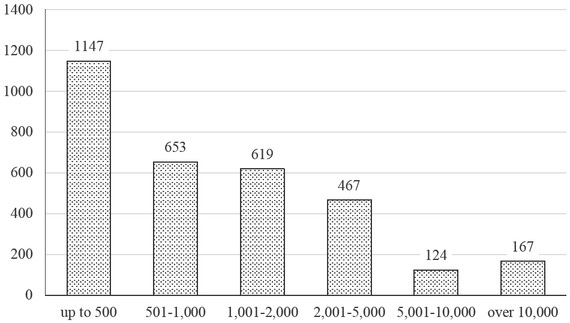
Figure 1
Number of Hungarian local government authorities by population (2019)
Source: Hungarian Central Statistical Office (n.d. a)
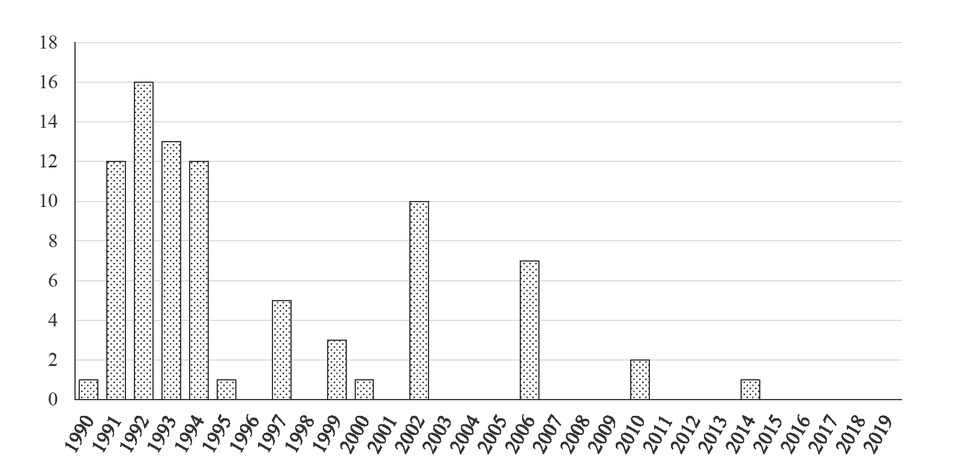
Figure 2
Municipal splits in Hungary (1990-2019)
Source: own calculation based on National Election Office data (n.d. b)
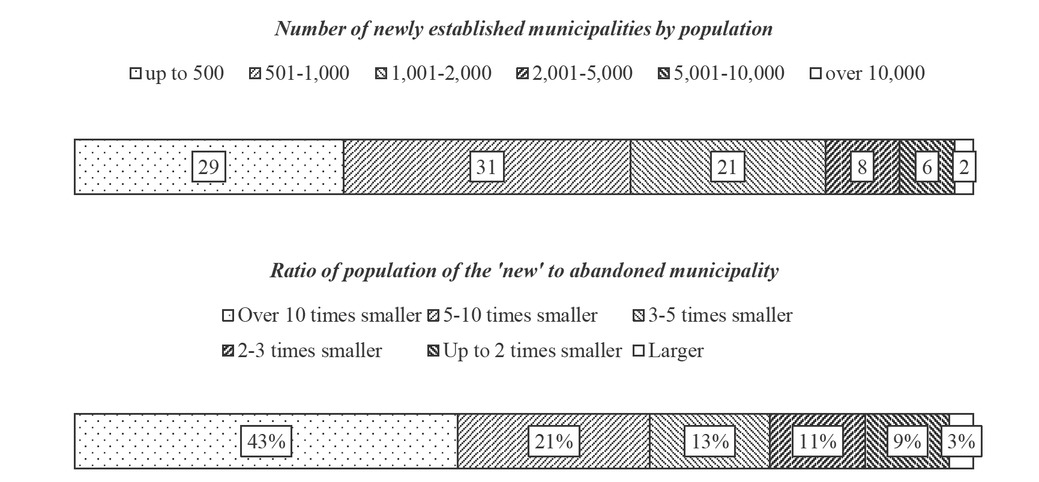
Figure 3
Population characteristics of Hungarian municipal splits (1990-2019)
Source: own calculation based on Hungarian Central Statistical Office data (d. b)
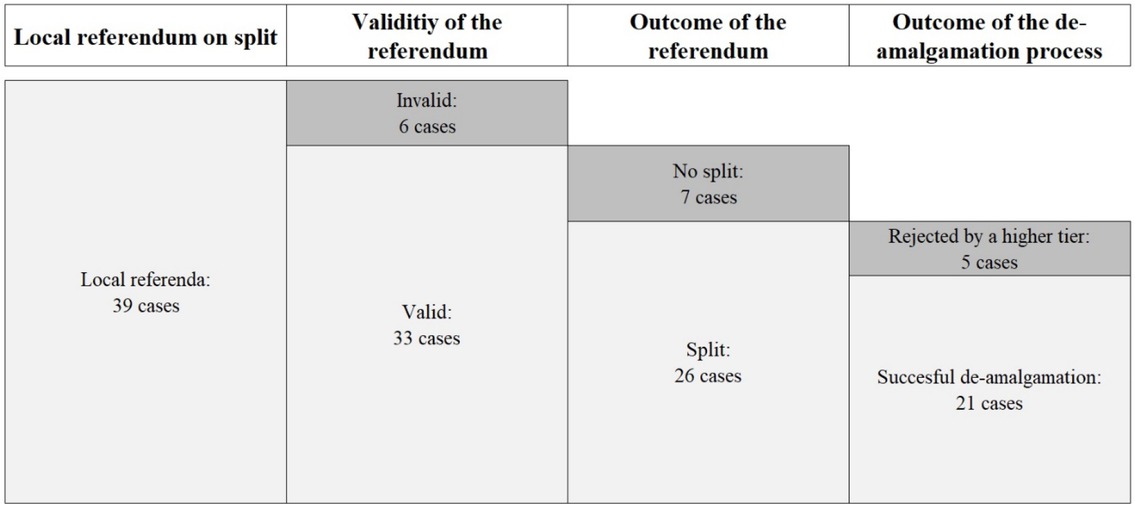
Figure 4
Secession processes in Hungary (1999-2019)
Source: own elaboration
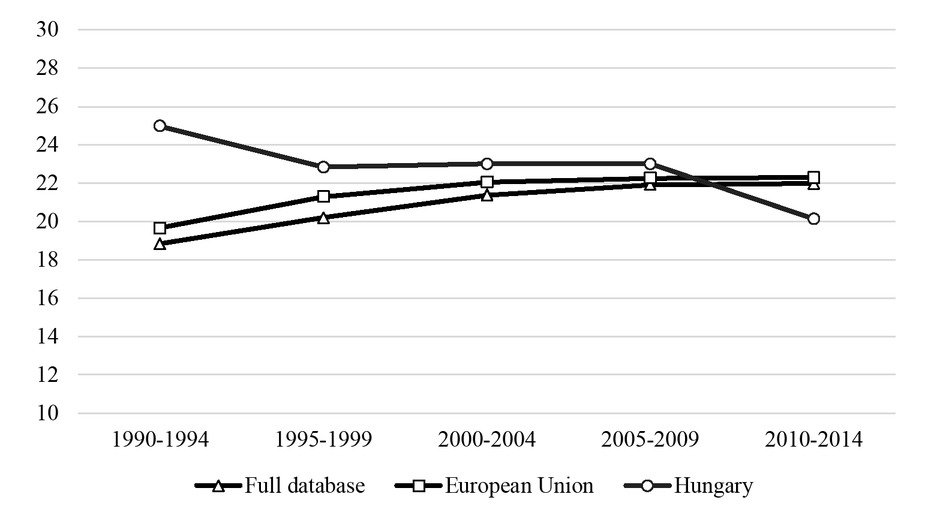
Figure 5
Autonomy of Hungarian local government authorities in international comparison (1990-2014)
Source: own elaboration based on Ladner et al. (2019)