
Figure 1
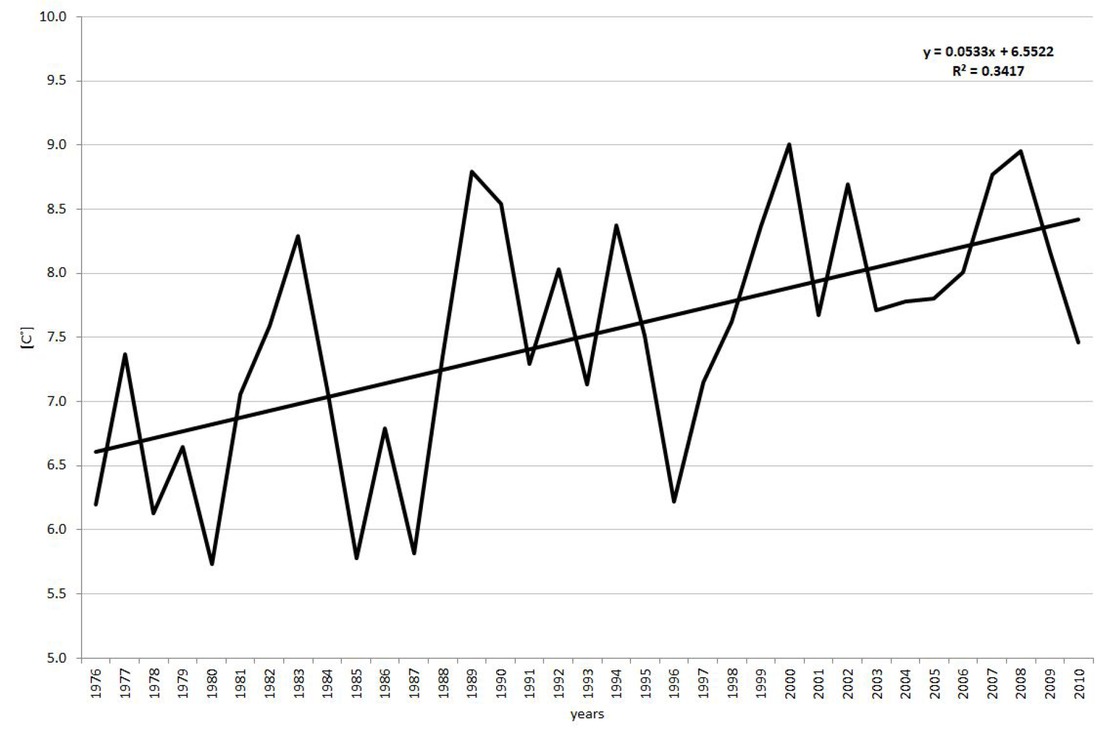
The average annual air temperature [°C] in Radawiec in 1976–2010
Source: author’s elaboration
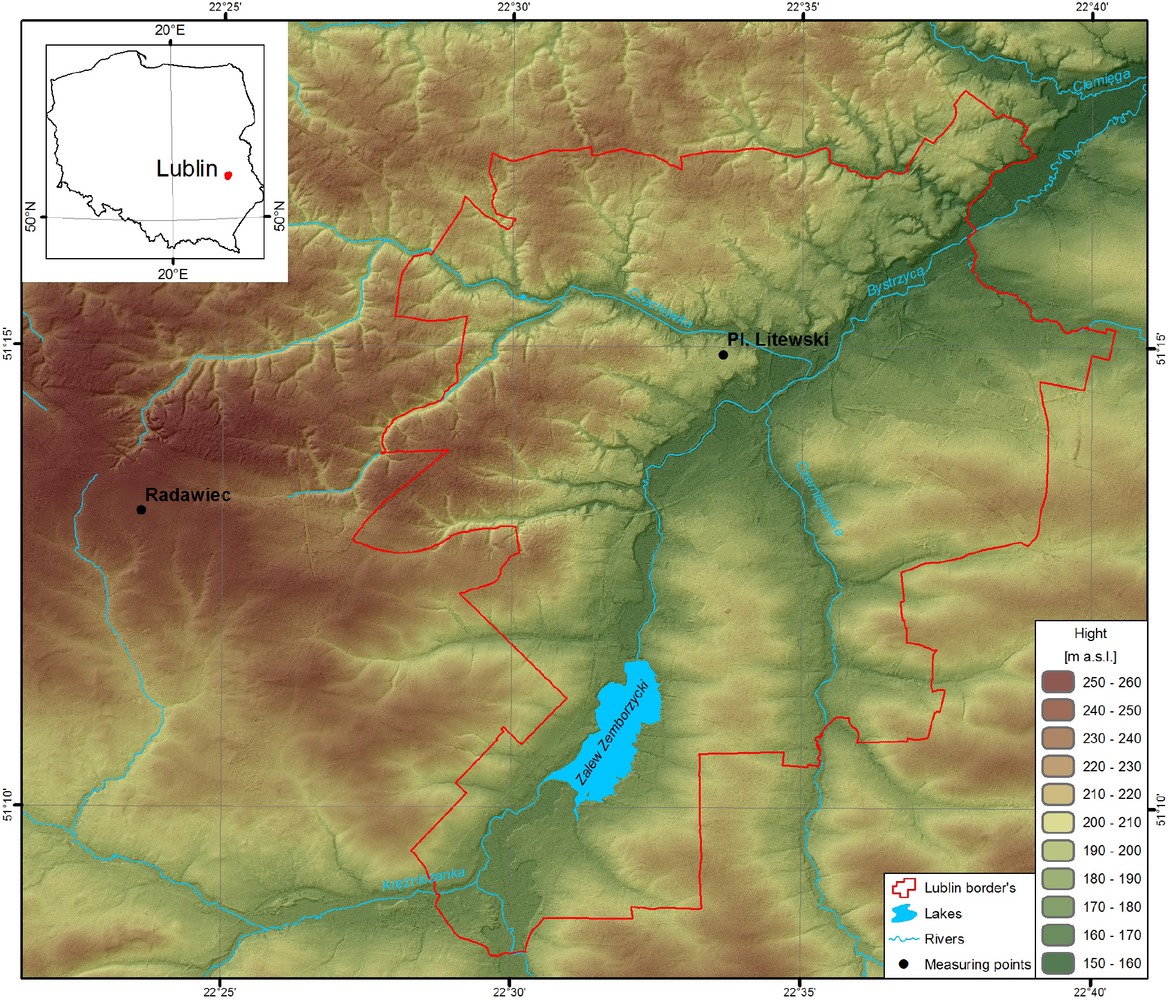
Figure 2
Location of measurement points
Source: author’s elaboration
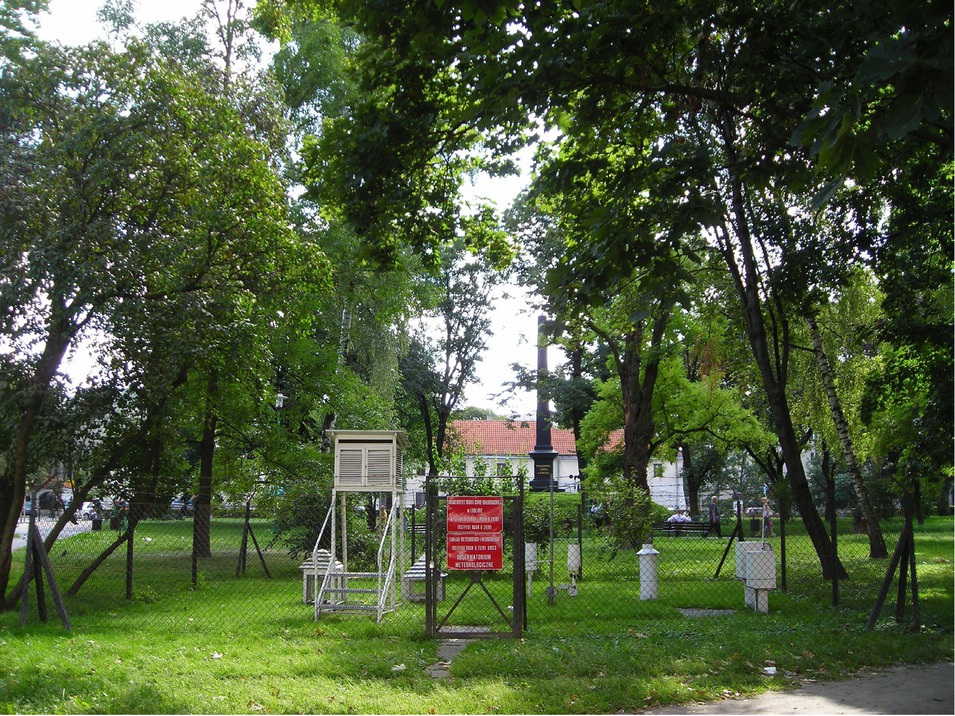
Figure 3
Surroundings of the UMCS meteorological station in Lublin
Source: photo taken by Sylwester Wereski
Table 1
Scale of assessment of thermal stress of the organism according to the UTCI index
| UTCI [°C] | Thermal stress | Prevention |
|---|---|---|
| > +46 | Extreme heat stress (EHS) | Necessary periodical cooling of the organism, necessary supplementation of liquids > 0.5 l/h; avoid intensive physical activity. |
| +38 – +46 | Very strong heat stress (VSHS) | Necessary periodical use of air-conditioned rooms or shaded areas; necessary supplementation of liquids > 0.5 l/h; limit physical activity |
| +32 – +38 | Strong heat stress (SHS) | Necessary supplementation of liquids 0.25 l/h; recommended use of shaded areas, and periodical limiting of physical activity |
| +26 +32 – | Moderate heat stress (MHS) | Necessary supplementation of liquids 0.25 l/h |
| ++9 26 – | Thermoneutral zone (TZ) | Physiological thermoregulation processes are sufficient to maintain thermal comfort |
| 0 – +9 | Slight cold stress (SlCS) | Recommended use of gloves and a hat |
| −13 – 0 | Moderate cold stress (MCS) | Intensify physical activity and protect extremities and face from cold |
| −27 – −13 | Strong cold stress (SCS) | Intensify physical activity and protect extremities and face from cold; recommended increase in the thermo-isolation properties of clothing |
| −40 – −27 | Very strong cold stress (VSCS) | Intensify physical activity and protect extremities and face from cold; necessary increase in the thermo-isolation properties of clothing, and limited time spent outdoors |
| < −40 | Extreme cold stress (ECS) | Limit time spent outdoors to the necessary minimum; necessary increase in the thermo-isolation and wind-proof properties of clothing |
Table 2
Mean monthly air temperature values at 12 UTC in Lublin and Radawiec (1976−2015)
| Name of station | I | II | III | IV | V | VI | VII | VIII | IX | X | XI | XII | Annual mean |
|---|---|---|---|---|---|---|---|---|---|---|---|---|---|
| Lublin | −1.2 | 0.2 | 5.2 | 12.0 | 17.8 | 20.5 | 22.5 | 22.3 | 17.1 | 11.7 | 5.1 | 0.5 | 11.1 |
| Radawiec | −1.7 | −0.4 | 4.7 | 11.4 | 17.1 | 19.8 | 21.9 | 21.8 | 16.7 | 11.3 | 4.6 | −0.2 | 10.6 |
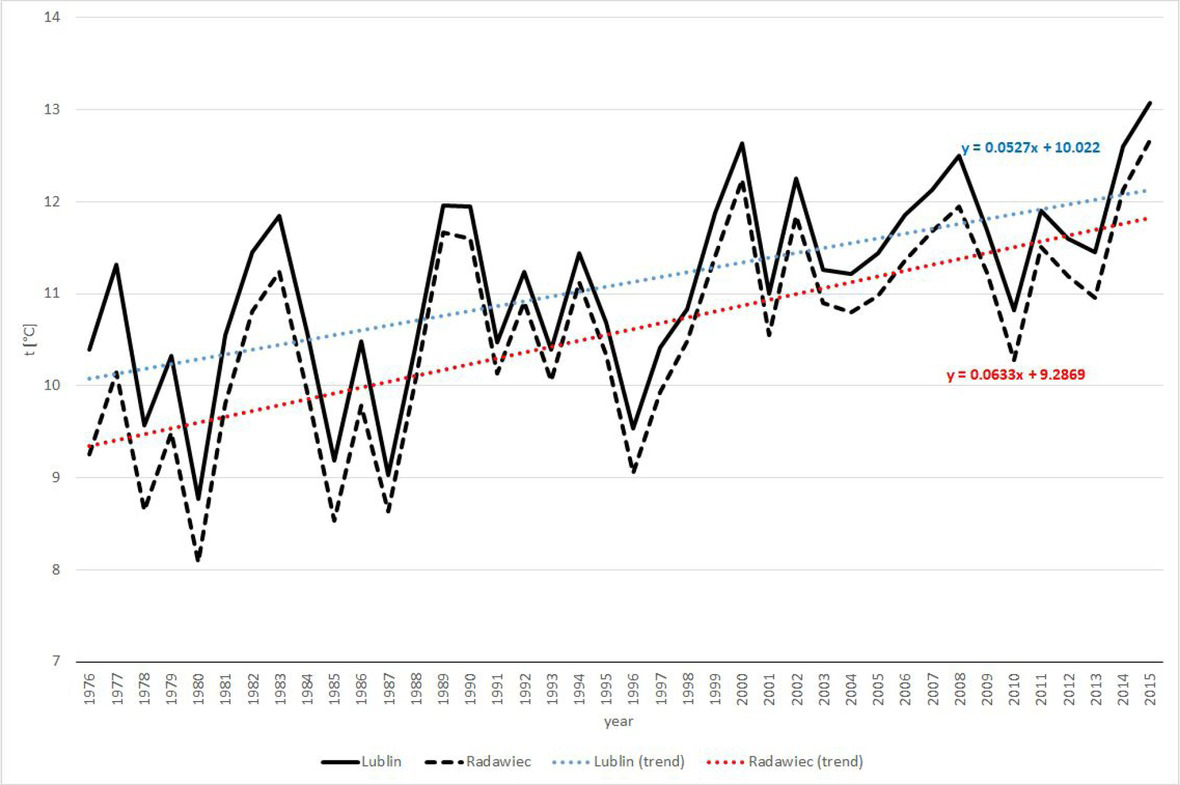
Figure 4
Course of mean annual air temperature values (in °C) at 12 UTC in Lublin and Radawiec (1976–2015)
Source: author’s elaboration
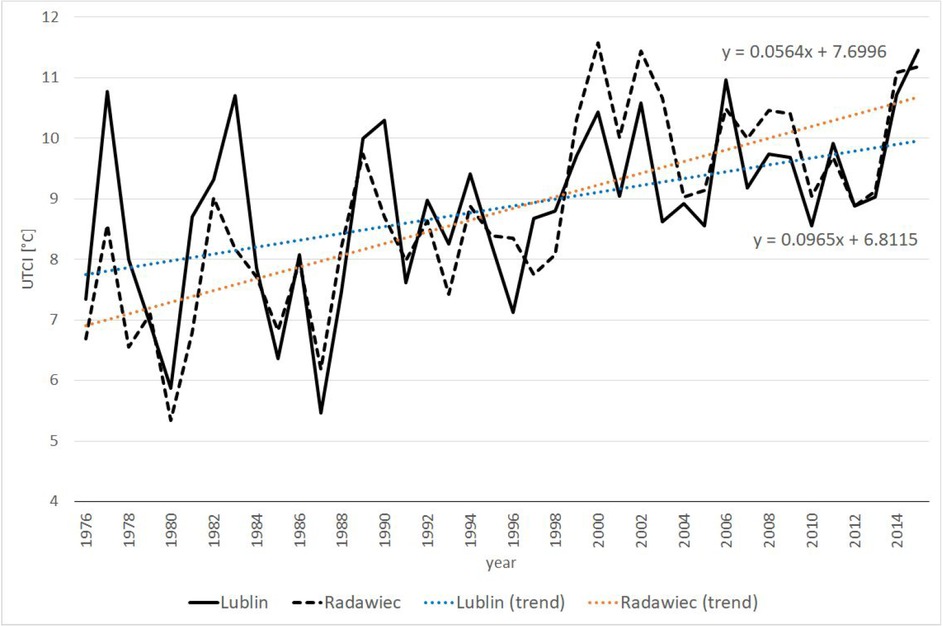
Figure 5
Course of mean annual values of the UTCI index at 12 UTC in Lublin and Radawiec (1976–2015)
Source: author’s elaboration
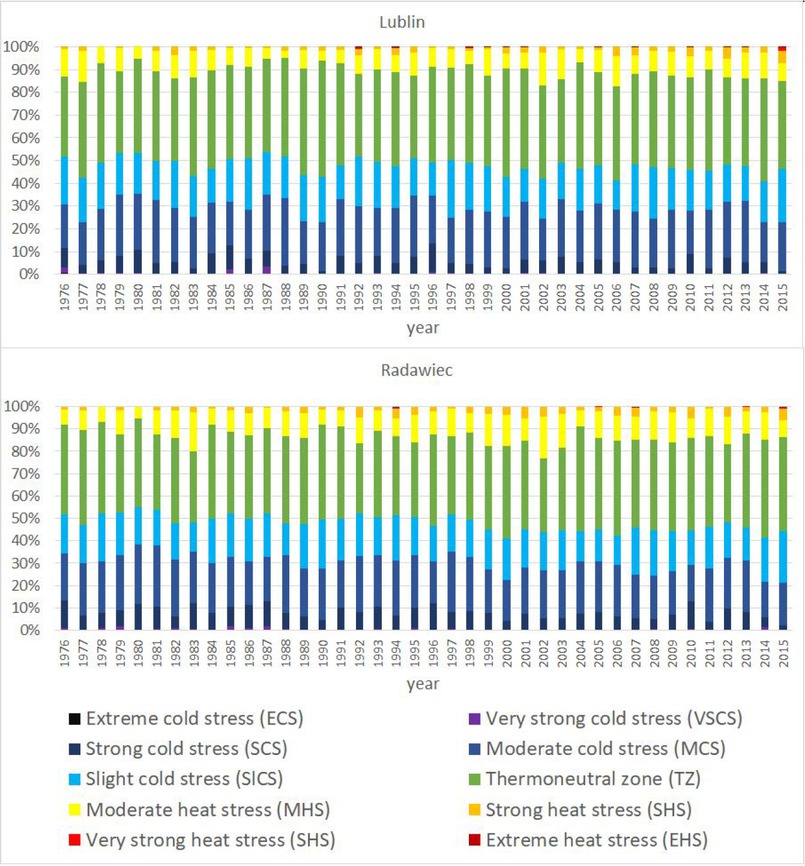
Figure 6
Long-term course of frequency of occurrence of UTCI heat load in Lublin and Radawiec in the period 1974–2015
Source: author’s elaboration
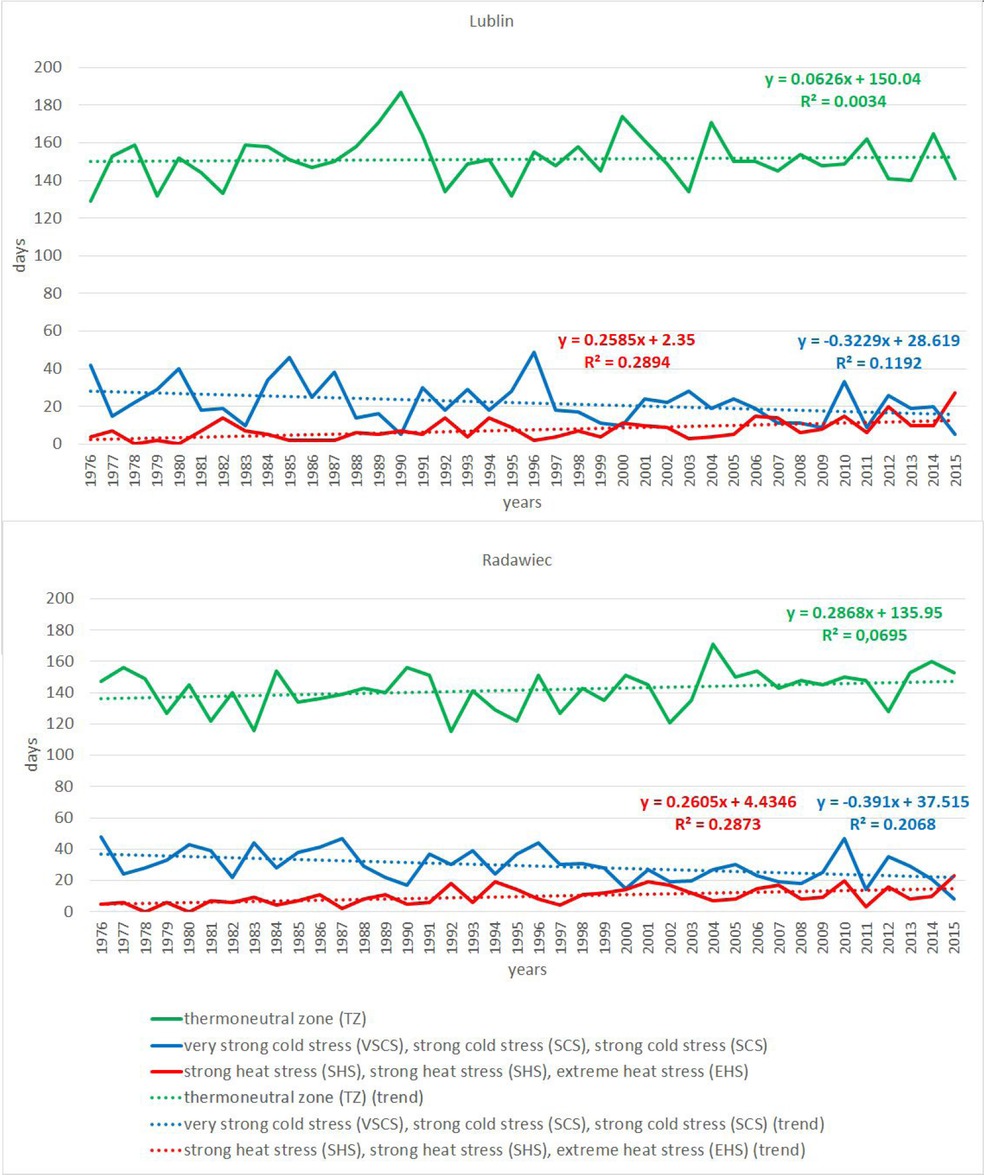
Figure 7
The course of average annual values of selected thermal loads of the UTCI at 12 UTC in Lublin and Radawiec (1976–2015)
Source: author’s study
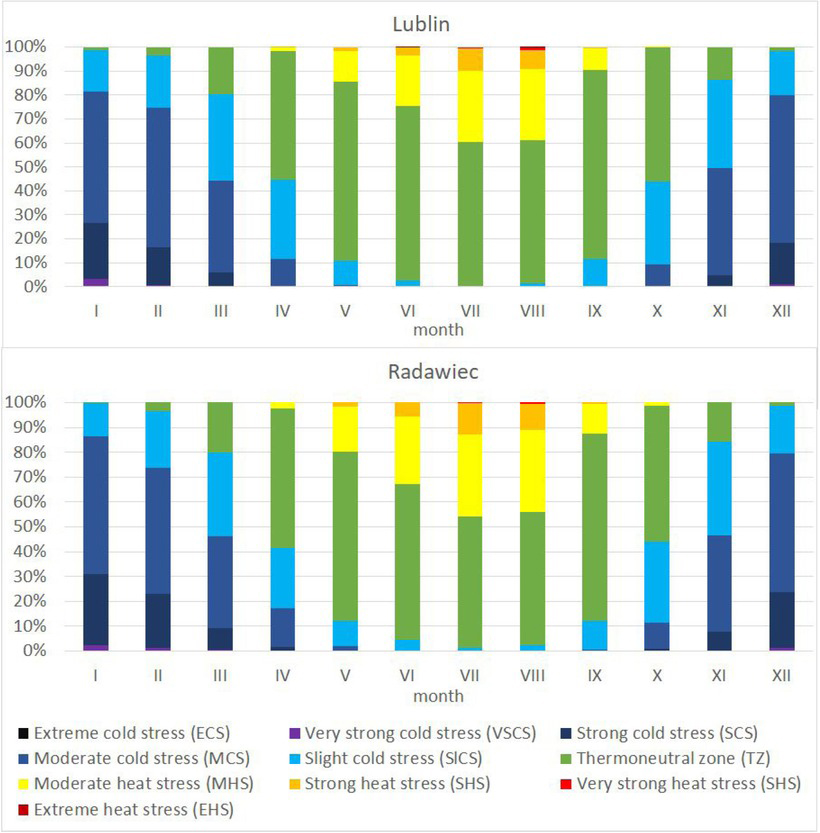
Figure 8
Annual course of frequency of occurrence of particular UTCI classes in Lublin and Radawiec in the period 1974–2015
Source: author’s elaboration
Table 3
Annual occurrence of particular UTCI classes (in %) in Lublin and Radawiec in the period 1974–2015
| Station | Extreme cold stress (ECS) | Very strong cold stress (VSCS) | Strong cold stress (SCS) | Moderate cold stress (MCS) | Slight cold stress (SlCS) | Thermoneutral zone (TZ) | Moderate heat stress (MHS) | Strong heat stress (SHS) | Strong heat stress (SHS) | Extreme heat stress (EHS) |
|---|---|---|---|---|---|---|---|---|---|---|
| Lublin | 0 | 0.4 | 5.6 | 23.1 | 18.4 | 41.6 | 8.7 | 2 | 0.2 | 0 |
| Radawiec | 0 | 0.5 | 7.6 | 22.1 | 17.7 | 38.8 | 10.6 | 2.6 | 0.1 | - |