
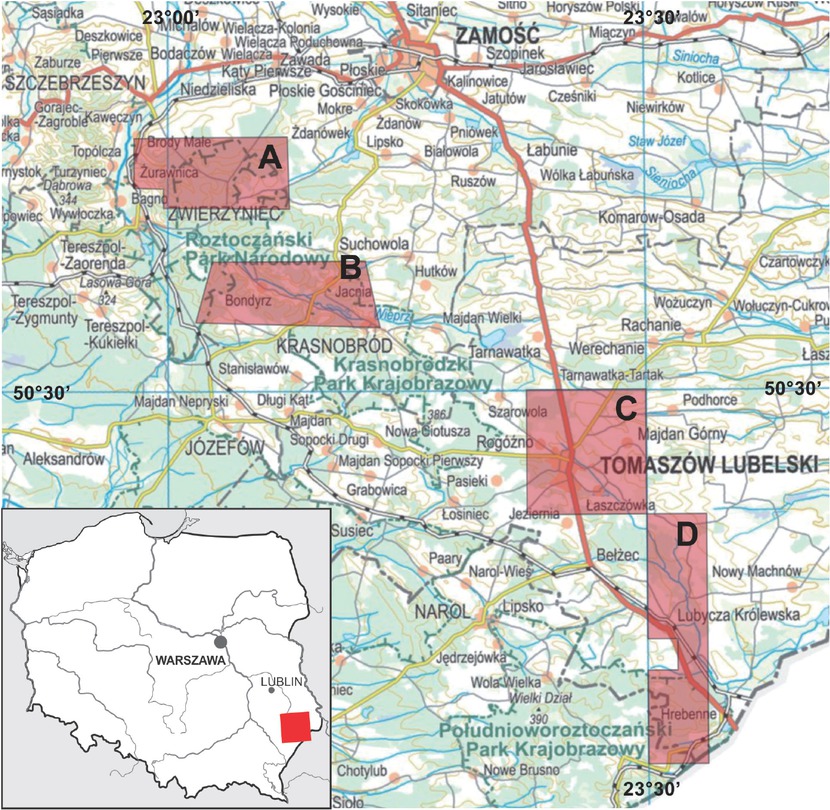
Figure 1
Range of test polygons A, B, C, and D
Source: Own work based on the 1:250 000 map from the website – Geoportal 2
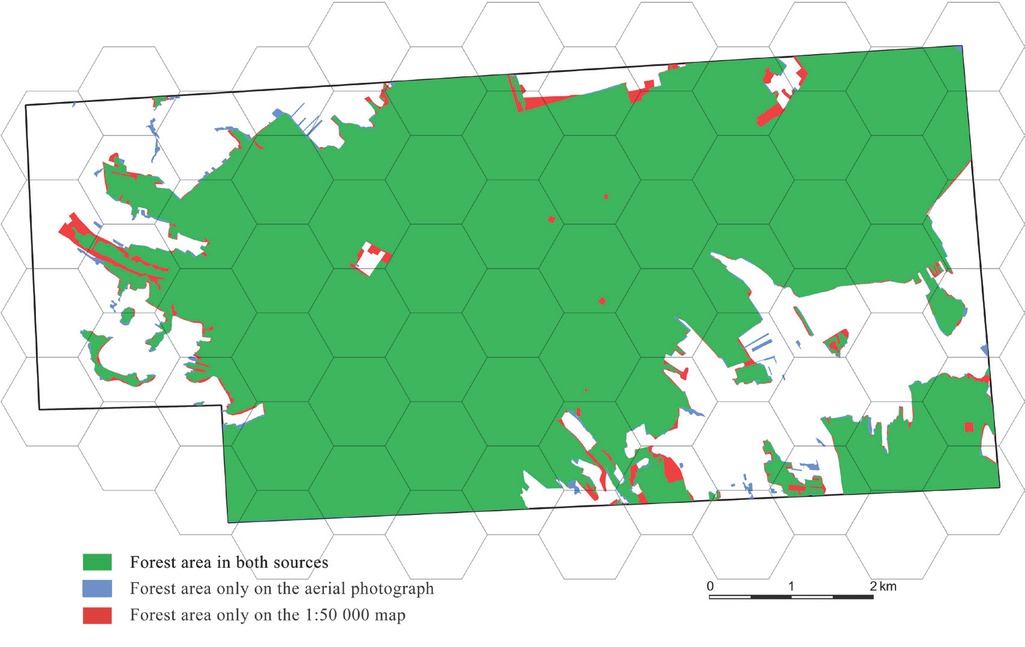
Figure 2
Test polygon A, map of the differences in forests coverage between the aerial photograph and the 1:50 000 GUGIK 65 map
Source: Own work
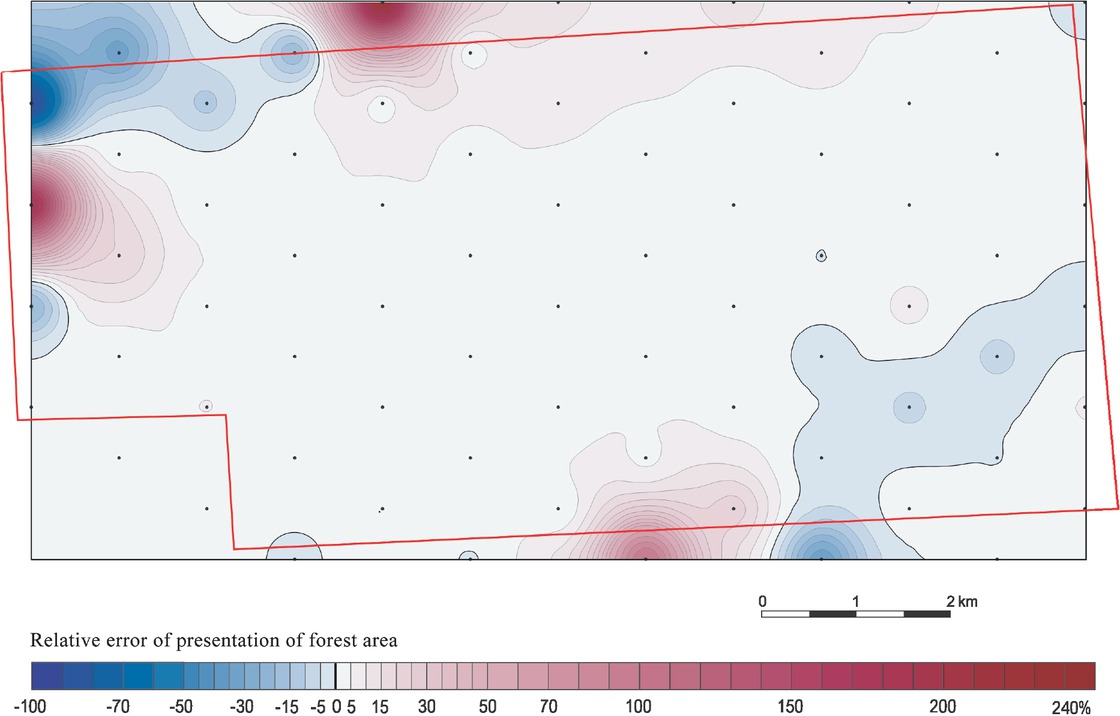
Figure 3
Study polygon A, relative errors for the 1:50 000 GUGIK 65 map
Source: Own work
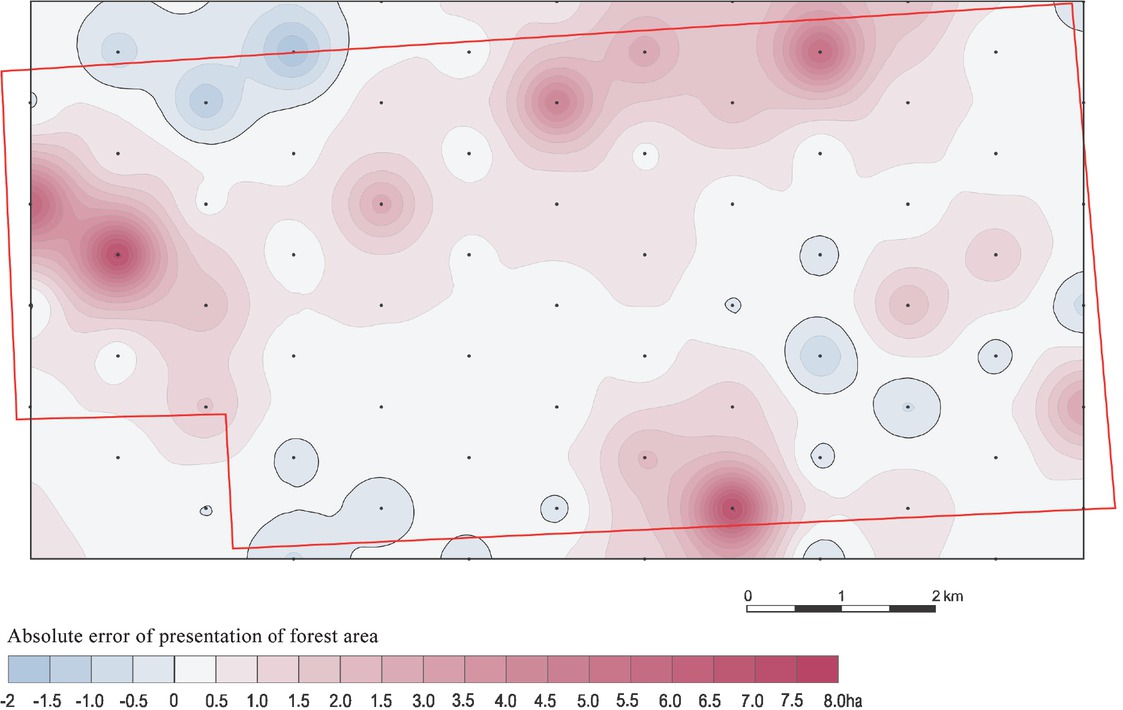
Figure 4
Test polygon A, absolute errors for the 1:50 000 GUGIK 65 map
Source: Own work
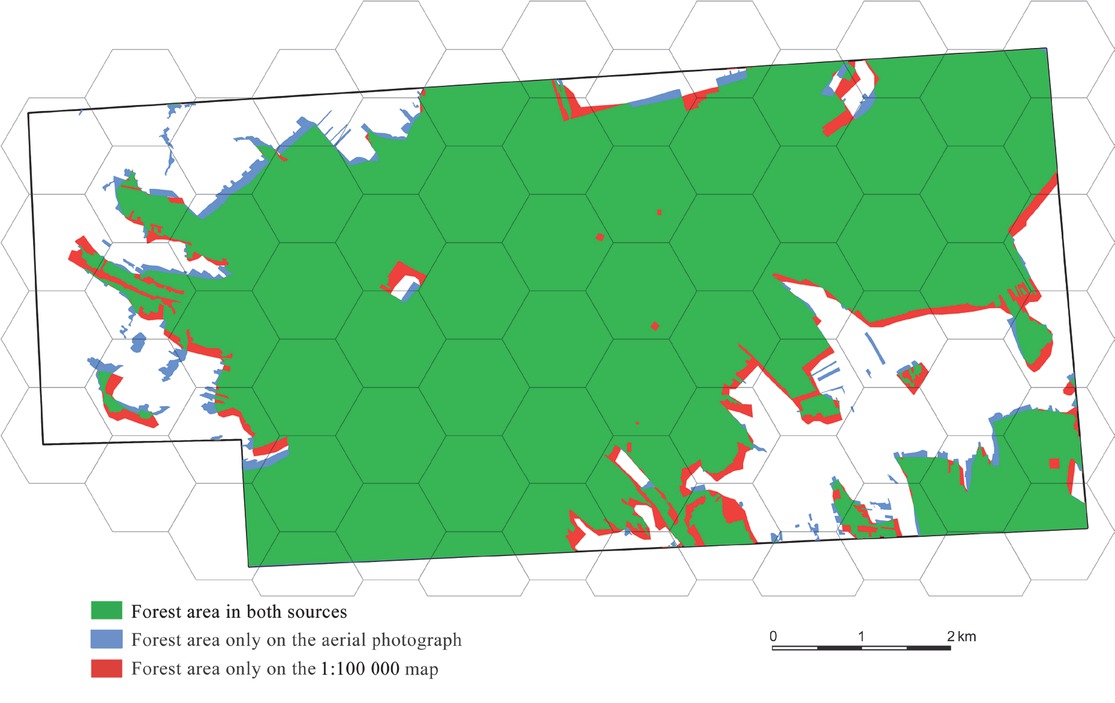
Figure 5
Test polygon A, map of the differences in forest coverage between the aerial photograph and the 1:100 000 GUGIK 80 map
Source: Own work
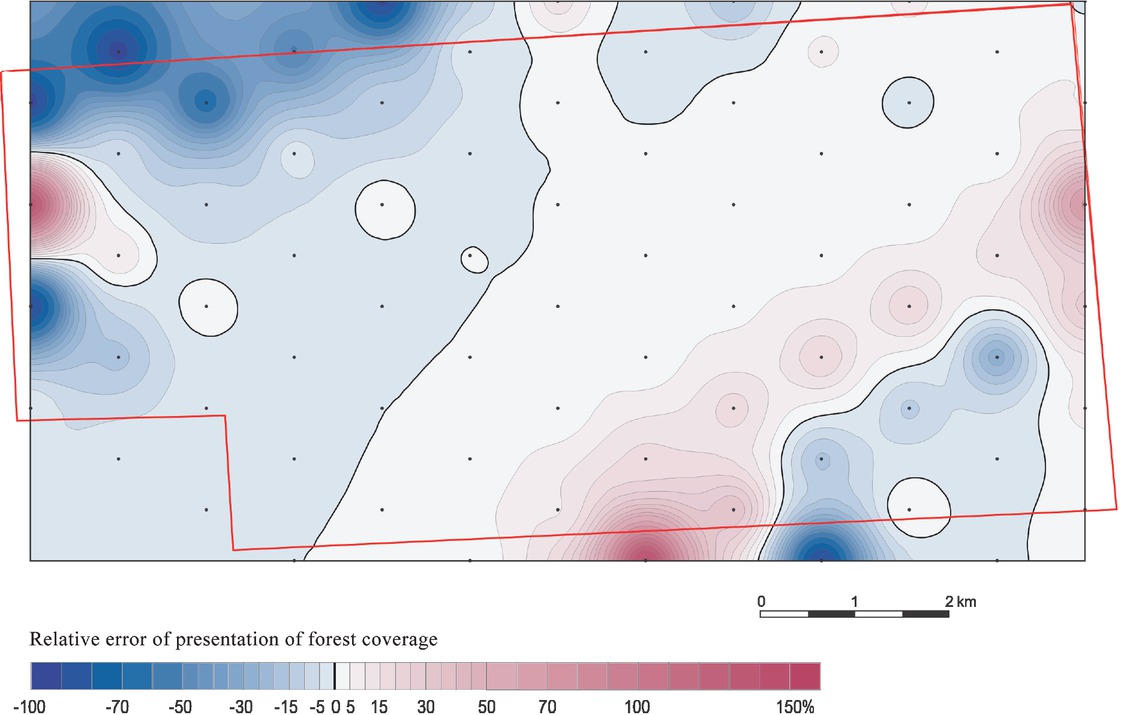
Figure 6
Test polygon A, relative errors for the 1:100 000 GUGIK 80 map
Source: Own work
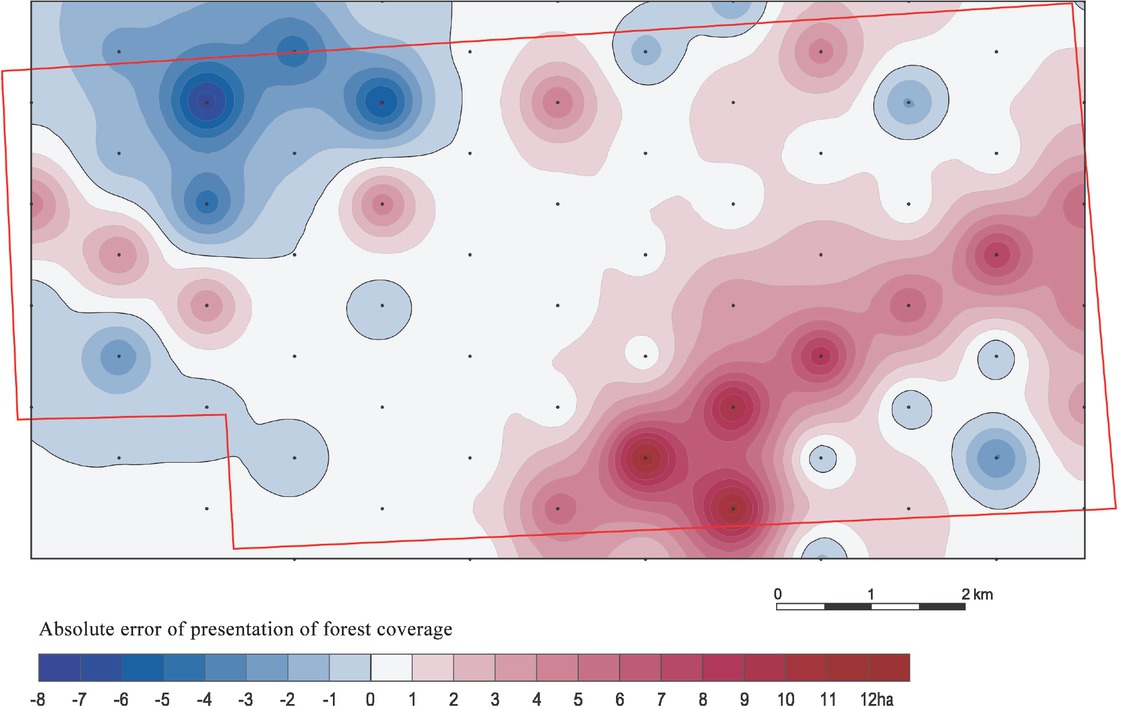
Figure 7
Test polygon A, absolute errors for the 1:100 000 GUGIK 80 map
Source: Own work
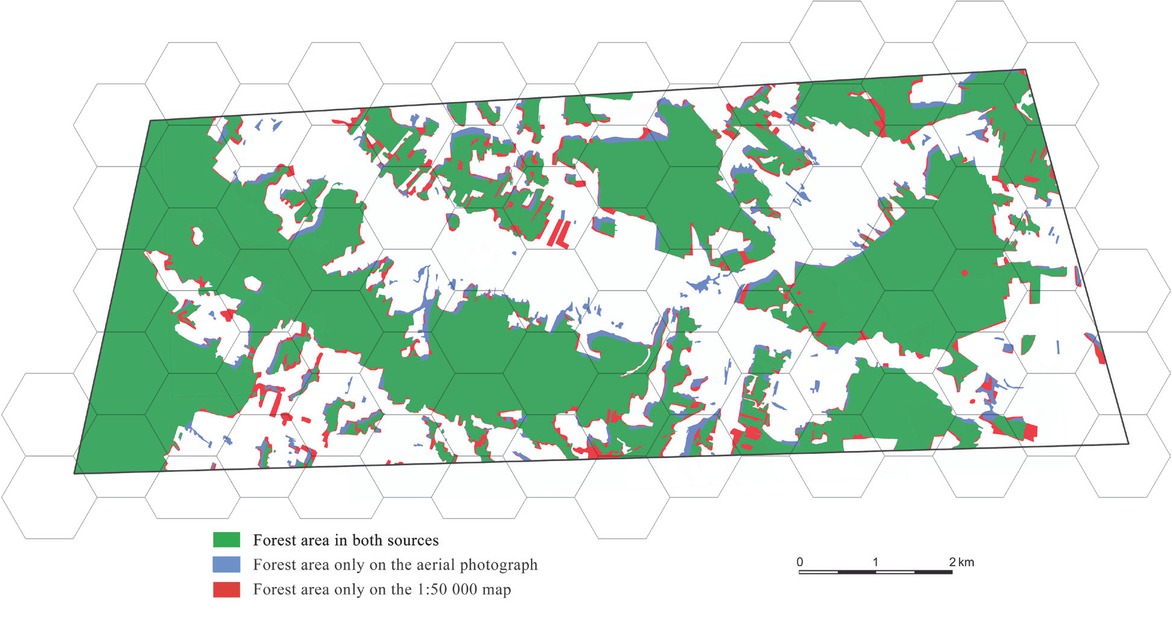
Figure 8
Test polygon B, map of the differences in forest coverage between the aerial photograph and the 1:50 000 GUGIK 65 map
Source: Own work
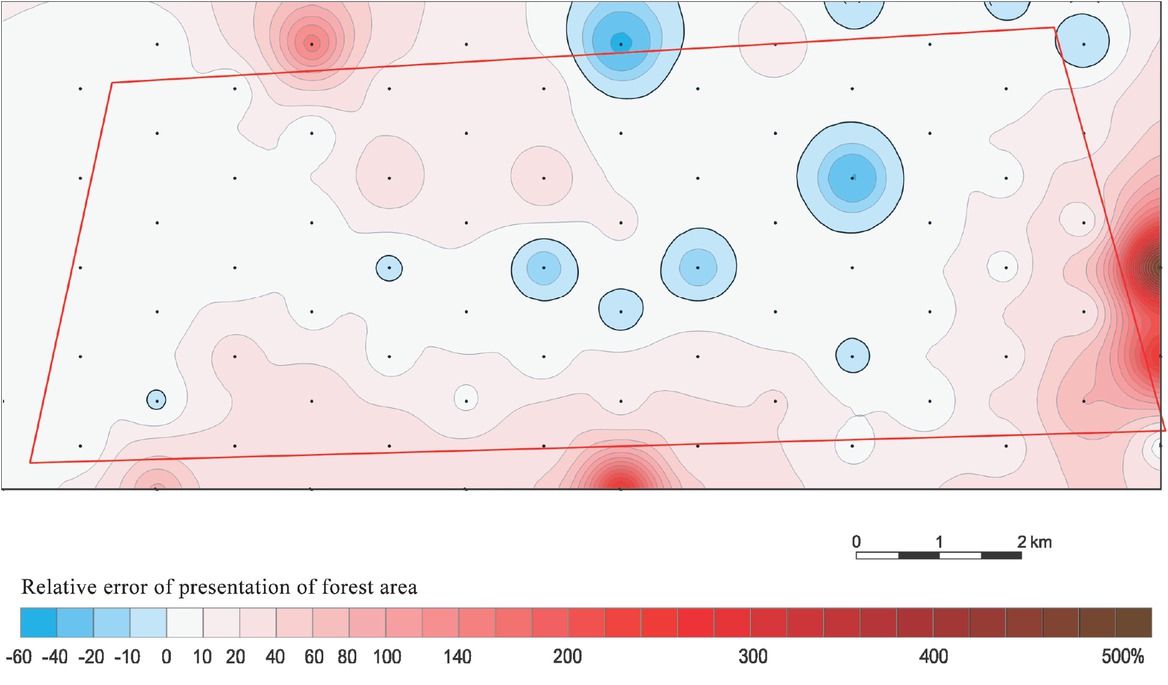
Figure 9
Test polygon B, relative errors for the 1:50 000 GUGIK 65 map
Source: Own work
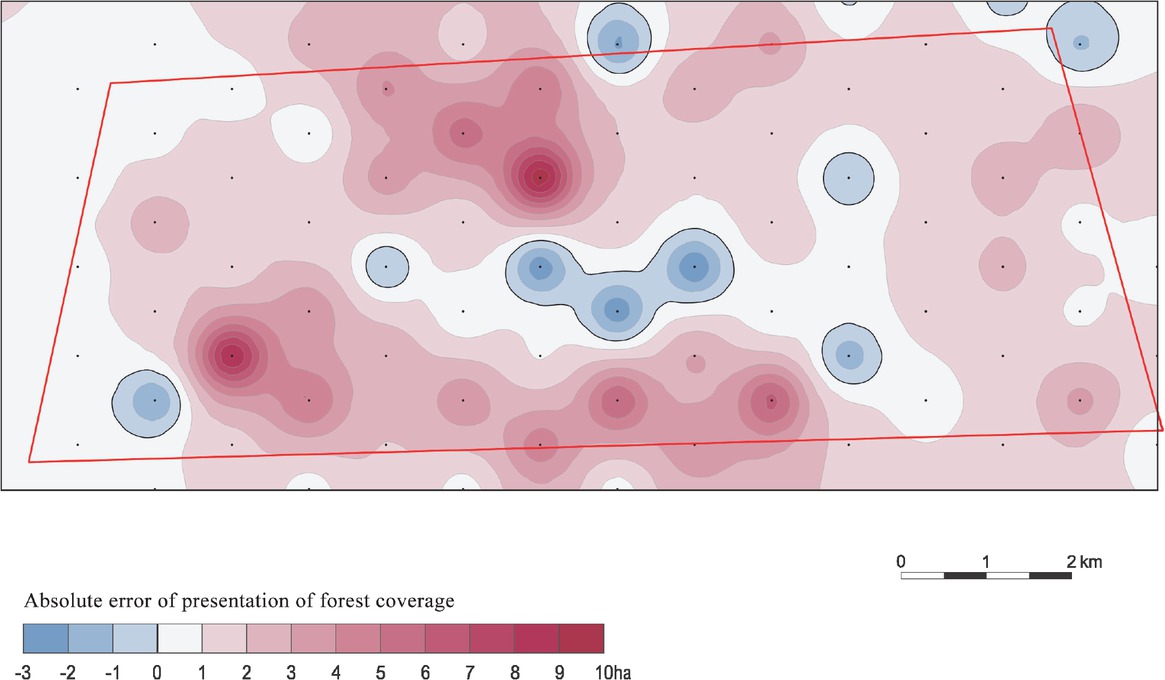
Figure 10
Test polygon B, absolute errors for the 1:50 000 GUGIK 65 map
Source: Own work
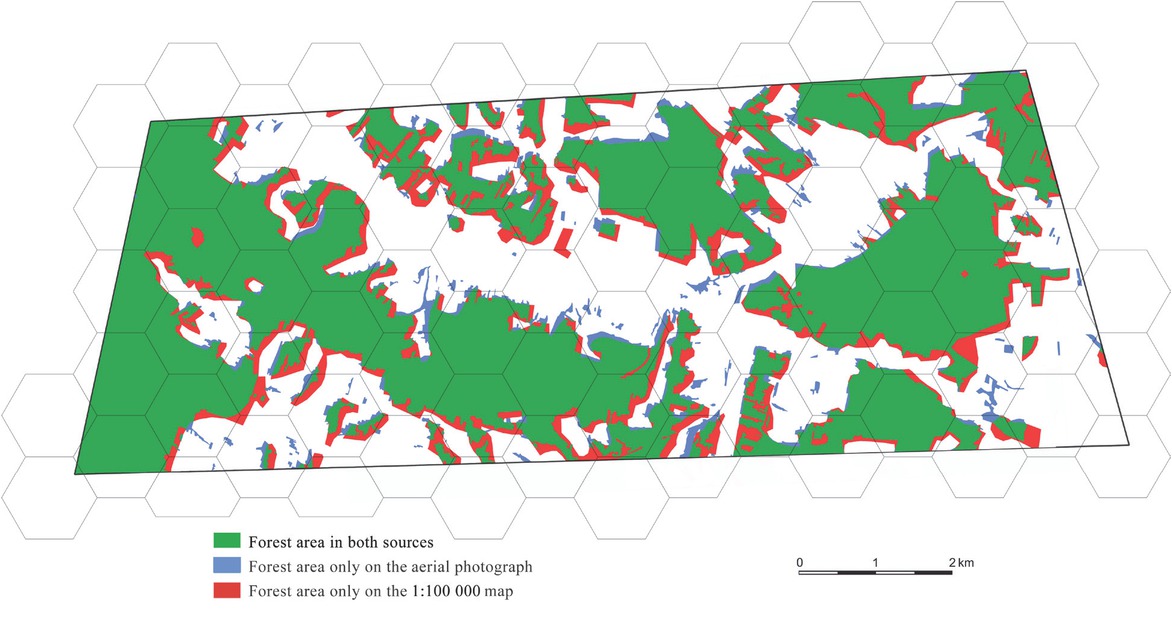
Figure 11
Test polygon B, map of the differences in forest coverage between the aerial photograph and the1:100 000 GUGIK 80 map
Source: Own work
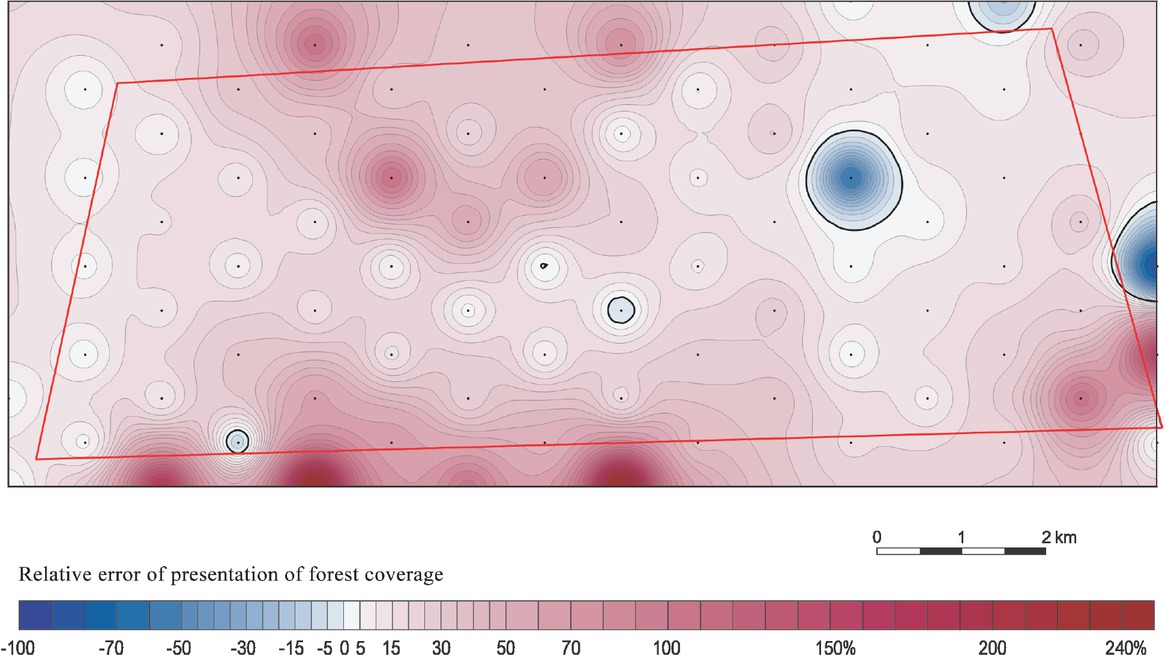
Figure 12
Test polygon B, relative errors for the 1:100 000 GUGIK 80 map
Source: Own work
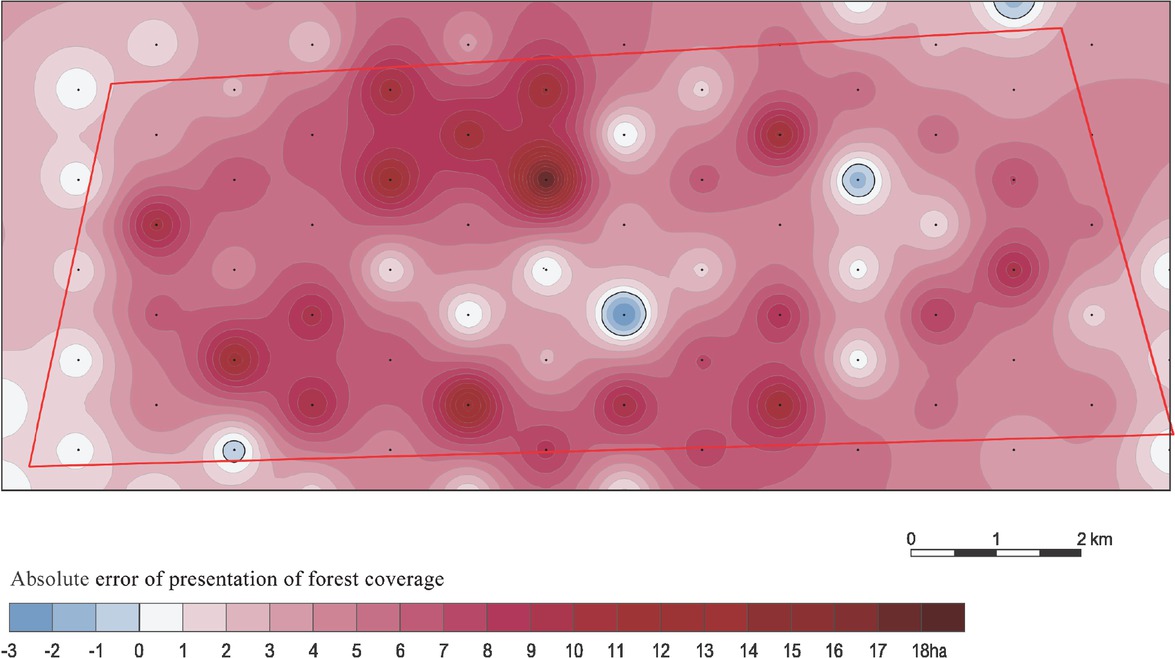
Figure 13
Test polygon B, absolute errors for the 1:100 000 GUGIK 80 map
Source: Own work
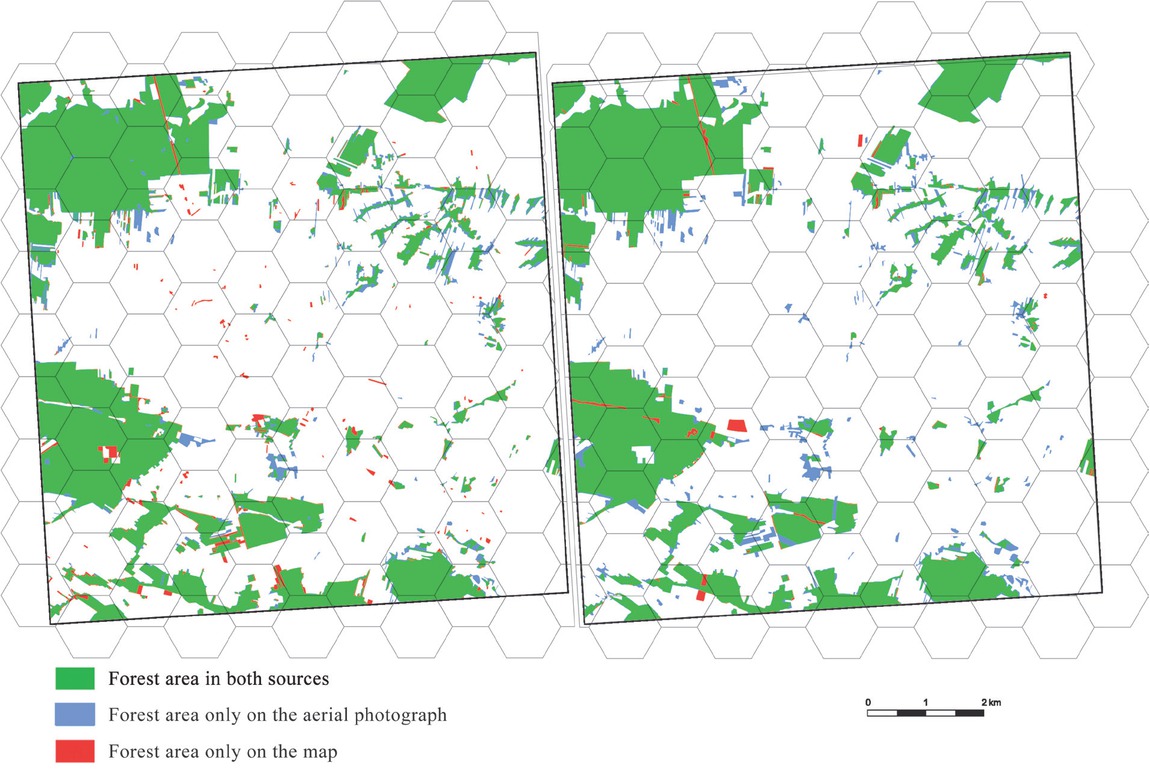
Figure 14
Test polygon C, differences in the forest coverage between the aerial photograph and topographic maps: to the left the 92 1:10 000 map, and to the right the 1:50 000 VMap Level2 map
Source: Own work
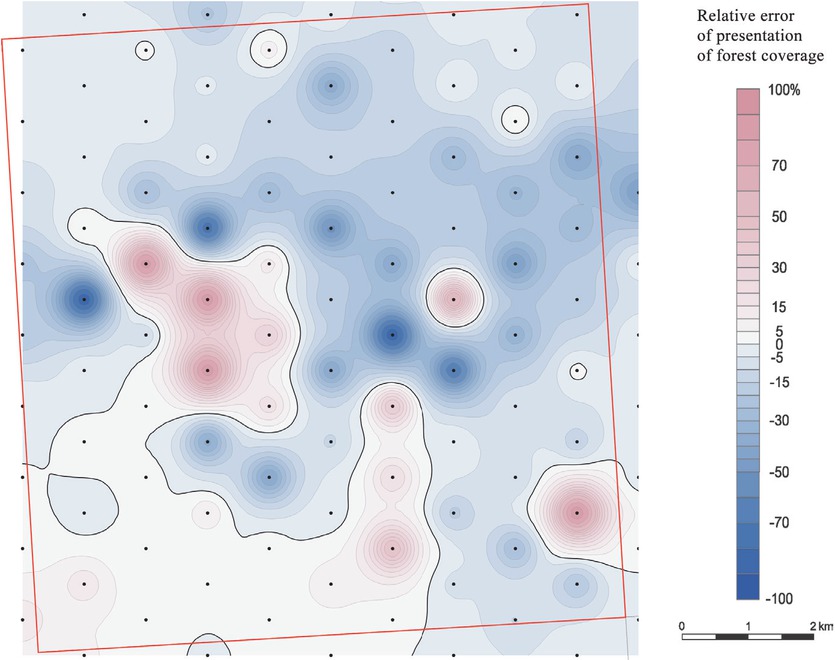
Figure 15
Test polygon C, relative errors for the 1:10 000 in the 92 standard map
Source: Own work
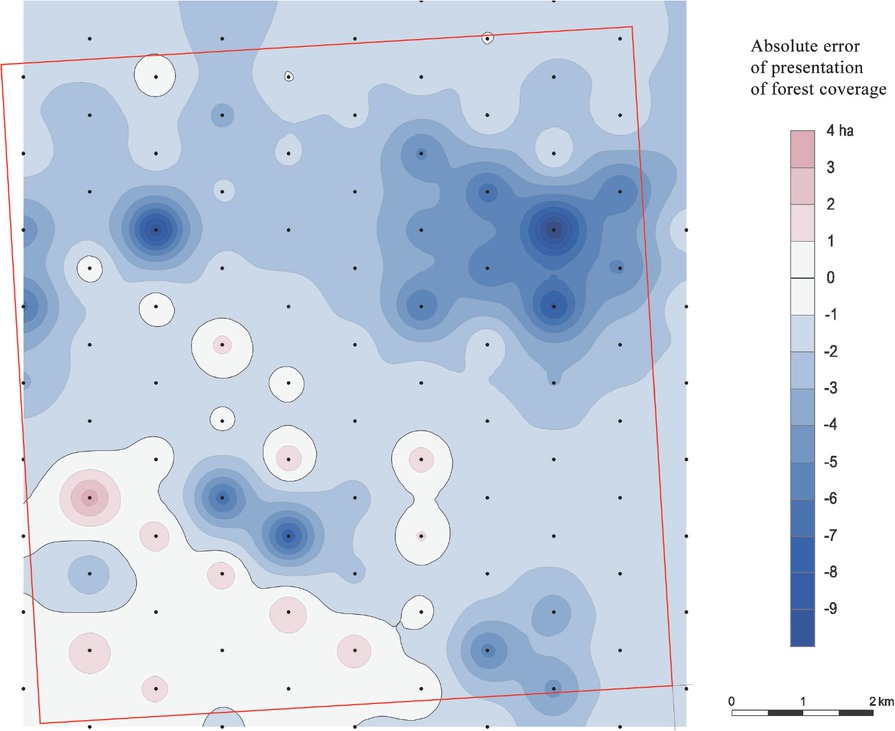
Figure 16
Test polygon C, absolute errors for the 1:10 000 in the 92 standard map
Source: Own work
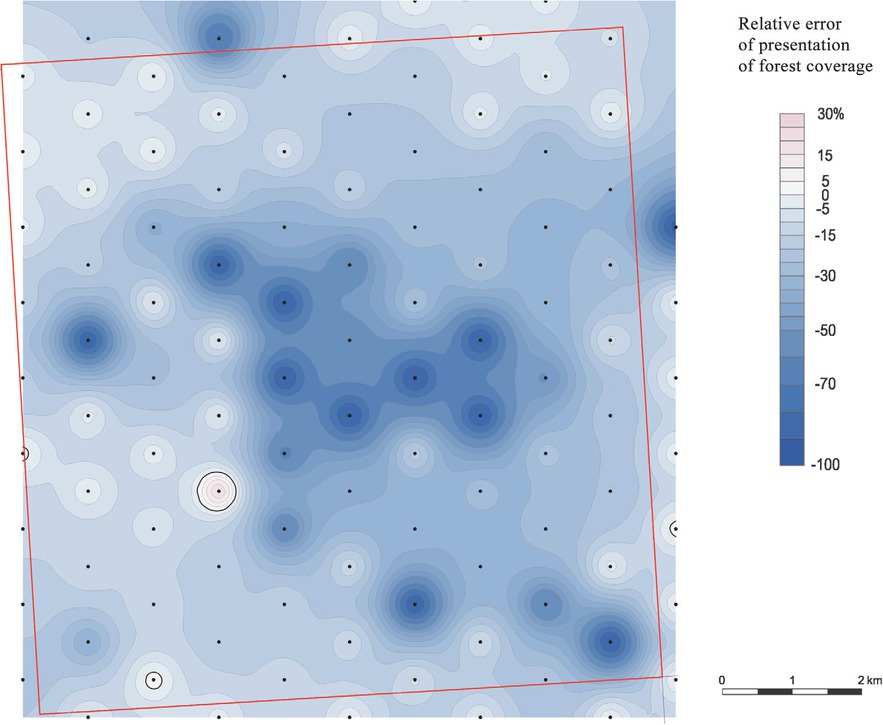
Figure 17
Test polygon C, relative errors for the VMap L2 1:50 000 map
Source: Own work
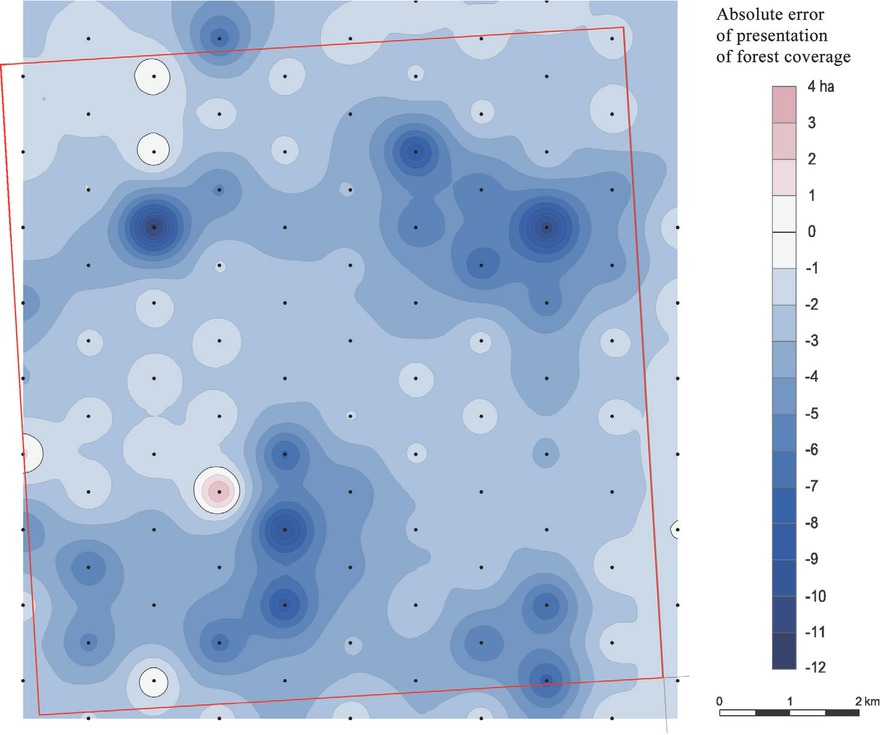
Figure 18
Test polygon C, absolute errors for the VMap L2 1:50 000 map
Source: Own work
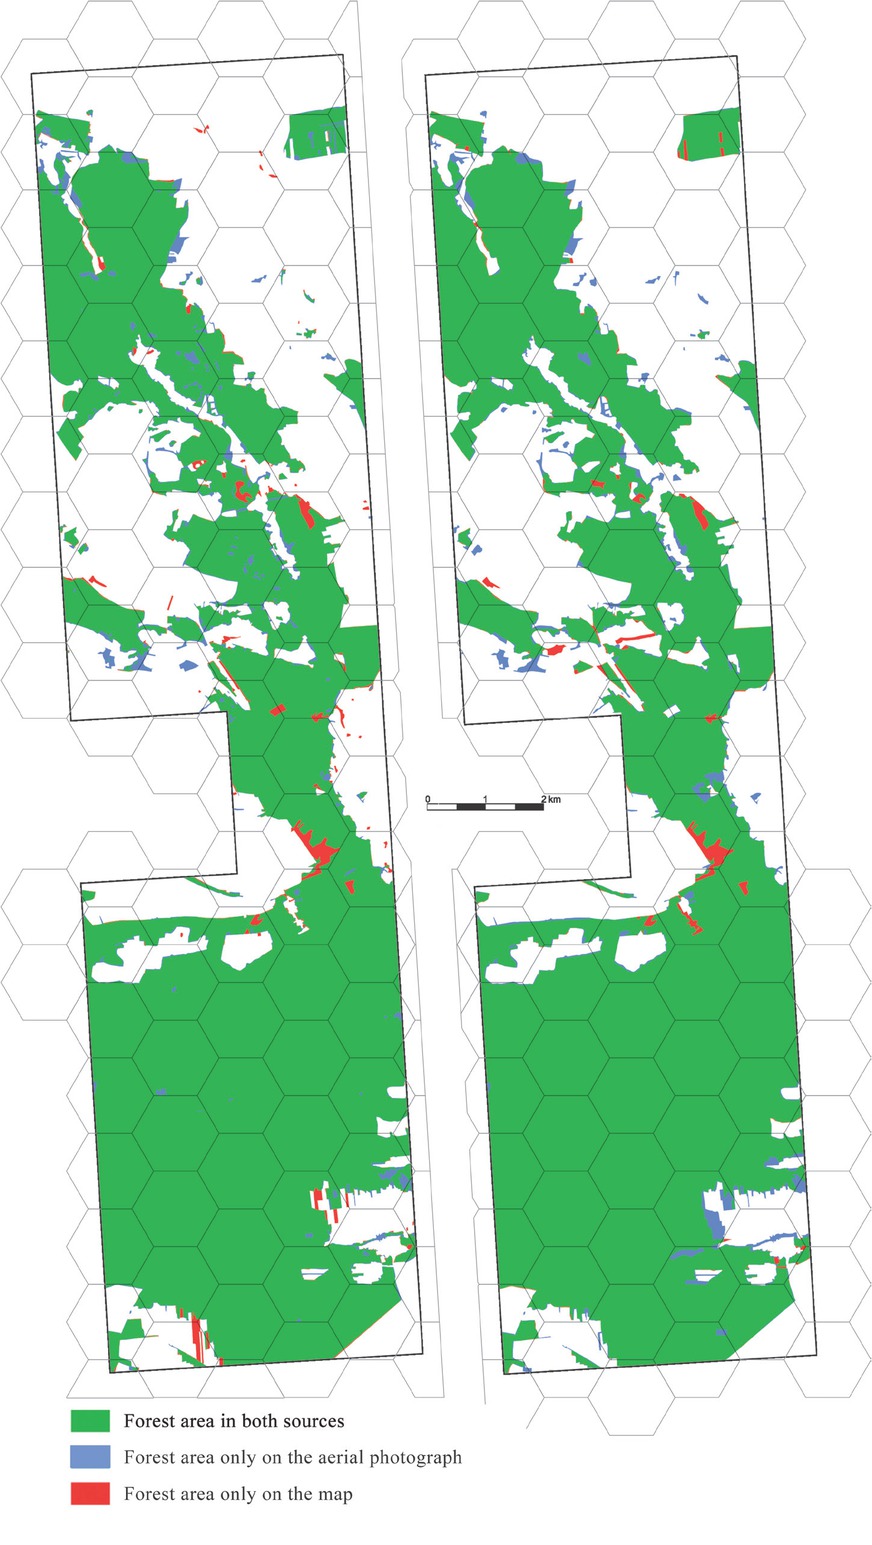
Figure 19
Test polygon D, differences in the forest coverage between the aerial photograph and topographic maps: the 92 1:10 000 map to the left, and the 1:50 000 VMap Level2 map to the right
Source: Own work
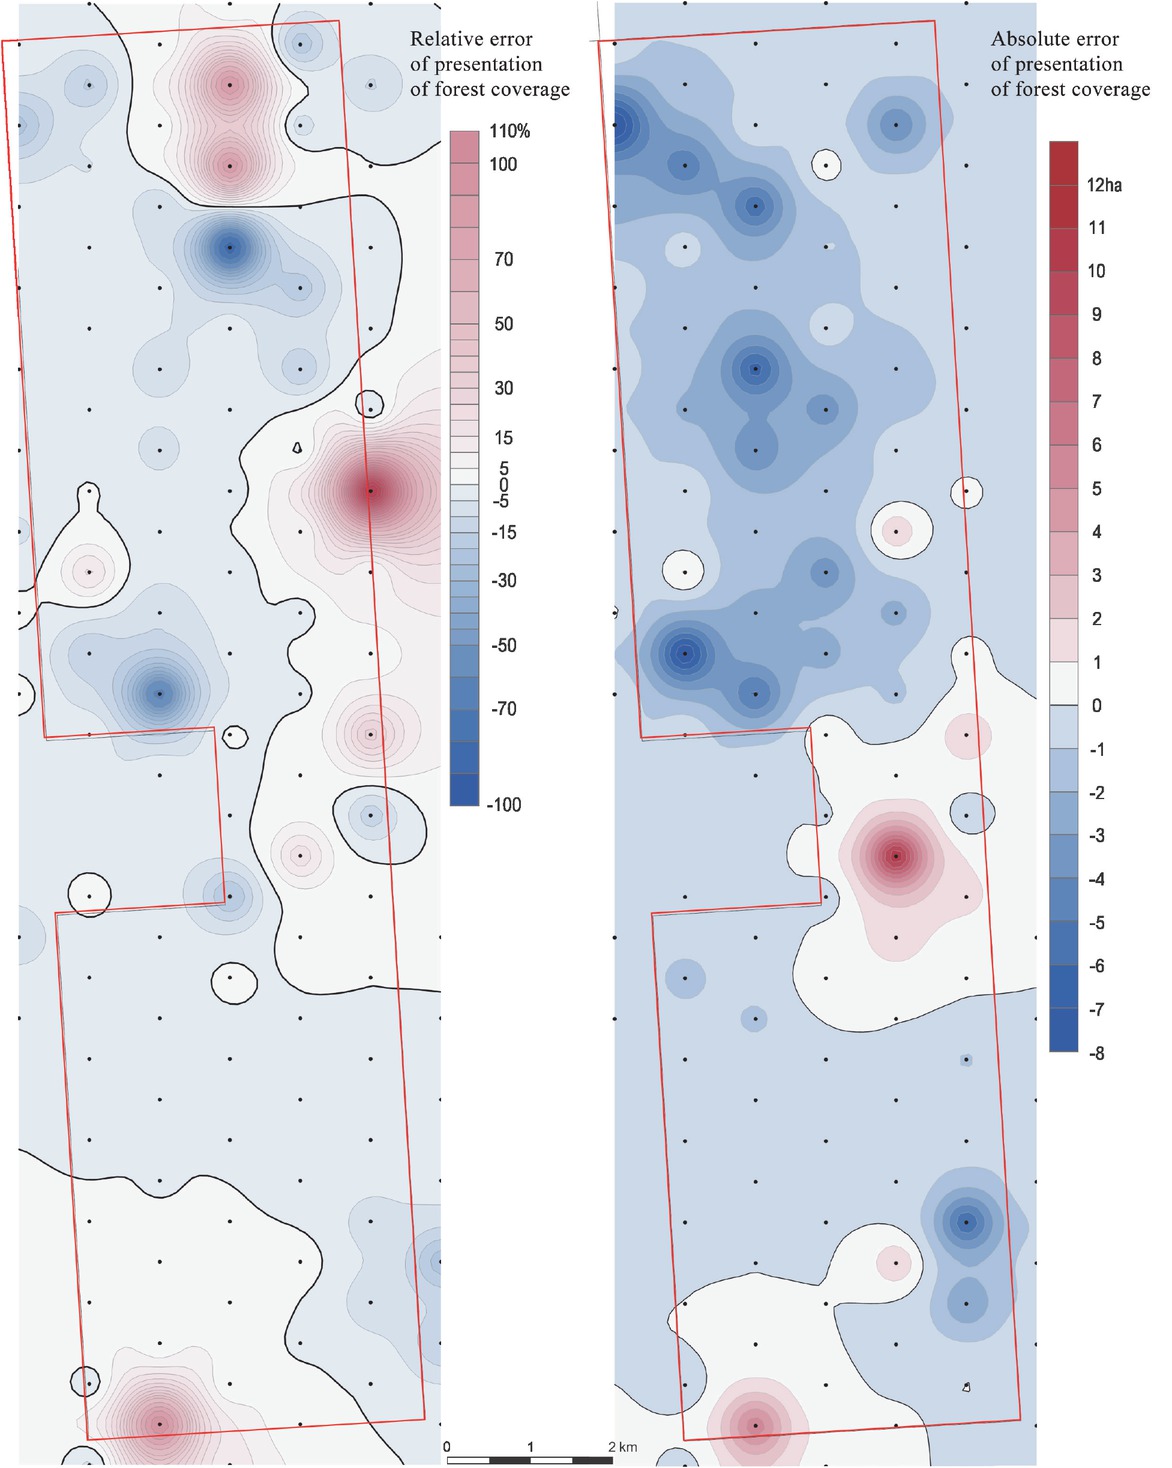
Figure 20
Test polygon D, errors for the 1:10 000 in 92 map system: map of relative errors to the left, map of absolute errors to the right
Source: Own work
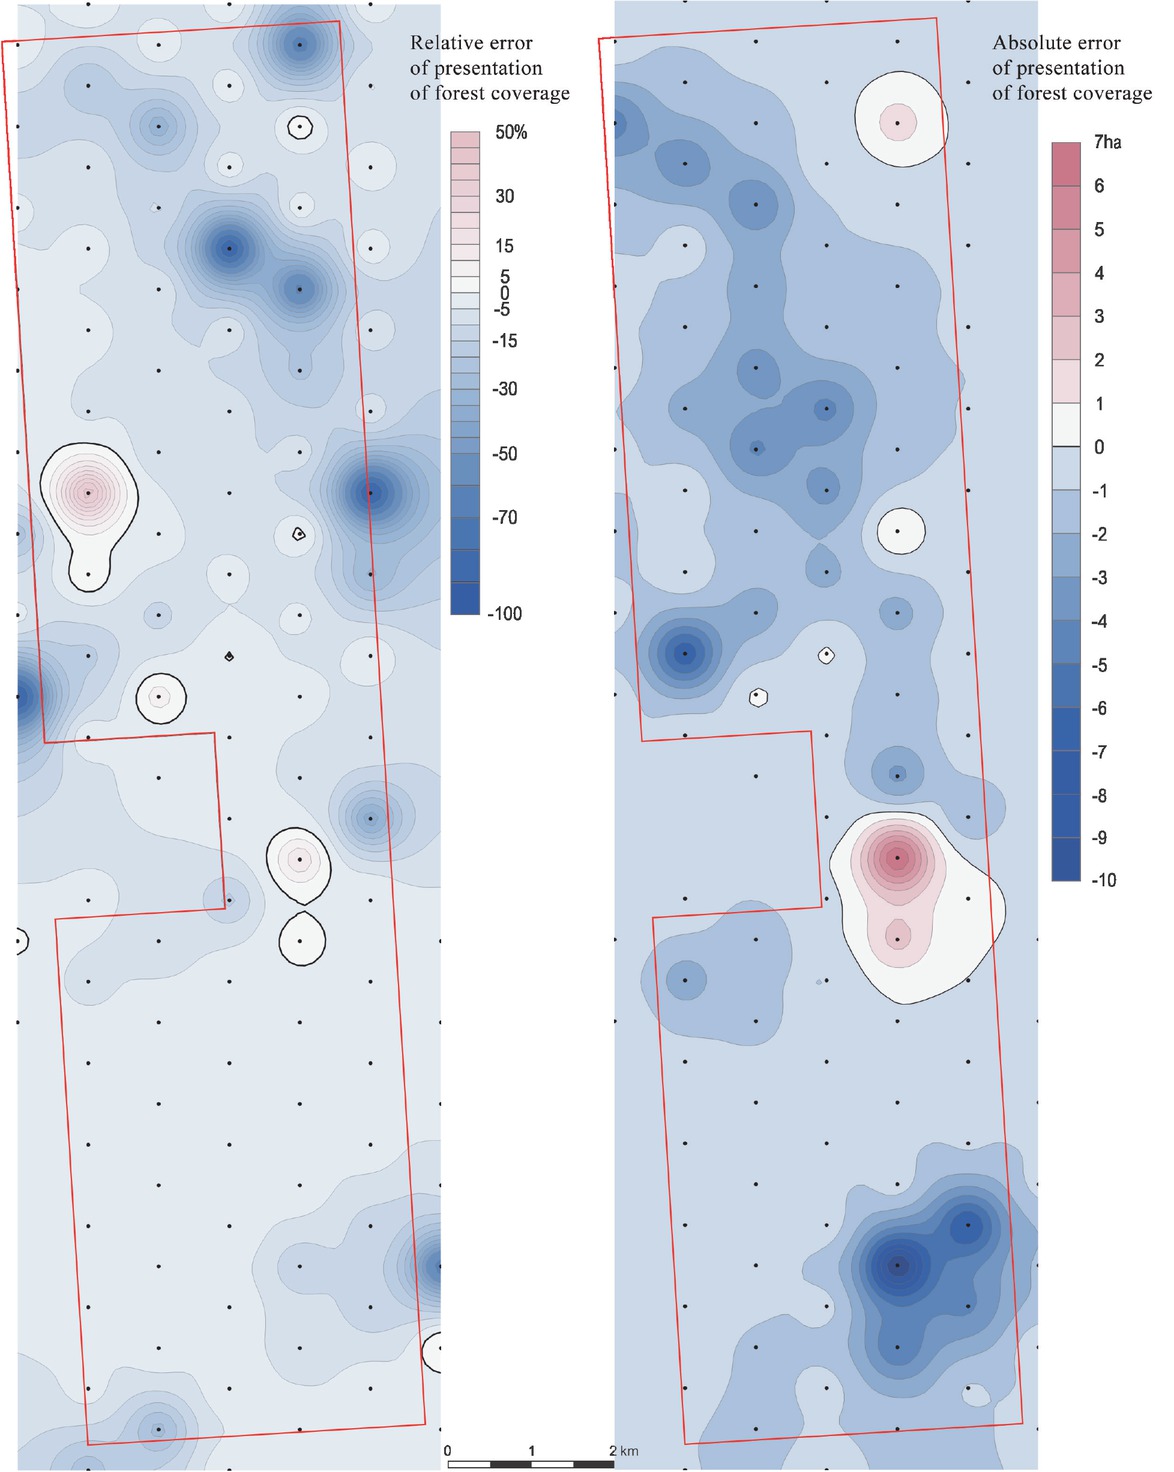
Figure 21
Test polygon D, errors for the VMap L2 1:50 000 map: map of relative errors to the left, map of absolute errors to the right
Source: Own work