
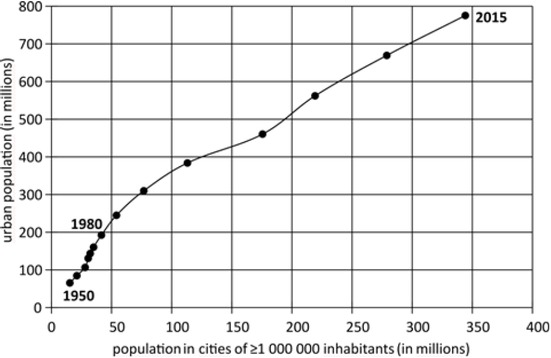
Figure 1
Total urban population and population in million cities in the PRC (excluding Taiwan, Hong Kong and Macau) in the years 1950–2015 (in 5-year intervals)
Source: Own study based on: United Nations, Department of Economic and Social Affairs, Population Division 2018, World Urbanization Prospects: The 2018 Revision
Table 1
Characteristics of million cities in the PRC in 1950–2015 (excluding Taiwan, Hong Kong and Macau)
| Structure of cities | ≥ 1 million | 1–2 million | 2–5 million | 5–10 million | 10–20 million | > 20 million | |
|---|---|---|---|---|---|---|---|
| 1950 | number of cities with a population of 1 million or more | 8 | 5 | 3 | - | - | - |
| population in cities of ≥1 million (in thousands) | 15 295 | 6 393 | 8 903 | - | - | - | |
| population in cities of ≥1 million as a percentage of total urban population | 23.4 | 9.8 | 13.6 | - | - | - | |
| population in cities of ≥1 million as a percentage of total population | 2.8 | 1.2 | 1.6 | - | - | - | |
| 1970 | number of cities with a population of 1 million or more | 14 | 8 | 5 | 1 | - | - |
| population in cities of ≥1 million (in thousands) | 32 192 | 10 963 | 15 176 | 6 052 | - | - | |
| population in cities of ≥1 million as a percentage of total urban population | 22.4 | 7.6 | 10.6 | 4.2 | - | - | |
| population in cities of ≥1 million as a percentage of total population | 3.9 | 1.3 | 1.8 | 0.7 | - | - | |
| 1990 | number of cities with a population of 1 million or more | 34 | 20 | 12 | 2 | - | - |
| population in cities of ≥1 million (in thousands) | 76 795 | 25 275 | 36 126 | 15 394 | - | - | |
| population in cities of ≥1 million as a percentage of total urban population | 24.8 | 8.2 | 11.7 | 5.0 | - | - | |
| population in cities of ≥1 million as a percentage of total population | 6.5 | 2.2 | 3.1 | 1.3 | - | - | |
| 2010 | number of cities with a population of 1 million or more | 86 | 45 | 26 | 9 | 5 | 1 |
| population in cities of ≥1 million (in thousands) | 278 852 | 62 330 | 80 576 | 57 295 | 58 336 | 20 314 | |
| population in cities of ≥1 million as a percentage of total urban population | 41.7 | 9.3 | 12.0 | 8.6 | 8.7 | 3.0 | |
| population in cities of ≥1 million as a percentage of total population | 20.5 | 4.6 | 5.9 | 4.2 | 4.3 | 1.5 | |
| 2015 | number of cities with a population of 1 million or more | 109 | 61 | 31 | 11 | 5 | 1 |
| population in cities of ≥1 million (in thousands) | 344 153 | 81 287 | 98 159 | 73 946 | 67 280 | 23 482 | |
| population in cities of ≥1 million as a percentage of total urban population | 44.4 | 10.5 | 12.7 | 9.5 | 8.7 | 3.0 | |
| population in cities of ≥1 million as a percentage of total population | 24.6 | 5.8 | 7 | 5.3 | 4.8 | 1.7 | |
[i] Source: Own study based on: United Nations, Department of Economic and Social Affairs, Population Division 2018, World Urbanization Prospects: The 2018 Revision
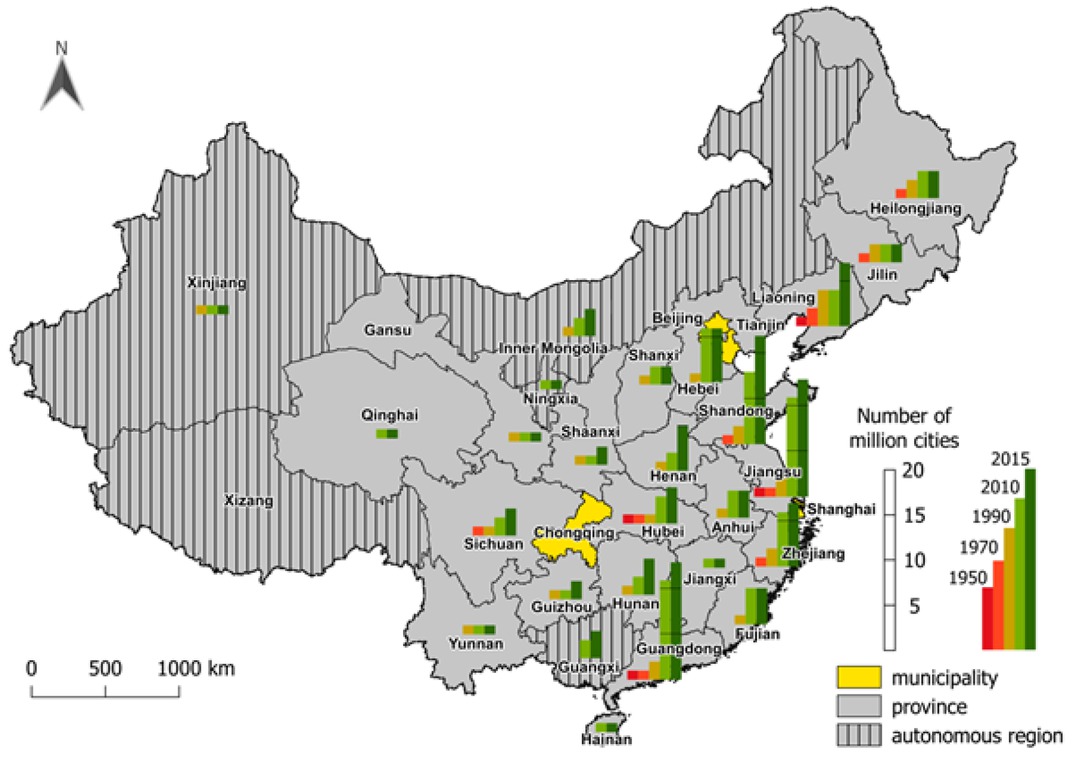
Figure 2
Number of cities in PRC with a population of 1 million or more, by province, 1950–2015
Source: Own study based on: United Nations, Department of Economic and Social Affairs, Population Division 2018, World Urbanization Prospects: The 2018 Revision
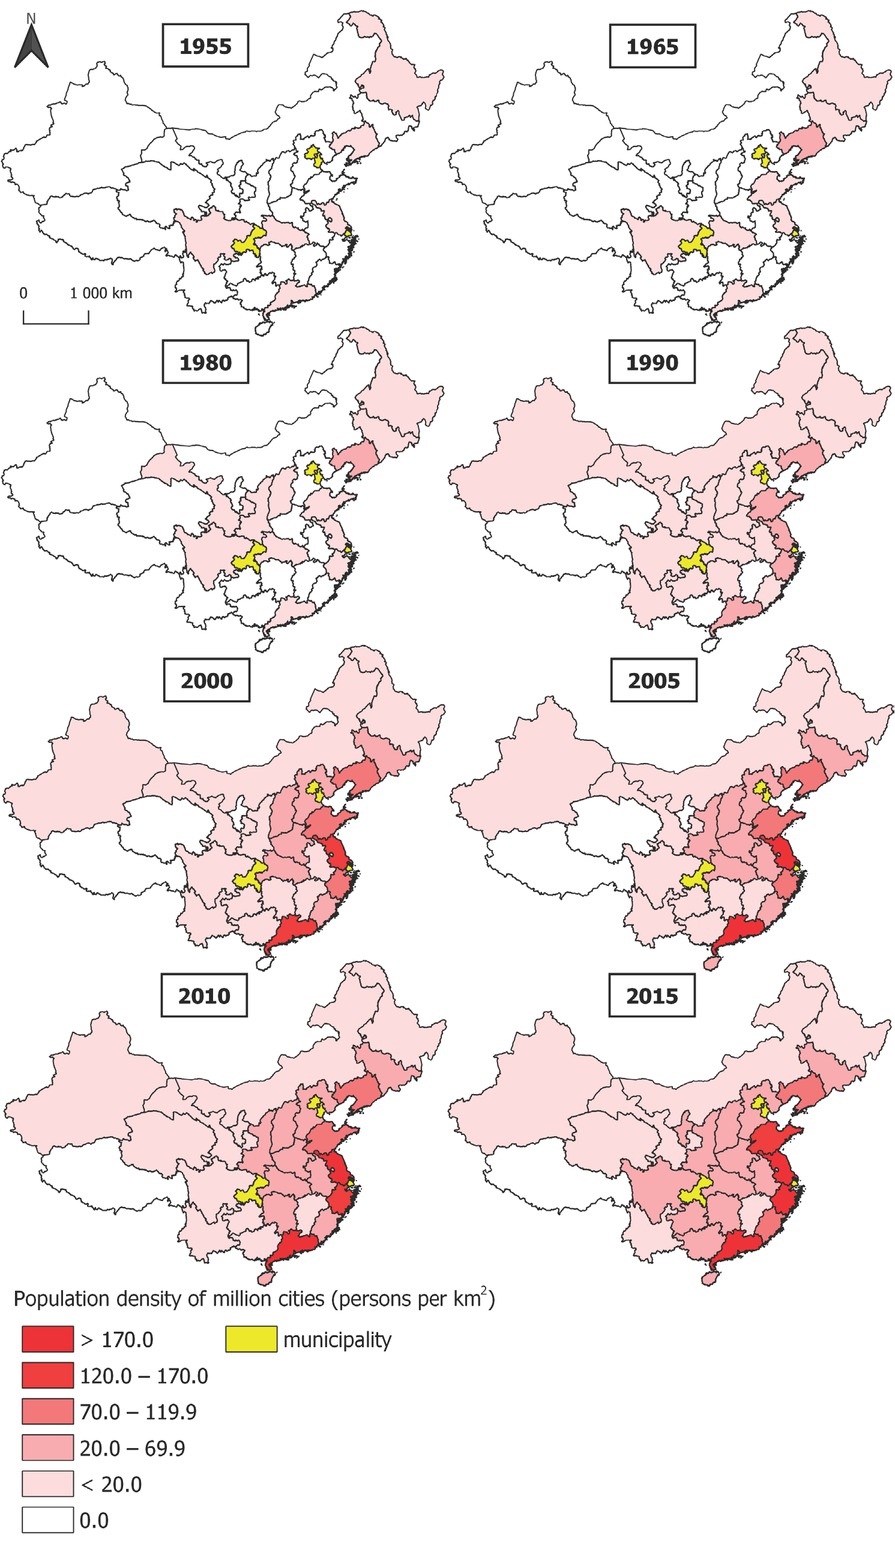
Figure 3
Population density of million cities (persons per km2) in PRC by province, 1955–2015
Source: Own study based on: United Nations, Department of Economic and Social Affairs, Population Division 2018, World Urbanization Prospects: The 2018 Revision and National Bureau of Statistics of China 2018
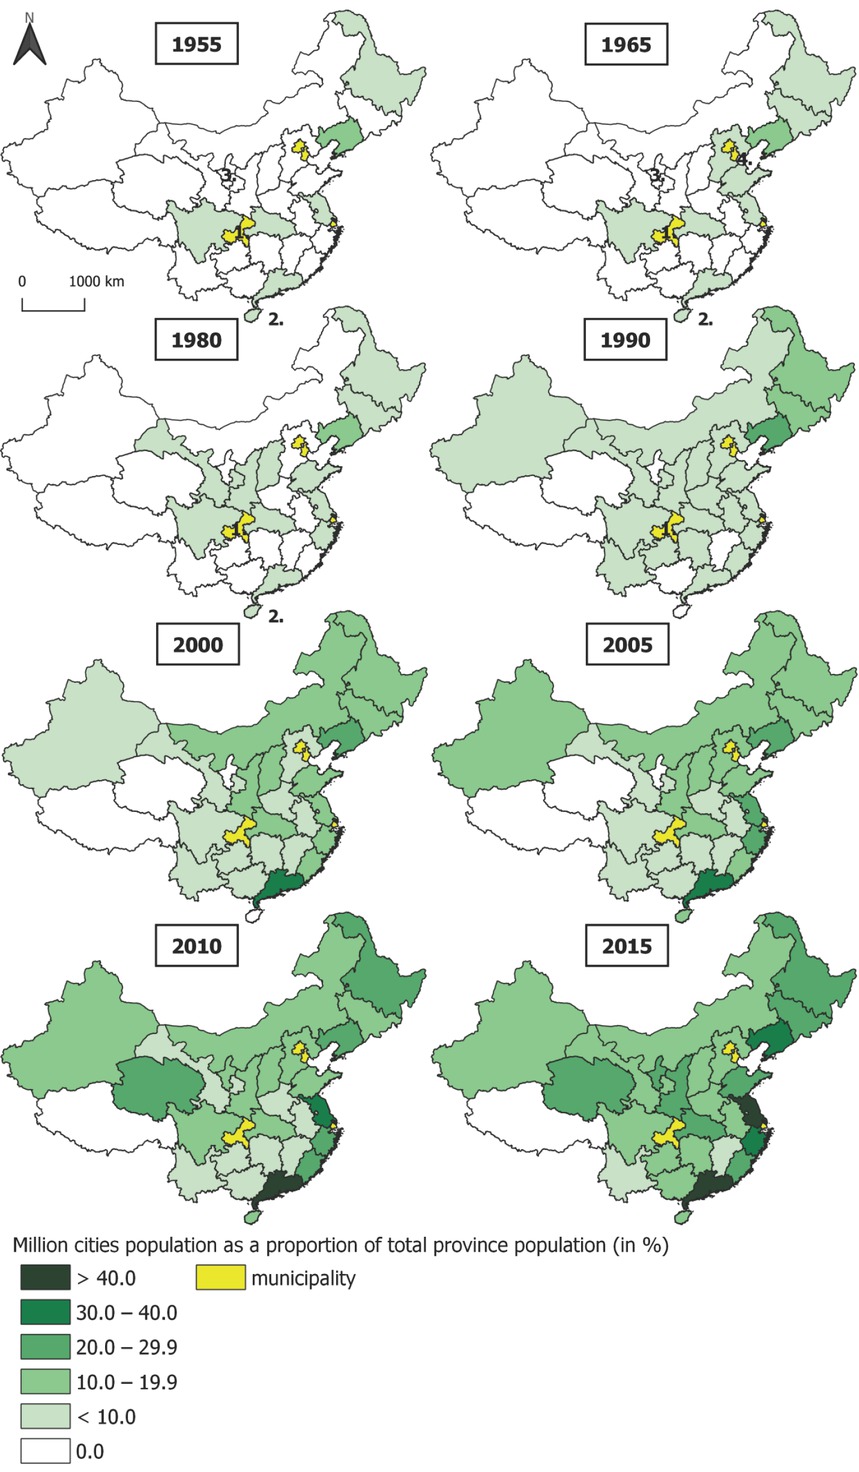
Figure 4
Million city population as a proportion of total province population (in %) in China, 1955–2015 Source: Own study based on: United Nations, Department of Economic and Social Affairs, Population Division 2018, World Urbanization Prospects: The 2018 Revision and National Bureau of Statistics of China 2018
Notes: 1. Chongqing during the censuses of 1954, 1964, 1980 and 1990 was part of the Sichuan province; 2. Hainan during the censuses of 1954, 1964 and 1980 was part of the Guangdong province; 3. Ningxia during the census of 1954 and 1964 was part of the Gansu province; 4. Tianjin during the census of 1964 was part of the Hebei province
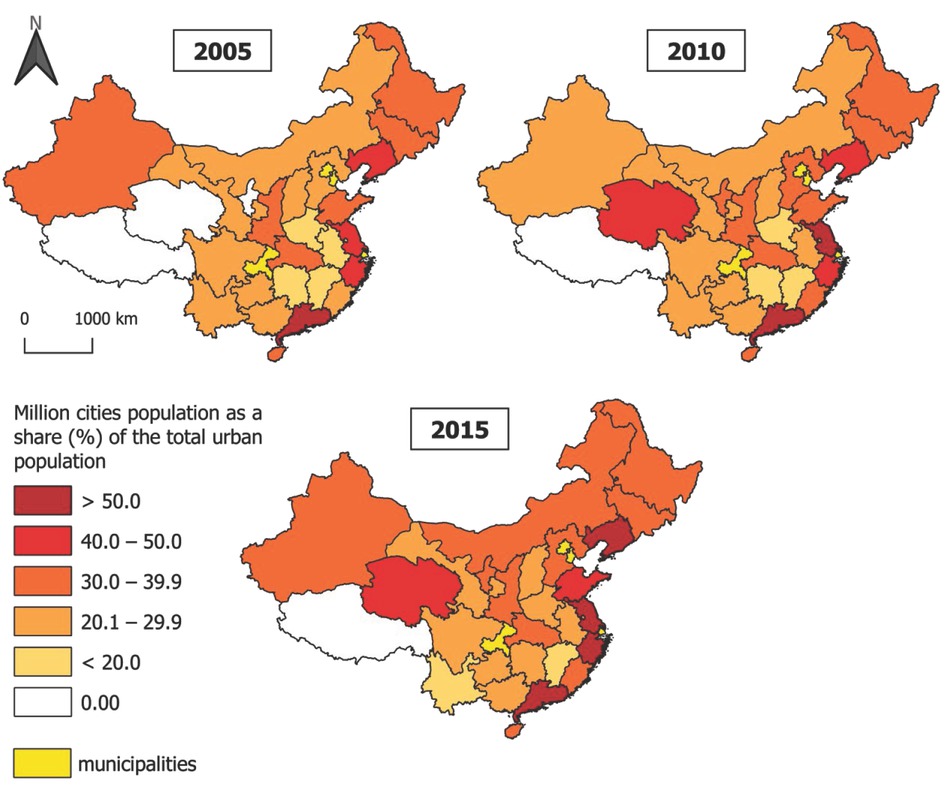
Figure 5
Million city populations as a share (%) of the total urban population of a given province, 2005–2015
Source: Own study based on: United Nations, Department of Economic and Social Affairs, Population Division 2018, World Urbanization Prospects: The 2018 Revision and National Bureau of Statistics of China 2018
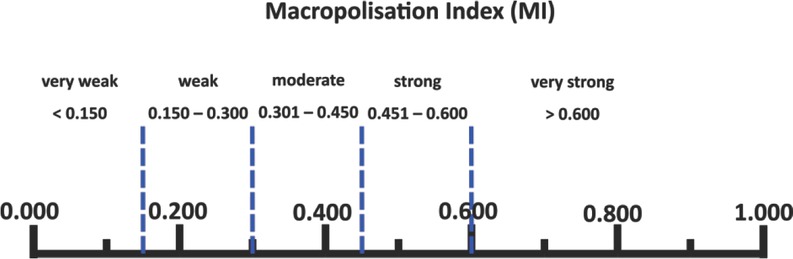
Figure 6
Macropolization index value
Source: Own study
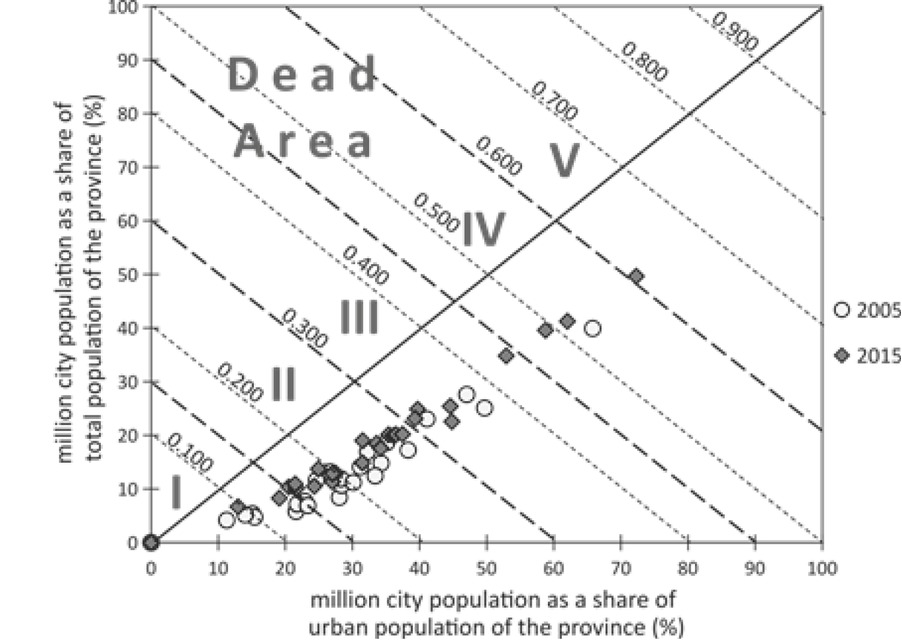
Figure 7
Distribution of provinces by million city population (%) relative to urban population and total population, and MI index value in 2005 and 2015
Source: Own study based on: United Nations, Department of Economic and Social Affairs, Population Division 2018, World Urbanization Prospects: The 2018 Revision
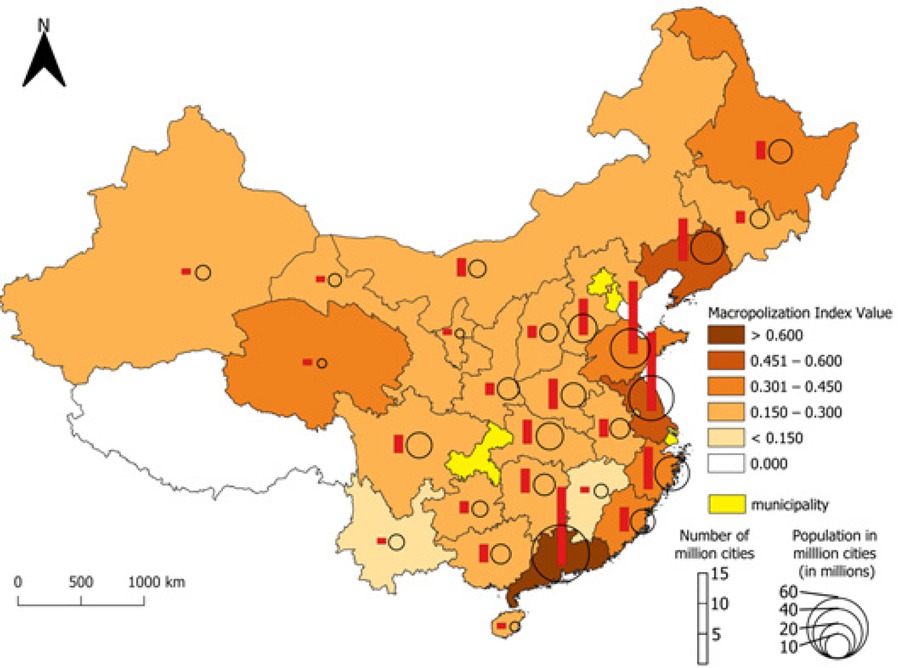
Figure 8
Provinces in China by size of million cities, number of million cities, and macropolization index value, 2015
Source: Own study based on: United Nations, Department of Economic and Social Affairs, Population Division 2018, World Urbanization Prospects: The 2018 Revision and National Bureau of Statistics of China 2018