
Figure 1
Figure 2
Figure 3
Figure 4
Figure 5
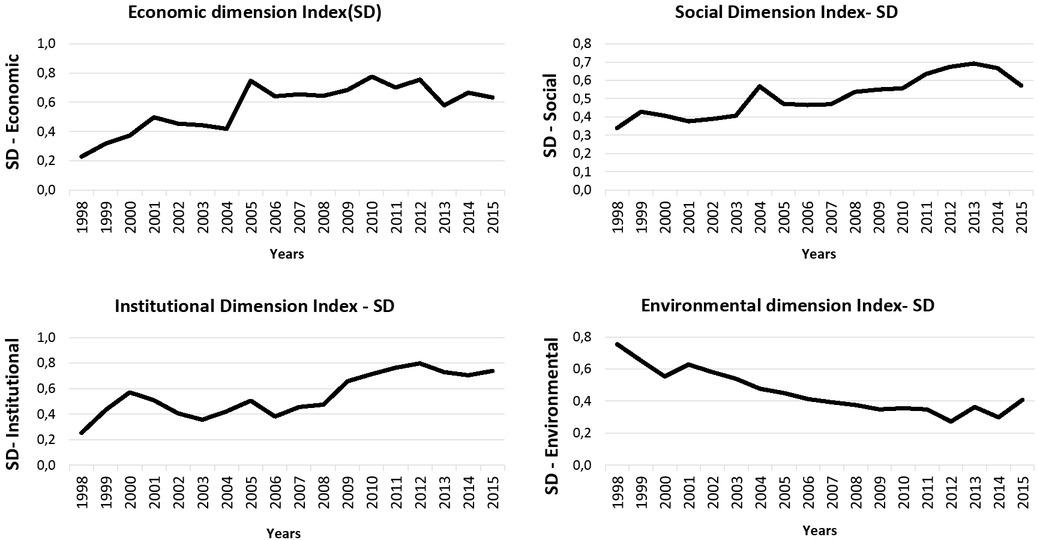
Figure 6
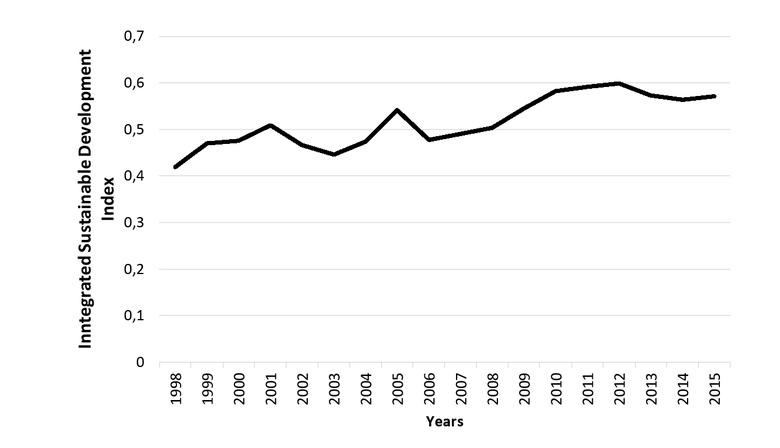
Figure 7
Distribution of sustainable development, 1998–2015
| Year | Economic dimension index (SD) | Social dimension index (SD) | Index institutional dimension (SD) | Environmental dimension index (SD) | Integrated index of sustainable development (S3) | System status according to (S3) |
|---|---|---|---|---|---|---|
| 1998 | 0.229 | 0.340 | 0.253 | 0.755 | 0.419 | The system in Huila during the period 1998 to 2015, was highly unstable |
| 1999 | 0.320 | 0.429 | 0.434 | 0.652 | 0.470 | |
| 2000 | 0.373 | 0.408 | 0.571 | 0.554 | 0.476 | |
| 2001 | 0.498 | 0.376 | 0.509 | 0.628 | 0.509 | |
| 2002 | 0.453 | 0.390 | 0.407 | 0.581 | 0.467 | |
| 2003 | 0.443 | 0.407 | 0.358 | 0.539 | 0.446 | |
| 2004 | 0.419 | 0.567 | 0.422 | 0.477 | 0.474 | |
| 2005 | 0.749 | 0.472 | 0.507 | 0.449 | 0.541 | |
| 2006 | 0.643 | 0.465 | 0.382 | 0.414 | 0.477 | |
| 2007 | 0.654 | 0.470 | 0.456 | 0.394 | 0.490 | |
| 2008 | 0.645 | 0.538 | 0.474 | 0.375 | 0.503 | |
| 2009 | 0.684 | 0.550 | 0.659 | 0.350 | 0.545 | |
| 2010 | 0.776 | 0.556 | 0.715 | 0.355 | 0.582 | |
| 2011 | 0.701 | 0.635 | 0.765 | 0.349 | 0.592 | |
| 2012 | 0.756 | 0.673 | 0.798 | 0.273 | 0.599 | |
| 2013 | 0.578 | 0.693 | 0.730 | 0.365 | 0.573 | |
| 2014 | 0.665 | 0.668 | 0.704 | 0.299 | 0.564 | |
| 2015 | 0.632 | 0.573 | 0.740 | 0.407 | 0.571 |
Variables for each dimension
| DIMENSIONS | |||
|---|---|---|---|
| ECONOMIC | SOCIAL | INSTITUTIONAL | ENVIRONMENTAL |
| Generate own resources | Population | participation Departmental percentage electoral | Residential gas consumption |
| Savings capacity | PET percentage | Departmental electoral abstention | Residential consumption energy |
| Income per capita | Reason dependence for economic | Forced displacement or expulsion | CO2 emission intensity |
| Fiscal performance index | Aging index | Homicides | Demographic density |
| Reliance royalties on transfers and | Births | Emigration per capita | Rural index |
| Magnitude of investment | Affiliation with subsidy system | Investment per capita | |
| Coefficient of variation per capita | Percentage of subsidy system coverage | ||
| Agribusiness credits | Mortality rate | ||
| Agricultural GDP at constant prices (2005) | Uninsured poor population | ||
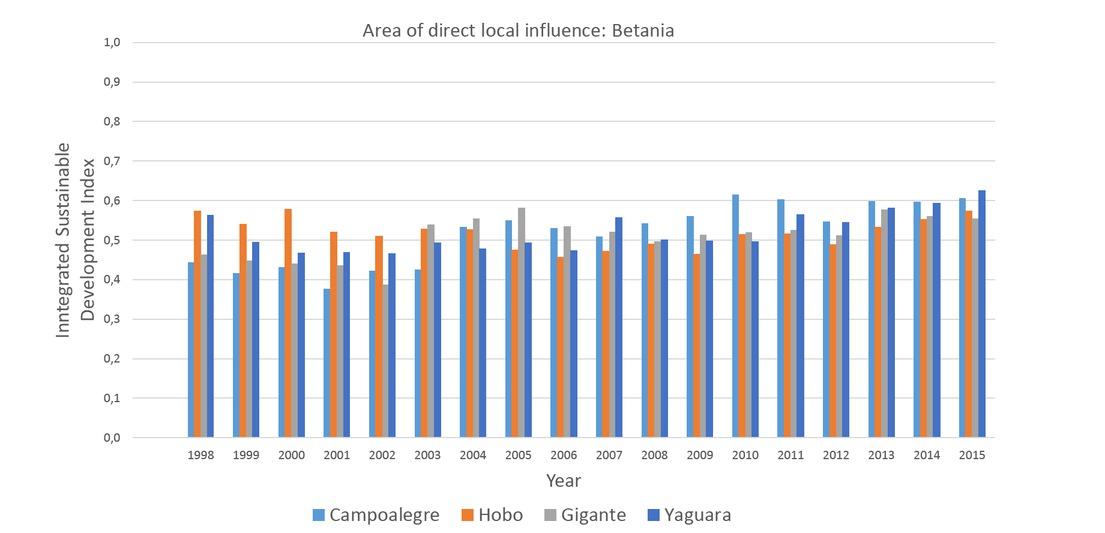
Distribution of the Integrated Sustainable Development Index (S3), by areas under direct local influence of El Quimbo, 1998–2015
| Area of Direct Local Influence: El Quimbo | ||||||
|---|---|---|---|---|---|---|
| Year | Agrado | Altamira | Garzón | Gigante | Paicol | Tesalia |
| 1998 | 0.458 | 0.486 | 0.464 | 0.463 | 0.461 | 0.503 |
| 1999 | 0.440 | 0.476 | 0.481 | 0.447 | 0.426 | 0.470 |
| 2000 | 0.428 | 0.467 | 0.455 | 0.440 | 0.359 | 0.377 |
| 2001 | 0.432 | 0.442 | 0.451 | 0.436 | 0.356 | 0.408 |
| 2002 | 0.381 | 0.429 | 0.450 | 0.387 | 0.354 | 0.408 |
| 2003 | 0.444 | 0.421 | 0.533 | 0.539 | 0.433 | 0.463 |
| 2004 | 0.532 | 0.491 | 0.568 | 0.555 | 0.553 | 0.449 |
| 2005 | 0.492 | 0.425 | 0.632 | 0.582 | 0.516 | 0.412 |
| 2006 | 0.517 | 0.461 | 0.656 | 0.535 | 0.540 | 0.410 |
| 2007 | 0.509 | 0.475 | 0.574 | 0.521 | 0.528 | 0.507 |
| 2008 | 0.511 | 0.516 | 0.546 | 0.496 | 0.522 | 0.492 |
| 2009 | 0.524 | 0.537 | 0.567 | 0.512 | 0.548 | 0.501 |
| 2010 | 0.581 | 0.569 | 0.593 | 0.519 | 0.580 | 0.522 |
| 2011 | 0.606 | 0.565 | 0.631 | 0.525 | 0.592 | 0.578 |
| 2012 | 0.619 | 0.573 | 0.594 | 0.512 | 0.547 | 0.565 |
| 2013 | 0.640 | 0.641 | 0.646 | 0.577 | 0.615 | 0.544 |
| 2014 | 0.578 | 0.615 | 0.648 | 0.561 | 0.634 | 0.558 |
| 2015 | 0.606 | 0.675 | 0.664 | 0.555 | 0.697 | 0.570 |
| Harmonic mean | 0.506 | 0.505 | 0.554 | 0.503 | 0.495 | 0.477 |
Biogram: Evaluation of the system in accordance with the index range
| Index range | State of sustainable development |
|---|---|
| >0.8<=1.0 | Optimum |
| >0.6<=0.8 | Stable |
| >0.4<=0.6 | Unstable |
| >0.2<=0.4 | Critical |
| >0.0<=0.2 | Collapse |